R E S E A R C H A R T I C L E
Open Access
Diabetic kidney disease in the elderly:
prevalence and clinical correlates
Giuseppina T. Russo
1,9*, Salvatore De Cosmo
2, Francesca Viazzi
3, Antonio Mirijello
2, Antonio Ceriello
4,5,
Pietro Guida
6, Carlo Giorda
7, Domenico Cucinotta
1, Roberto Pontremoli
3, Paola Fioretto
8and the AMD-Annals Study Group
Abstract
Background: Diabetic kidney disease (DKD) is a major burden in elderly patients with type 2 diabetes (T2DM). Low estimated glomerular filtration rate (eGFR+, < 60 mL/min/1.73 m2) and albuminuria (Alb+) are essential for the diagnosis of DKD, but their association with clinical variables and quality of care may be influenced by ageing. Methods: Here we investigated the association of clinical variables and quality of care measures with eGFR+ and Alb+ in 157,595 T2DM individuals participating to the Italian Association of Clinical Diabetologists (AMD) Annals Initiative, stratified by age.
Results: The prevalence of eGFR+ and Alb+ increased with ageing, although this increment was more pronounced for low eGFR. Irrespective of age, both the eGFR+ and Alb + groups had the worst risk factors profile when compared to subjects without renal disease, showing a higher prevalence of out-of target values of HbA1c, BMI, triglycerides, HDL-C, blood pressure and more complex cardiovascular (CVD) and anti-diabetic therapies, including a larger use of insulin In all age groups, these associations differed according to the specific renal outcome examined: male sex and smoking were positively associated with Alb+ and negatively with eGFR+; age and anti-hypertensive therapies were more strongly associated with eGFR+, glucose control with Alb+, whereas BMI, and lipid-related variables with both abnormalities. All these associations were attenuated in the older (> 75 years) as compared to the younger groups (< 65 years; 65–75 years), and they were confirmed by multivariate analysis. Notably, Q-score values < 15, indicating a low quality of care, were strongly associated with Alb+ (OR 8.54; P < 0.001), but not with eGFR+.
Conclusions: In T2DM patients, the prevalence of both eGFR and Albuminuria increase with age. DKD is associated with poor cardiovascular risk profile and a lower quality of care, although these associations are influenced by the type of renal abnormality and by ageing. These data indicate that clinical surveillance of DKD should not be unerestimated in old T2DM patients.
Keywords: Diabetic kidney disease, Elderly, Type 2 diabetes, Cardiovascular disease
Background
Kidney dysfunction is rising worldwide in parallel with population ageing [1], being diagnosed in about 25% of people aged 65–74 years, and in > 50% of those aged > 75 years [2]. Senescence is associated with a progressive decline of estimated glomerular filtration rate (eGFR) of about 1–2 ml/min per year,
depending on ethnic, genetic and environmental fac-tors, which may limit renal reserve and make this organ more susceptible to damage by several factors, including type 2 diabetes mellitus (T2DM) [3–6].
T2DM is a progressive disease [7] whose prevalence also increases with age [8], thus exposing elderly patients to an increased risk of long-term diabetic complications, including diabetic kidney disease (DKD).
Low eGFR and albuminuria are the central features for the diagnosis of DKD, and they may be present together in 12% of T2DM subjects or as isolated forms in 35% of * Correspondence:[email protected]
1
Department of Clinical and Experimental Medicine, University of Messina, Messina, Italy
9Department of Clinical and experimental Medicine, Policlinico Universitario
“G. Martino”, via C. Valeria, 98121 Messina, Italy
Full list of author information is available at the end of the article
© The Author(s). 2018 Open Access This article is distributed under the terms of the Creative Commons Attribution 4.0 International License (http://creativecommons.org/licenses/by/4.0/), which permits unrestricted use, distribution, and reproduction in any medium, provided you give appropriate credit to the original author(s) and the source, provide a link to the Creative Commons license, and indicate if changes were made. The Creative Commons Public Domain Dedication waiver (http://creativecommons.org/publicdomain/zero/1.0/) applies to the data made available in this article, unless otherwise stated.
them: 24% as albuminuria with preserved eGFR values, and 11% as isolated low eGFR values (< 60 ml/min) [9].
In the large cohort of the Italian Association of Clinical Diabetologists (AMD) Annals Initiative, we have recently demonstrated that low eGFR and albuminuria may have different associations with clinical variables and risk factors for cardiovascular disease (CVD) [9].
However, in spite of the large prevalence of DKD among elderly T2DM patients, it is still unclear whether ageing modifies the associations of low eGFR and albuminuria with CVD risk factors, a particularly rele-vant issue when considering that DKD is associated with an enormous CVD burden, even at older ages [10,11].
Furthermore, quality of diabetes care should be carefully considered in elderly patients with DKD, since management of diabetes and its associated CVD risk factors may be different at different ages.
Therefore, here we explored the prevalence of low eGFR and albuminuria and their associations with CVD risk factors and quality of care indicators in a large cohort of T2DM patients participating to the AMD Annals Initiative, stratified according to a wide age-range.
Methods
In the present report, we analyzed the data set of electronic medical records, collected between 1 January and 31 December 2011, from 157,595 patients with T2DM followed-up at 207 diabetes centers included in the Italian Association of Clinical Diabetologists (AMD) Annals Initiative. Details on database and data collection have been reported elsewhere [12–14]. Data were collected and centrally analyzed anonymously, and the results were internally approved by the AMD Annals scientific committee. This initiative includes measuring and monitoring of major metabolic labora-tory parameters, anthropometric measures, systolic and diastolic blood pressure (BP), as well as the use of specific classes of cardiovascular drugs. In particular, kidney function was assessed by serum creatinine and urinary albumin excretion measure-ments. eGFR was estimated for each patient using a standardized serum creatinine assay and the CKD-EPI formula. Increased urinary albumin excretion was diagnosed as: i) microalbuminuria if UAE rate was > 20 and ≤ 200 μg/min, or if urinary albumin-to-creatinine ratio (ACR) was > 2.5 mg/mmol in men and > 3.5 mg/mmol in women and ≤30 mg/mmol in both genders, or if urinary albumin concentration was > 30 and ≤300 mg/l; ii) macroalbuminuria if UAE rate was > 200 μg/min, or if ACR was > 30 mg/mmol in both genders, or if urinary albumin concentration was > 300 mg/l. Albuminuria indicated patients with either micro- or macroalbuminuria.
Quality of care assessment
Quality of care was assessed through a validate score, the Q score [15, 16], which is calculated on a combin-ation of process and outcome indicators, based on levels and treatment of major CVD risk factors (HbA1c, blood pressure, LDL-cholesterol and albuminuria), assigning the highest score when the desired goals were attained, whereas the lowest score was assigned when the patient was not treated for the specific condition despite elevated values or when the patient showed unsatisfac-tory values despite the treatment. Overall, Q score ranges between 0 and 40, with a higher score reflecting better quality of care.
Statistical analysis
Data are given as mean values ± standard deviation (SD); and categorical variables as frequencies and percentages. Logistic mixed regression models were used to analyze predictors of eGFR < 60 mL/min/1.73 m2 or albuminuria. Due to the large sample size, odds ratios (ORs) were displayed with 99.9% confidence interval (CI). Diabetes clinics were fitted as random effect to consider possible differences in data across centers. Multivariate models were fitted with a complete-case analysis by including patients for which all data were observed. No missing data replacement was used. For the high number of missing values, a separate multivari-ate OR was computed for smoking status. The analyses were made using STATA software, Version 14 (Stata-Corp, College Station, Texas).
Results
Clinical characteristics of T2DM participants according to age
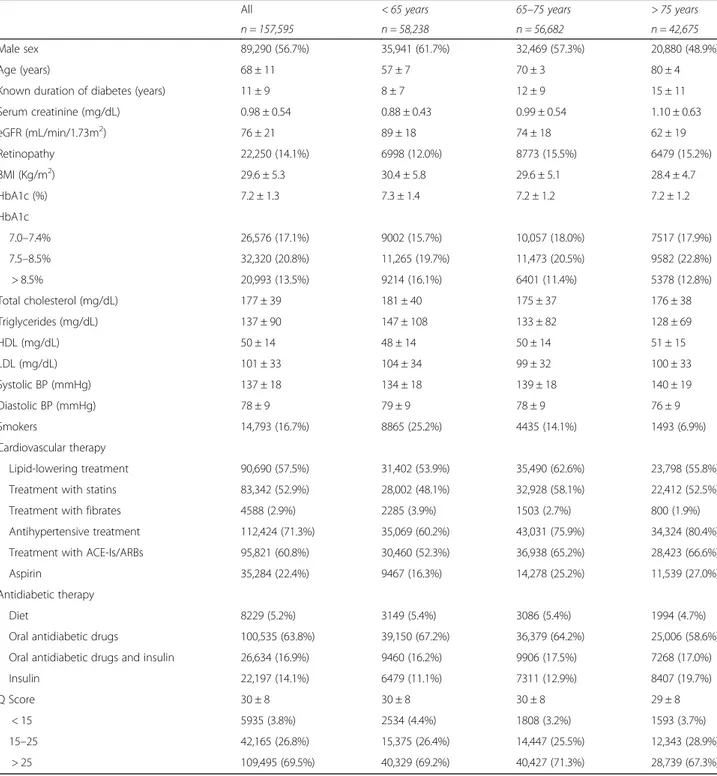
Clinical characteristics of the 157,595 T2DM subjects according to age (< 65 yrs., 65–75 yrs., > 75 yrs) are shown in Table 1. Male gender and smokers, as well as BMI values decreased with age, whereas glucose control was comparable (mean HbA1c 7.2–7.3%) in all age-groups, in spite of the increasing diabetes duration.
eGFR values decreased, whereas serum creatinine levels and the frequency of subjects with diabetic retin-opathy increased with age. The oldest groups showed a more favorable lipid profile, higher systolic and lower diastolic BP values and lower proportion of smokers.
Age-differences were also noted in hypoglycaemic therapies: diet therapy only and oral hypoglycaemic drugs use progressively decreased with age, while insulin treatment increased. In particular, in the > 75 years old group, 59% of study subjects were treated with oral drugs, 20% with insulin, 17% with a combination therapy and 5% with diet alone.
As for cardiovascular medications, lipid-lowering treat-ments were more frequently used in the intermediate age-group, fibrates in the youngest subjects, although in a
small absolute number, whereas anti-hypertensive and aspirin treatments progressively increased across age-strata.
Quality of care, assessed through the Q-score, showed high values (mean score 30), indicative of an overall good quality of care, with slightly lower scores in the oldest group.
Clinical characteristics of T2DM participants according to age and the presence of low eGFR and albuminuria
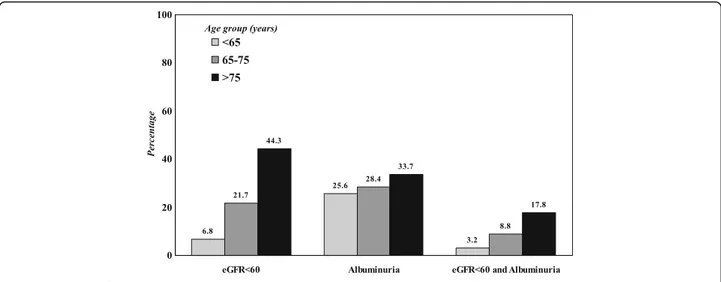
As shown in Fig.1, the prevalence of DKD progressively increased with age, and this increment was more evident for low eGFR than for albuminuria (P < 0.001 for all comparisons).
Table 1 Baseline clinical characteristics by age groups
All < 65 years 65–75 years > 75 years
n = 157,595 n = 58,238 n = 56,682 n = 42,675
Male sex 89,290 (56.7%) 35,941 (61.7%) 32,469 (57.3%) 20,880 (48.9%)
Age (years) 68 ± 11 57 ± 7 70 ± 3 80 ± 4
Known duration of diabetes (years) 11 ± 9 8 ± 7 12 ± 9 15 ± 11
Serum creatinine (mg/dL) 0.98 ± 0.54 0.88 ± 0.43 0.99 ± 0.54 1.10 ± 0.63 eGFR (mL/min/1.73m2) 76 ± 21 89 ± 18 74 ± 18 62 ± 19 Retinopathy 22,250 (14.1%) 6998 (12.0%) 8773 (15.5%) 6479 (15.2%) BMI (Kg/m2) 29.6 ± 5.3 30.4 ± 5.8 29.6 ± 5.1 28.4 ± 4.7 HbA1c (%) 7.2 ± 1.3 7.3 ± 1.4 7.2 ± 1.2 7.2 ± 1.2 HbA1c 7.0–7.4% 26,576 (17.1%) 9002 (15.7%) 10,057 (18.0%) 7517 (17.9%) 7.5–8.5% 32,320 (20.8%) 11,265 (19.7%) 11,473 (20.5%) 9582 (22.8%) > 8.5% 20,993 (13.5%) 9214 (16.1%) 6401 (11.4%) 5378 (12.8%) Total cholesterol (mg/dL) 177 ± 39 181 ± 40 175 ± 37 176 ± 38 Triglycerides (mg/dL) 137 ± 90 147 ± 108 133 ± 82 128 ± 69 HDL (mg/dL) 50 ± 14 48 ± 14 50 ± 14 51 ± 15 LDL (mg/dL) 101 ± 33 104 ± 34 99 ± 32 100 ± 33 Systolic BP (mmHg) 137 ± 18 134 ± 18 139 ± 18 140 ± 19 Diastolic BP (mmHg) 78 ± 9 79 ± 9 78 ± 9 76 ± 9 Smokers 14,793 (16.7%) 8865 (25.2%) 4435 (14.1%) 1493 (6.9%) Cardiovascular therapy Lipid-lowering treatment 90,690 (57.5%) 31,402 (53.9%) 35,490 (62.6%) 23,798 (55.8%)
Treatment with statins 83,342 (52.9%) 28,002 (48.1%) 32,928 (58.1%) 22,412 (52.5%)
Treatment with fibrates 4588 (2.9%) 2285 (3.9%) 1503 (2.7%) 800 (1.9%)
Antihypertensive treatment 112,424 (71.3%) 35,069 (60.2%) 43,031 (75.9%) 34,324 (80.4%)
Treatment with ACE-Is/ARBs 95,821 (60.8%) 30,460 (52.3%) 36,938 (65.2%) 28,423 (66.6%)
Aspirin 35,284 (22.4%) 9467 (16.3%) 14,278 (25.2%) 11,539 (27.0%)
Antidiabetic therapy
Diet 8229 (5.2%) 3149 (5.4%) 3086 (5.4%) 1994 (4.7%)
Oral antidiabetic drugs 100,535 (63.8%) 39,150 (67.2%) 36,379 (64.2%) 25,006 (58.6%)
Oral antidiabetic drugs and insulin 26,634 (16.9%) 9460 (16.2%) 9906 (17.5%) 7268 (17.0%)
Insulin 22,197 (14.1%) 6479 (11.1%) 7311 (12.9%) 8407 (19.7%)
Q Score 30 ± 8 30 ± 8 30 ± 8 29 ± 8
< 15 5935 (3.8%) 2534 (4.4%) 1808 (3.2%) 1593 (3.7%)
15–25 42,165 (26.8%) 15,375 (26.4%) 14,447 (25.5%) 12,343 (28.9%)
> 25 109,495 (69.5%) 40,329 (69.2%) 40,427 (71.3%) 28,739 (67.3%)
Mean ± SD or absolute frequency (percentage).ACE-Is = angiotensin converting enzyme-inhibitors, ARBs = angiotensin II receptor antagonists, BMI = body mass index,BP = blood pressure, eGFR = estimated glomerular filtration rate, HbA1c = glycated hemoglobin, HDL = high-density lipoprotein cholesterol, LDL = low-density lipoprotein cholesterol. Patients’ missing data: known duration of diabetes in 8435 (5.4%), BMI in 14,918 (9.5%), HbA1c in 2291 (1.5%), total cholesterol in 8127 (5.2%), triglycerides in 10,293 (6.5%), HDL-c in 12,812 (8.1%), LDL-c in 13,495 (8.6%), blood pressure in 16,009 24,106 (15.3%), and smoking status in 69,213 (43.9%)
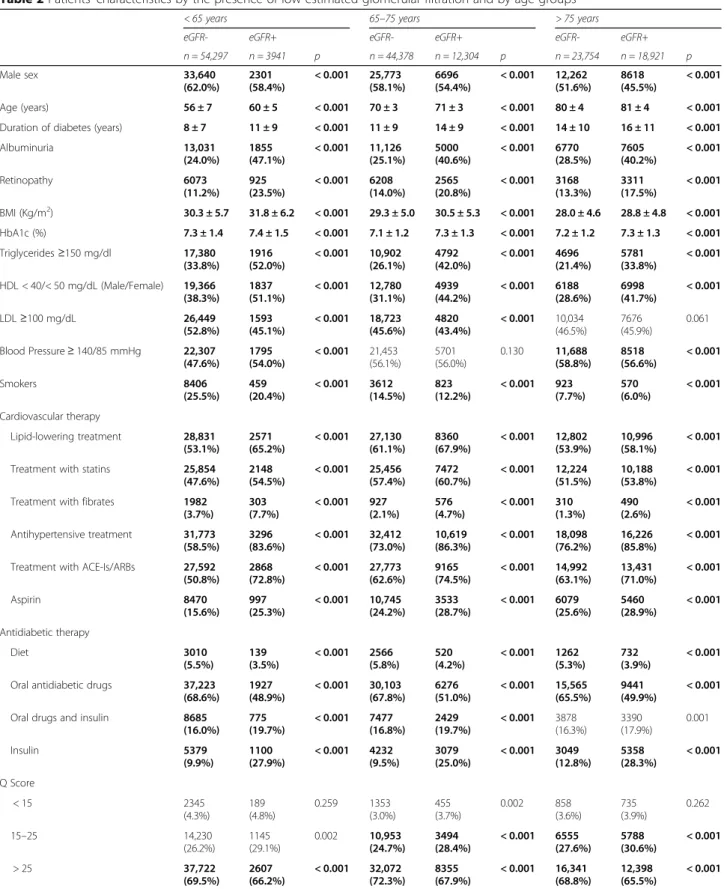
Clinical parameters according to age and the presence of low eGFR (Table 2) or albuminuria (Table 3) were also investigated.
As shown in Table 2, subjects in the eGFR+ (eGFR< 60 ml/min) groups showed a lower prevalence of men, an older age and a longer diabetes duration. Albumin-uria and retinopathy were also more prevalent in the eGFR + groups, without differences across age-strata. Similarly, irrespective of age, the percentage of out-of target CVD risk factors were significantly higher in the eGFR+ than in the eGFR- groups, with the exceptions of BMI which did not show any difference according to eGFR status in the oldest group, of BP control which was comparable in the 65–75 group, of the percentage of smokers, which was lower in the eGFR+ groups in all age-strata, and LDL-C which was more at target in the eGFR- group. Also, glucose control was worst in the eGFR+ groups in all age strata and, overall, poorest in the < 65 years group.
As for concomitant treatments, diet and oral medica-tions decreased whereas insulin use alone or in combin-ation with oral agents was higher in the eGFR+ groups; also the percentage of subjects treated with lipid lower-ing, anti-hypertensive drugs and aspirin was higher in the eGFR+ groups, irrespectively of age.
The number of subjects with low Q-score (< 15, bad quality of care), was higher in the eGFR+ groups at all ages, whereas Q-score values > 25, indicating a good quality of care, had the opposite trend.
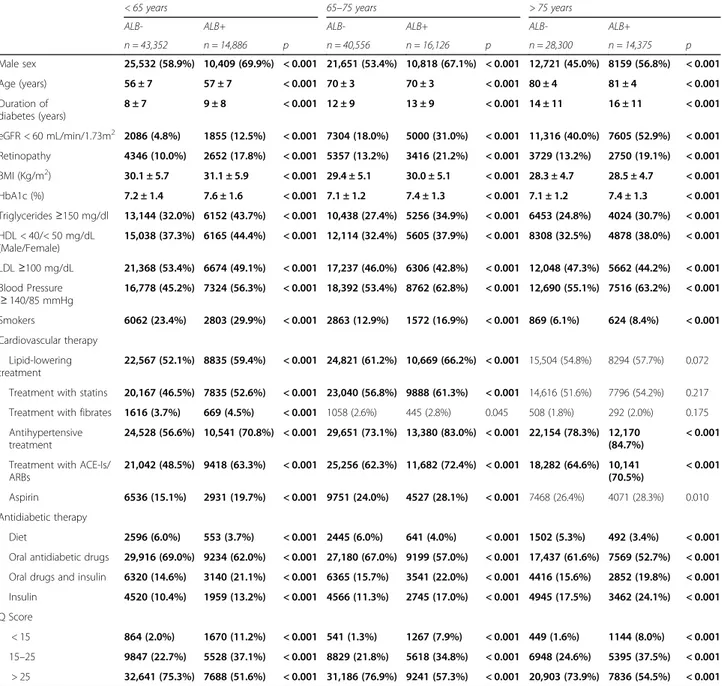
Table 3 shows study parameters according to age and the presence of albuminuria (Alb+). Prevalence of male sex, age and diabetes duration were higher in the Alb+ group, irrespective of the age-categories. Also risk fac-tors profile was worst in the Alb+ groups, which showed higher BMI values, poorer glucose, TGs, HDL-C, BP control and smoking habit; conversely, the Alb+ group
had a higher percentage of subjects with at-target LDL-C values.
Lipid lowering and anti-hypertensive treatments were more frequent in the Alb+ groups, although the differences were not statistically significant at older ages (> 75 years group). Similarly to the eGFR+ groups, more complex hypoglycemic therapies (insulin alone or in combination) were more frequent in the Alb+ groups at all ages.
The Q score showed consistently worst values in the Alb+ groups at all ages; low Q-score values (< 15) were particularly frequent in younger subjects with than with-out albuminuria (11.2% vs 2%, respectively).
Factors associated with low eGFR and albuminuria according to age
Univariate associations of low eGFR and albuminuria with study variables according to age strata are illustrated in Additional file1: Figure S1.
Both eGFR and albuminuria showed significant associa-tions with study variables, although with a different strength and direction, depending on the examined outcome.
Impaired renal function (eGFR< 60 ml/min) was significantly associated with age, diabetes duration, BMI, TG/HDL-C, BP, anti-hypertensive and lipid-lowering treatments, and the strength of these associations was attenuated by ageing. Male sex and smoking habit were negatively associated with low eGFR values. Also, higher BP values (≥ 140/85 mmHg) were positively associated with low eGFR in the < 65 years group and negatively in the older ones.
Albuminuria was positively and strongly associated with male sex, glucose control, TG/HDL-C, BP and medica-tions, and smoking. BP control was positively associated with albuminuria at every age-range. LDL-C was nega-tively associated with the presence of albuminuria. Also in
Table 2 Patients’ characteristics by the presence of low estimated glomerular filtration and by age groups
< 65 years 65–75 years > 75 years
eGFR- eGFR+ eGFR- eGFR+ eGFR- eGFR+
n = 54,297 n = 3941 p n = 44,378 n = 12,304 p n = 23,754 n = 18,921 p Male sex 33,640 (62.0%) 2301 (58.4%) < 0.001 25,773 (58.1%) 6696 (54.4%) < 0.001 12,262 (51.6%) 8618 (45.5%) < 0.001 Age (years) 56 ± 7 60 ± 5 < 0.001 70 ± 3 71 ± 3 < 0.001 80 ± 4 81 ± 4 < 0.001
Duration of diabetes (years) 8 ± 7 11 ± 9 < 0.001 11 ± 9 14 ± 9 < 0.001 14 ± 10 16 ± 11 < 0.001
Albuminuria 13,031 (24.0%) 1855 (47.1%) < 0.001 11,126 (25.1%) 5000 (40.6%) < 0.001 6770 (28.5%) 7605 (40.2%) < 0.001 Retinopathy 6073 (11.2%) 925 (23.5%) < 0.001 6208 (14.0%) 2565 (20.8%) < 0.001 3168 (13.3%) 3311 (17.5%) < 0.001 BMI (Kg/m2) 30.3 ± 5.7 31.8 ± 6.2 < 0.001 29.3 ± 5.0 30.5 ± 5.3 < 0.001 28.0 ± 4.6 28.8 ± 4.8 < 0.001 HbA1c (%) 7.3 ± 1.4 7.4 ± 1.5 < 0.001 7.1 ± 1.2 7.3 ± 1.3 < 0.001 7.2 ± 1.2 7.3 ± 1.3 < 0.001 Triglycerides≥150 mg/dl 17,380 (33.8%) 1916 (52.0%) < 0.001 10,902 (26.1%) 4792 (42.0%) < 0.001 4696 (21.4%) 5781 (33.8%) < 0.001 HDL < 40/< 50 mg/dL (Male/Female) 19,366 (38.3%) 1837 (51.1%) < 0.001 12,780 (31.1%) 4939 (44.2%) < 0.001 6188 (28.6%) 6998 (41.7%) < 0.001 LDL≥100 mg/dL 26,449 (52.8%) 1593 (45.1%) < 0.001 18,723 (45.6%) 4820 (43.4%) < 0.001 10,034 (46.5%) 7676 (45.9%) 0.061 Blood Pressure≥ 140/85 mmHg 22,307 (47.6%) 1795 (54.0%) < 0.001 21,453 (56.1%) 5701 (56.0%) 0.130 11,688 (58.8%) 8518 (56.6%) < 0.001 Smokers 8406 (25.5%) 459 (20.4%) < 0.001 3612 (14.5%) 823 (12.2%) < 0.001 923 (7.7%) 570 (6.0%) < 0.001 Cardiovascular therapy Lipid-lowering treatment 28,831 (53.1%) 2571 (65.2%) < 0.001 27,130 (61.1%) 8360 (67.9%) < 0.001 12,802 (53.9%) 10,996 (58.1%) < 0.001
Treatment with statins 25,854
(47.6%) 2148 (54.5%) < 0.001 25,456 (57.4%) 7472 (60.7%) < 0.001 12,224 (51.5%) 10,188 (53.8%) < 0.001
Treatment with fibrates 1982
(3.7%) 303 (7.7%) < 0.001 927 (2.1%) 576 (4.7%) < 0.001 310 (1.3%) 490 (2.6%) < 0.001 Antihypertensive treatment 31,773 (58.5%) 3296 (83.6%) < 0.001 32,412 (73.0%) 10,619 (86.3%) < 0.001 18,098 (76.2%) 16,226 (85.8%) < 0.001
Treatment with ACE-Is/ARBs 27,592 (50.8%) 2868 (72.8%) < 0.001 27,773 (62.6%) 9165 (74.5%) < 0.001 14,992 (63.1%) 13,431 (71.0%) < 0.001 Aspirin 8470 (15.6%) 997 (25.3%) < 0.001 10,745 (24.2%) 3533 (28.7%) < 0.001 6079 (25.6%) 5460 (28.9%) < 0.001 Antidiabetic therapy Diet 3010 (5.5%) 139 (3.5%) < 0.001 2566 (5.8%) 520 (4.2%) < 0.001 1262 (5.3%) 732 (3.9%) < 0.001
Oral antidiabetic drugs 37,223 (68.6%) 1927 (48.9%) < 0.001 30,103 (67.8%) 6276 (51.0%) < 0.001 15,565 (65.5%) 9441 (49.9%) < 0.001
Oral drugs and insulin 8685
(16.0%) 775 (19.7%) < 0.001 7477 (16.8%) 2429 (19.7%) < 0.001 3878 (16.3%) 3390 (17.9%) 0.001 Insulin 5379 (9.9%) 1100 (27.9%) < 0.001 4232 (9.5%) 3079 (25.0%) < 0.001 3049 (12.8%) 5358 (28.3%) < 0.001 Q Score < 15 2345 (4.3%) 189 (4.8%) 0.259 1353 (3.0%) 455 (3.7%) 0.002 858 (3.6%) 735 (3.9%) 0.262 15–25 14,230 (26.2%) 1145 (29.1%) 0.002 10,953 (24.7%) 3494 (28.4%) < 0.001 6555 (27.6%) 5788 (30.6%) < 0.001 > 25 37,722 (69.5%) 2607 (66.2%) < 0.001 32,072 (72.3%) 8355 (67.9%) < 0.001 16,341 (68.8%) 12,398 (65.5%) < 0.001 The bold values refers to significant (p < 0.001) comparisons between patients with eGFR< 60 mL/min/1.73m2(eGFR+) and those with values
the case of albuminuria the strength of these associations was generally attenuated in the oldest groups.
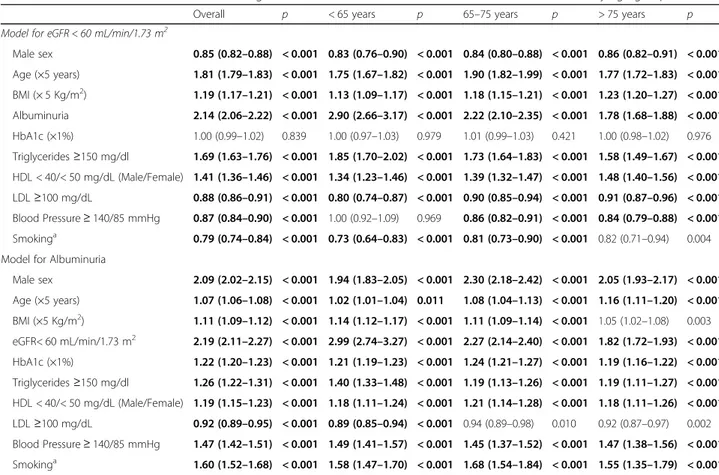
These relationships were confirmed at multivariate analysis (Table 4). The model for eGFR includes sex, age, BMI, glucose, lipid and BP control, and albuminuria. The model testing albuminuria as dependent variable also included eGFR. In particular, multivariate analysis confirmed that glucose control was not an independent predictor of low eGFR, and the association with BP con-trol was attenuated in the youngest group (< 65 years). As for smoking habit, it was independently and posi-tively associated with albuminuria (OR 1.60; 95%CI: 1.52–1.68), whereas the opposite was noted for low eGFR (OR 0.79; 95% CI 0.74–0.84).
Similarly, a low quality of diabetes care (Q score values < 15 vs > 25) was strongly associated with albuminuria (OR 8.54; P < 0.001), whereas this association was not noted for low eGFR values (OR 1.10; P = 0.004), irre-spective of age groups (Additional file2: Figure S2). Discussion
Diabetes care in elderly patients is challenging because of several epidemiological, clinical and economic issues, which are amplified in presence of chronic complications.
The prevalence of diabetes is high in older subjects, af-fecting more than 20% of subjects > 65 years [17]. Our data, on a large sample of outpatients with T2DM with a wide age-range, showed that renal complications affect 41.3% of this population, and more than 60% of those aged > 75 years.
These prevalence figures are comparable to those reported both in non-diabetic and diabetic cohorts, al-though with some disparities imputable to differences in study design, disease duration, and T2DM management.
In non-diabetic cohorts, the prevalence of renal disease parallels the ageing process, affecting up-to 56.1% of sub-jects aged > 75 years [18–21]. However, the NHANES study underlined how diabetes has a stronger impact on renal function than ageing itself, showing that the increas-ing prevalence of renal impairment in the US population in the period 2005–2008 was related to the increasing trends of diabetes, while the age distribution of that popu-lation did not change during the observation [10].
Available data on DKD prevalence among elderly T2DM cohorts are also varying, with a DKD prevalence of 15.1% reported in older adults in the Republic of Ireland [22], whereas, in theT2DM patients aged > 75 years in the ZODIAC-24 study [23], the prevalence of low eGFR was 42% and that of albuminuria 52%. These data are similar to our findings and those reported in the Renal Insuffi-ciency and Cardiovascular Events (RIACE) Italian Multi-center Study (RIACE) cohort [24].
The overall high prevalence of DKD in elderly T2DM patients is likely to be the result of two opposite
trajectories, i.e. the high frequency of T2DM in this age-group, and the decreased mortality rate due to a better control of the disease, which may have contributed to increase patients survival, allowing sufficient time to develop chronic diabetes complications [25–28].
The physiological decline of renal function with age may have also played a role, since senescence is associated with a gradual decline of eGFR [3,4], an observation that was confirmed by our study, wherein the impairment of eGFR across age-strata was much more pronounced than the occurrence of albuminuria (Fig.1) .
Similarly, in the UK Prospective Diabetes Study (UKPDS) study, older age was a significant predictor for the onset of low eGFR but not of albuminuria, whose prevalence was comparable to our findings: 24.9% in the UKPDS vs. 25.6% in our study subjects in the corre-sponding age-range (< 65 years old) [29,30].
Interestingly, our data also show that not all T2DM patients will eventually develop renal impairment even at very old age; indeed a large group of subjects aged > 75 years (n = 16.984, 48.5%) were still normo-albuminuric with preserved eGFR values, thus confirming that DKD in elderly patients is not only consequent to the loss of renal function of the ageing kidney. Furthermore, elderly sub-jects without DKD (mean age 80 years, diabetes duration 14 years) showed an optimal glucose control (mean HbA1c 7.1%), with lipid and BP values close to recom-mended targets and no weight loss, indicating the import-ance of controlling major risk factors in order to prevent renal complications even late in life.
CVD risk factors control is another important issue in elderly patients, especially in those with DKD. Thus, the health and economic burden associated with DKD is largely related to the high risk for CVD morbidity and mortality and its evolution to end stage renal disease [31–34], which does not spare the elderly population [10, 11]. In the Atherosclerosis Risk in Communities (ARIC) Study, both eGFR and albuminuria were associ-ated with CVD outcomes, although age and other demo-graphic variables had a modulating effect on these associations [10]. Furthermore, other studies and recent meta-analyses confirmed that the relationship between renal function and CVD mortality is largely consistent across age-categories [35–38].
Accordingly, our data show that both low eGFR and albuminuria are associated with a worst CVD risk factors profile in all the considered age-groups, and this was also evident for parameters such as BMI, triglycer-ides and smoking habit that progressively decrease at older age.
Our data also confirm that, independently of age, the strength of the associations of CVD risk factors is different when considering low eGFR and albumin-uria, as previously demonstrated in our and in other
cohorts [9, 24, 30]. These differences were particularly evident for gender, BP and glucose control.
Gender has been reported to have consistent and spe-cific associations with DKD features, with potential im-plications in terms of CVD risk [39–41]. As expected, in the overall population, female gender was more preva-lent at older ages, likely because of the female survival advantage. However, gender differences in DKD were maintained even at older age, with T2DM women being more prevalent in the low eGFR group, and men in the albuminuric group.
This finding is in line with several reports showing gender- differences in renal disease both in non-diabetic
[42,43] and diabetic cohorts [9,29,44]. Consistent with our findings of male gender being a risk factor for albumuminuria, in the UKPDS (The United Kingdom Prospective Diabetic Study) male gender was a predictor for the incidence of albuminuria, but not of low eGFR values [29]. Similarly, both in the RIACE study [44] and in previous reports from the AMD Annals Initiative [9], the albuminuric phenotype was more frequent in T2DM men, whereas the low eGFR phenotype was more preva-lent in women. Furthermore, male gender seems to be a risk factor for DKD progression towards ESRD [45–49], whereas once on dialysis treatment, mortality risk seems to be higher in the female T2DM population [50–53].
Table 3 Patients’ characteristics by the presence of albuminuria and by age groups
< 65 years 65–75 years > 75 years
ALB- ALB+ ALB- ALB+ ALB- ALB+
n = 43,352 n = 14,886 p n = 40,556 n = 16,126 p n = 28,300 n = 14,375 p Male sex 25,532 (58.9%) 10,409 (69.9%) < 0.001 21,651 (53.4%) 10,818 (67.1%) < 0.001 12,721 (45.0%) 8159 (56.8%) < 0.001 Age (years) 56 ± 7 57 ± 7 < 0.001 70 ± 3 70 ± 3 < 0.001 80 ± 4 81 ± 4 < 0.001 Duration of diabetes (years) 8 ± 7 9 ± 8 < 0.001 12 ± 9 13 ± 9 < 0.001 14 ± 11 16 ± 11 < 0.001 eGFR < 60 mL/min/1.73m2 2086 (4.8%) 1855 (12.5%) < 0.001 7304 (18.0%) 5000 (31.0%) < 0.001 11,316 (40.0%) 7605 (52.9%) < 0.001 Retinopathy 4346 (10.0%) 2652 (17.8%) < 0.001 5357 (13.2%) 3416 (21.2%) < 0.001 3729 (13.2%) 2750 (19.1%) < 0.001 BMI (Kg/m2) 30.1 ± 5.7 31.1 ± 5.9 < 0.001 29.4 ± 5.1 30.0 ± 5.1 < 0.001 28.3 ± 4.7 28.5 ± 4.7 < 0.001 HbA1c (%) 7.2 ± 1.4 7.6 ± 1.6 < 0.001 7.1 ± 1.2 7.4 ± 1.3 < 0.001 7.1 ± 1.2 7.4 ± 1.3 < 0.001 Triglycerides≥150 mg/dl 13,144 (32.0%) 6152 (43.7%) < 0.001 10,438 (27.4%) 5256 (34.9%) < 0.001 6453 (24.8%) 4024 (30.7%) < 0.001 HDL < 40/< 50 mg/dL (Male/Female) 15,038 (37.3%) 6165 (44.4%) < 0.001 12,114 (32.4%) 5605 (37.9%) < 0.001 8308 (32.5%) 4878 (38.0%) < 0.001 LDL≥100 mg/dL 21,368 (53.4%) 6674 (49.1%) < 0.001 17,237 (46.0%) 6306 (42.8%) < 0.001 12,048 (47.3%) 5662 (44.2%) < 0.001 Blood Pressure ≥ 140/85 mmHg 16,778 (45.2%) 7324 (56.3%) < 0.001 18,392 (53.4%) 8762 (62.8%) < 0.001 12,690 (55.1%) 7516 (63.2%) < 0.001 Smokers 6062 (23.4%) 2803 (29.9%) < 0.001 2863 (12.9%) 1572 (16.9%) < 0.001 869 (6.1%) 624 (8.4%) < 0.001 Cardiovascular therapy Lipid-lowering treatment 22,567 (52.1%) 8835 (59.4%) < 0.001 24,821 (61.2%) 10,669 (66.2%) < 0.001 15,504 (54.8%) 8294 (57.7%) 0.072
Treatment with statins 20,167 (46.5%) 7835 (52.6%) < 0.001 23,040 (56.8%) 9888 (61.3%) < 0.001 14,616 (51.6%) 7796 (54.2%) 0.217 Treatment with fibrates 1616 (3.7%) 669 (4.5%) < 0.001 1058 (2.6%) 445 (2.8%) 0.045 508 (1.8%) 292 (2.0%) 0.175 Antihypertensive
treatment
24,528 (56.6%) 10,541 (70.8%) < 0.001 29,651 (73.1%) 13,380 (83.0%) < 0.001 22,154 (78.3%) 12,170 (84.7%)
< 0.001
Treatment with ACE-Is/ ARBs 21,042 (48.5%) 9418 (63.3%) < 0.001 25,256 (62.3%) 11,682 (72.4%) < 0.001 18,282 (64.6%) 10,141 (70.5%) < 0.001 Aspirin 6536 (15.1%) 2931 (19.7%) < 0.001 9751 (24.0%) 4527 (28.1%) < 0.001 7468 (26.4%) 4071 (28.3%) 0.010 Antidiabetic therapy Diet 2596 (6.0%) 553 (3.7%) < 0.001 2445 (6.0%) 641 (4.0%) < 0.001 1502 (5.3%) 492 (3.4%) < 0.001 Oral antidiabetic drugs 29,916 (69.0%) 9234 (62.0%) < 0.001 27,180 (67.0%) 9199 (57.0%) < 0.001 17,437 (61.6%) 7569 (52.7%) < 0.001 Oral drugs and insulin 6320 (14.6%) 3140 (21.1%) < 0.001 6365 (15.7%) 3541 (22.0%) < 0.001 4416 (15.6%) 2852 (19.8%) < 0.001 Insulin 4520 (10.4%) 1959 (13.2%) < 0.001 4566 (11.3%) 2745 (17.0%) < 0.001 4945 (17.5%) 3462 (24.1%) < 0.001 Q Score
< 15 864 (2.0%) 1670 (11.2%) < 0.001 541 (1.3%) 1267 (7.9%) < 0.001 449 (1.6%) 1144 (8.0%) < 0.001 15–25 9847 (22.7%) 5528 (37.1%) < 0.001 8829 (21.8%) 5618 (34.8%) < 0.001 6948 (24.6%) 5395 (37.5%) < 0.001 > 25 32,641 (75.3%) 7688 (51.6%) < 0.001 31,186 (76.9%) 9241 (57.3%) < 0.001 20,903 (73.9%) 7836 (54.5%) < 0.001 The bold values refers to significant (p < 0.001) comparisons between patients with albuminuria (ALB+) and those with normoalbuminuria (ALB -)
In spite of these epidemiological findings, the patho-physiological bases of these gender differences remain still largely unknown, although it should be kept in mind that formulas commonly used for eGFR calculation are influenced by gender [54,55].
Worst glucose and BP control were also associated with both low eGFR and albuminuria, irrespective of age and in spite of the overall mean at- target values in all age-groups, confirming the undisputed role of intensive control of these risk factors in the prevention of micro-vascular disease. However, at multivariate analysis, the association with HbA1c values remained significant for albuminuria only; the impact of BP values on the risk of low eGFR was attenuated in the oldest group, suggesting that the network of factors related to eGFR decline in T2DM subjects is more complex.
Notably, although glucose control was overall good in all age-groups (mean HbA1c 7.2%), a larger percentage of subjects in the youngest group showed out-of-target HbA1c values (> 8.5%), compared to subjects > 65 years,
whereas the higher prevalence of HbA1c between 7.5– 8.5% at older age in our cohort could be interpreted in the light of current guidelines that suggest to mitigate glucose targets in the elderly [28,38].
Age had an influence on these associations, attenuat-ing the relationship between renal features and the ex-amined CVD risk factors. This was particularly evident for BP control and anti-hypertensive treatments, that were positively and strongly associated with low eGFR values in the < 65 years group and progressively less at older ages. Also smoking habit, that was positively asso-ciated with albuminuria and negatively with low eGFR was influenced by age.
When evaluating quality of diabetes care, through the Q score [15, 16], we found an overall good quality of care (mean values of 29–30) at different age- and DKD strata, and these data are in line with the findings of other diabetic cohorts in Italy [15, 16]. However, older subjects (> 75 years) and those with albuminuria (Alb+) showed lower Q score values compared to the
Table 4 Multivariate odds ratios for estimated glomerular filtration rate < 60 mL/min/1.73 m2or albuminuria by age groups
Overall p < 65 years p 65–75 years p > 75 years p
Model for eGFR < 60 mL/min/1.73 m2
Male sex 0.85 (0.82–0.88) < 0.001 0.83 (0.76–0.90) < 0.001 0.84 (0.80–0.88) < 0.001 0.86 (0.82–0.91) < 0.001 Age (×5 years) 1.81 (1.79–1.83) < 0.001 1.75 (1.67–1.82) < 0.001 1.90 (1.82–1.99) < 0.001 1.77 (1.72–1.83) < 0.001 BMI (× 5 Kg/m2) 1.19 (1.17–1.21) < 0.001 1.13 (1.09–1.17) < 0.001 1.18 (1.15–1.21) < 0.001 1.23 (1.20–1.27) < 0.001 Albuminuria 2.14 (2.06–2.22) < 0.001 2.90 (2.66–3.17) < 0.001 2.22 (2.10–2.35) < 0.001 1.78 (1.68–1.88) < 0.001 HbA1c (×1%) 1.00 (0.99–1.02) 0.839 1.00 (0.97–1.03) 0.979 1.01 (0.99–1.03) 0.421 1.00 (0.98–1.02) 0.976 Triglycerides≥150 mg/dl 1.69 (1.63–1.76) < 0.001 1.85 (1.70–2.02) < 0.001 1.73 (1.64–1.83) < 0.001 1.58 (1.49–1.67) < 0.001 HDL < 40/< 50 mg/dL (Male/Female) 1.41 (1.36–1.46) < 0.001 1.34 (1.23–1.46) < 0.001 1.39 (1.32–1.47) < 0.001 1.48 (1.40–1.56) < 0.001 LDL≥100 mg/dL 0.88 (0.86–0.91) < 0.001 0.80 (0.74–0.87) < 0.001 0.90 (0.85–0.94) < 0.001 0.91 (0.87–0.96) < 0.001 Blood Pressure≥ 140/85 mmHg 0.87 (0.84–0.90) < 0.001 1.00 (0.92–1.09) 0.969 0.86 (0.82–0.91) < 0.001 0.84 (0.79–0.88) < 0.001 Smokinga 0.79 (0.74–0.84) < 0.001 0.73 (0.64–0.83) < 0.001 0.81 (0.73–0.90) < 0.001 0.82 (0.71–0.94) 0.004
Model for Albuminuria
Male sex 2.09 (2.02–2.15) < 0.001 1.94 (1.83–2.05) < 0.001 2.30 (2.18–2.42) < 0.001 2.05 (1.93–2.17) < 0.001 Age (×5 years) 1.07 (1.06–1.08) < 0.001 1.02 (1.01–1.04) 0.011 1.08 (1.04–1.13) < 0.001 1.16 (1.11–1.20) < 0.001 BMI (×5 Kg/m2) 1.11 (1.09–1.12) < 0.001 1.14 (1.12–1.17) < 0.001 1.11 (1.09–1.14) < 0.001 1.05 (1.02–1.08) 0.003 eGFR< 60 mL/min/1.73 m2 2.19 (2.11–2.27) < 0.001 2.99 (2.74–3.27) < 0.001 2.27 (2.14–2.40) < 0.001 1.82 (1.72–1.93) < 0.001 HbA1c (×1%) 1.22 (1.20–1.23) < 0.001 1.21 (1.19–1.23) < 0.001 1.24 (1.21–1.27) < 0.001 1.19 (1.16–1.22) < 0.001 Triglycerides≥150 mg/dl 1.26 (1.22–1.31) < 0.001 1.40 (1.33–1.48) < 0.001 1.19 (1.13–1.26) < 0.001 1.19 (1.11–1.27) < 0.001 HDL < 40/< 50 mg/dL (Male/Female) 1.19 (1.15–1.23) < 0.001 1.18 (1.11–1.24) < 0.001 1.21 (1.14–1.28) < 0.001 1.18 (1.11–1.26) < 0.001 LDL≥100 mg/dL 0.92 (0.89–0.95) < 0.001 0.89 (0.85–0.94) < 0.001 0.94 (0.89–0.98) 0.010 0.92 (0.87–0.97) 0.002 Blood Pressure≥ 140/85 mmHg 1.47 (1.42–1.51) < 0.001 1.49 (1.41–1.57) < 0.001 1.45 (1.37–1.52) < 0.001 1.47 (1.38–1.56) < 0.001 Smokinga 1.60 (1.52–1.68) < 0.001 1.58 (1.47–1.70) < 0.001 1.68 (1.54–1.84) < 0.001 1.55 (1.35–1.79) < 0.001
The bold values refers to significant (p < 0.001) associations. Complete case analysis performed including patients for which all data were observed. Overall group included 115,493 patients: 23,973 (20.8%) with eGFR< 60 mL/min/1.73m2and 33,598 (29.1% with albuminuria). Group with < 65 years included 43,945 patients: 2844 (6.5%) with eGFR< 60 mL/min/1.73m2and 11,401 (25.9%) with albuminuria. Group with 65–75 years included 42,248 patients: 8746 (20.7%) with eGFR< 60 mL/min/1.73m2and 12,170 (28.8%) with albuminuria. Group with > 75 years included 29,300 patients: 12,383 (42.26%) with eGFR< 60 mL/min/1.73m2and 10,027 (34.2%) with albuminuria
other groups. Notably, the QUASAR study [15] showed that the risk of developing CVD events was 84% greater in patients with a score of < 15 (incidence rate ratio: 1.84; 95% CI 1.29–2.62) and 17% higher in those with a score between 15 and 25 (incidence rate ratio: 1.17; 95% CI 0.93–1.49), as compared with those with a score of > 25 [15]. Our data extended those observa-tions indicating that, irrespectively of age, low Q-score values are a risk factor also for albuminuria, a widely recognized risk factor for CVD.
Several limitations of the study should be acknowl-edged. Among these, the potential influence of geriatric conditions, which may affect quality of care and DKD outcomes, was not specifically considered; moreover, we did not take into account that the management of DKD in elderly patients is complicated by the higher exposure to drugs’ side effects, including hypoglycemia, and frequent co-morbidities [28, 34, 56]. Also, we did not explore the potential associations of the available classes of drugs with low eGFR and/or albuminuria phenotypes specifically in the elderly population, al-though a previous analysis of this cohort showed an high percentages of patients treated with those drugs that should be limited or contraindicated by impaired renal function [57,58].
Conclusions
In conclusion, in this representative sample of outpatients with T2DM, DKD prevalence, especially low eGFR, was very high in subjects > 65 years old. Both low eGFR and albuminuria were associated with a worst CVD risk factor profile, although these associations changed according to the specific outcome examined and were generally attenu-ated at older ages. Quality of diabetes care was overall good even at older age, however, when impaired (Q score < 15), it was associated with a higher risk of albuminuria. These data indicate that DKD in elderly patients is still a high-risk condition that deserves full clinical consider-ation, in order to implement a targeted treatment and im-prove its outcomes.
Additional files
Additional file 1: Figure S1.Odds Ratios with 99.9% confidence interval (CI) for eGFR< 60 mL/min/1.73 m2 (2A) or albuminuria (2B), by age groups. (TIFF 286 kb)
Additional file 2: Figure S2.Odds Ratios with 99.9% confidence interval (CI) of Q Score groups for eGFR< 60 mL/min/1.73 m2 or albuminuria, by age groups. (TIFF 134 kb)
Abbreviations
ACR:Urinary albumin-to-creatinine ratio; CVD: Cardiovascular disease.; DKD: Diabetic kidney disease; eGFR: Estimated glomerular filtration rate; T2DM: Type 2 diabetes; UAE: Urinary albumin excretion
Acknowledgements
Authors would like to thank all the centers participating to the AMD Annals Initiative.
Funding
The Associazione Medici Diabetologi (AMD) is the only funder of this research. Availability of data and materials
The datasets generated and/or analyzed during the current study derive from the AMD Data File, which is available at the Associazione Medici Diabetologi (AMD), Viale delle Milizie, 96, 00192 Roma (Italy), and they are available from the corresponding author on reasonable request. Authors’ contributions
G T R and P F designed the study, researched data and wrote the first draft of the manuscript and edited the manuscript; PG contributed to study design and made all statistical analysis, SDC, FV, RP, CG, DC were involved in the conception and design of the study and critically revised the intellectual content of the manuscript, AM and AC contributed to data interpretation and critically revised the manuscript. All the Authors gave their final approval of the version to be published and take public responsibility and agree to be accountable for all aspects of the work.
Ethics approval and consent to participate
As previously reported, the Italian Association of Clinical Diabetologists (Associazione Medici Diabetologi, AMD) initiative and its clinical database were established to identify a set of indicators to be used for continuous quality improvement. The software for medical management of outpatients is the same among all centers. Patients’ data are linked together by a unique anonymous identifier that is encrypted to protect patients’ privacy. Clinical information collected from all centers can be anonymously extracted and centrally analyzed (AMD Data File). The results were internally approved by the AMD Annals Scientific Committee, as previously reported [12–14]. The Associazione Medici Diabetologi (AMD) IRB approved the use of the dataset for this study. Competing interests
The authors declare that they have no competing interests.
Publisher’s Note
Springer Nature remains neutral with regard to jurisdictional claims in published maps and institutional affiliations.
Author details
1Department of Clinical and Experimental Medicine, University of Messina,
Messina, Italy.2Department of Medical Sciences, Scientific Institute“Casa
Sollievo della Sofferenza,”, San Giovanni Rotondo, (FG), Italy.3Department of
Internal Medicine, University of Genoa and Policlinico San Martino, Genoa, Italy.4Institut d’Investigacions Biomediques August Pii Sunyer (IDIBAPS) and
Centro de Investigacion Biomedicaen Red de Diabetes y Enfermedades Metabolicas Asociadas (CIBERDEM), Barcelona, Spain.5Department of
Cardiovascular and Metabolic Diseases, IRCCS Gruppo Multimedica, Sesto San Giovanni, Italy.6Associazione Medici Diabetologi, Rome, Italy.7Diabetes and
Metabolism Unit, ASL, Turin 5, Chieri (TO), Turin, Italy.8Department of
Medicine, University of Padua, Padua, Italy.9Department of Clinical and
experimental Medicine, Policlinico Universitario“G. Martino”, via C. Valeria, 98121 Messina, Italy.
Received: 19 September 2017 Accepted: 25 January 2018
References
1. de Boer IH, Rue TC, Hall YN, Heagerty PJ, Weiss NS, Himmelfarb J. Temporal trends in the prevalence of diabetic kidney disease in the United States. JAMA. 2011;305:2532–9.
2. Couser WG, Remuzzi G, Mendis S, Tonelli M. The contribution of chronic kidney disease to the global burden of major noncommunicable diseases. Kidney Int. 2011;80:1258–70.
3. Hemmelgarn BR, Zhang J, Manns BJ, Tonelli M, Larsen E, Ghali WA, Southern DA, McLaughlin K, Mortis G, Culleton BF. Progression of kidney dysfunction in the community dwelling elderly. Kidney Int. 2006;9:2155–61.
4. Lindeman RD, Tobin J, Shock NW. Longitudinal studies on the rate of decline in renal function with age. J Am Geriatr Soc. 1985;33:278–85. 5. Raymond NT, Zehnder D, Smith SC, Stinson JA, Lehnert H, Higgins RM.
Elevated relative mortality risk with mild-to-moderate chronic kidney disease decreases with age. Nephrol Dial Transplant. 2007;22:3214–20. 6. Grams ME, Chow EK, Segev DL, Coresh J. Lifetime incidence of CKD stages
3–5 in the United States. Am J Kidney Dis. 2013;62:245–52.
7. Russo GT, Giorda CB, Cercone S, Nicolucci A, Cucinotta D, BetaDecline Study Group. Factors associated with beta-cell dysfunction in type 2 diabetes: the BETADECLINE study. PLoS One. 2014;9(10):e109702.
https://doi.org/10.1371/journal.pone.0109702.
8. Ogurtsova K, da Rocha Fernandes JD, Huang Y, Linnenkamp U, Guariguata L, Cho NH, Cavan D, Shaw JE, Makaroff LE. IDF diabetes atlas: global estimates for the prevalence of diabetes for 2015 and 2040. Diabetes Res Clin Pract. 2017;128:40–50.
9. De Cosmo S, Rossi MC, Pellegrini F, Lucisano G, Bacci S, Gentile S, Ceriello A, Russo G, Nicolucci A, Giorda C, Viazzi F, Pontremoli R, AMD-Annals Study Group. Kidney dysfunction and related cardiovascular risk factors among patients with type 2 diabetes. Nephrol Dial Transplant. 2014;29:657–62. 10. Hui X, Matsushita K, Sang Y, Ballew SH, Fülöp T, Coresh J. CKD and
cardiovascular disease in the atherosclerosis risk in communities (ARIC) study: interactions with age, sex, and race. Am J Kidney Dis. 2013;62:691–702. 11. Bacchetti P, Garg AX, Kaufman JS, Walter LC, Mehta KM, Steinman MA, et al.
Age affects outcomes in chronic kidney disease. JASN. 2007;18:2758–65. 12. De Cosmo S, Viazzi F, Pacilli A, Giorda C, Ceriello A, Gentile S, Russo G, Rossi
MC, Nicolucci A, Guida P, Feig D, Johnson RJ, Pontremoli R, AMD-Annals Study Group. Serum uric acid and risk of CKD in type 2 diabetes. Clin J Am Soc Nephrol. 2015;10:1921–9.
13. Russo GT, De Cosmo S, Viazzi F, Pacilli A, Ceriello A, Genovese S, Guida P, Giorda C, Cucinotta D, Pontremoli R, Fioretto P, AMD-Annals Study Group. Plasma triglycerides and HDL-C levels predict the development of diabetic kidney disease in subjects with type 2 diabetes: the AMD annals initiative. Diabetes Care. 2016;39:2278–87.
14. De Cosmo S, Viazzi F, Pacilli A, Giorda C, Ceriello A, Gentile S, Russo G, Rossi MC, Nicolucci A, Guida P, Di Bartolo P, Pontremoli R, AMD-Annals Study Group. Achievement of therapeutic targets in patients with diabetes and chronic kidney disease: insights from the Associazione Medici Diabetologi annals initiative. Nephrol Dial Transplant. 2015;30:1526–33.
15. Rossi MC, Lucisano G, Comaschi M, et al. Quality of diabetes care predicts the development of cardiovascular events: results of the AMD-QUASAR. Diabetes Care. 2011;34:347–52.
16. Manicardi V, Russo G, Napoli A, Torlone E, Li Volsi P, Giorda CB, Musacchio N, Nicolucci A, Suraci C, Lucisano G, Rossi MC, AMD Annals Study Group. Gender-disparities in adults with type 1 diabetes: more than a quality of care issue. A cross-sectional observational study from the AMD annals initiative. PLoS One. 2016;11(10):e0162960.https://doi.org/10.1371/journal.pone.0162960. 17. Centers for Disease Control and Prevention. Rate per 100 of civilian, not
institutionalized population with diagnosed diabetes, by age, United States, 2015; 1980–2014.http://www.cdc.gov/diabetes/statistics/prev/national/figbyage.htm. 18. Chadban SJ, Briganti EM, Kerr PG, Dunstan DW, Welborn TA, Zimmet PZ,
Atkins RC. Prevalence of kidney damage in Australian adults: the AusDiab kidney study. J Am Soc Nephrol. 2003;14:S131–8.
19. Hallan SI, Dahl K, Oien CM, Grootendorst DC, Aasberg A, Holmen J, Dekker FW. Screening strategies for chronic kidney disease in the general population: follow-up of cross sectional health survey. BMJ. 2006;333:1047. 20. Clase CM, Garg AX, Kiberd BA. Prevalence of low glomerular filtration rate in
nondiabetic Americans: third National Health and nutrition examination survey (NHANES III). J Am Soc Nephrol. 2002;13:1338–49.
21. Roderick PJ, Atkins RJ, Smeeth L, Mylne A, Nitsch DD, Hubbard RB, Bulpitt CJ, Fletcher AE. CKD and mortality risk in older people: a community-based population study in the United Kingdom. Am J Kidney Dis. 2009;53:950–60. 22. Tracey ML, McHugh SM, Buckley CM, Canavan RJ, Fitzgerald AP, Kearney PM.
The prevalence of type 2 diabetes and related complications in a nationally representative sample of adults aged 50 and over in the Republic of Ireland. Diabet Med. 2015;33:441–5.
23. Drion I, van Hateren KJ, Joosten H, Alkhalaf A, Groenier KH, Kleefstra N, Wetzels JF, Bilo HJ. Chronic kidney disease and mortality risk among older patients with type 2 diabetes mellitus (ZODIAC-24). Age Ageing. 2012;41:345–50. 24. Solini A, Penno G, Bonora E, Fondelli C, Orsi E, Trevisan R, et al. Age,
renal dysfunction, cardiovascular disease, and antihyperglycemic treatment in type 2 diabetes mellitus: findings from the renal
insufficiency and cardiovascular events Italian multicenter study. J Am Geriatr Soc. 2013;61:1253–61.
25. Thomas MC, Cooper ME, Zimmet P. Changing epidemiology of type 2 diabetes mellitus and associated chronic kidney disease. Nat Rev Nephrol. 2016;12:73–81.
26. Gregg EW, Sattar N, Ali MK. The changing face of diabetes complications. Lancet Diabetes Endocrinol. 2016;4:537–47.
27. Assogba FG, Couchoud C, Hannedouche T, Villar E, Frimat L, Fagot-Campagna A, et al. Trends in the epidemiology and care of diabetes mellitus-related end-stage renal disease in France, 2007-2011. Diabetologia. 2014;57:718–28. 28. Huang ES. Management of diabetes mellitus in older people with
comorbidities. BMJ. 2016;353:i2200.https://doi.org/10.1136/bmj.i2200. 29. Retnakaran R, Cull CA, Thorne KI, Adler AI, Holman RR, UKPDS Study Group.
Risk factors for renal dysfunction in type 2 diabetes: U.K. prospective diabetes study 74. Diabetes. 2006;55:1832–9.
30. Adler AI, Stevens RJ, Manley SE, Bilous RW, Cull CA, Holman RR, UKPDS GROUP. Development and progression of nephropathy in type 2 diabetes: the United Kingdom prospective diabetes study (UKPDS 64). Kidney Int. 2003;63:225–32.
31. Van der Velde M, Matsushita K, Coresh J, Astor BC, Woodward M, Levey A, et al. Lower estimated glomerular filtration rate and higher albuminuria are associated with all-cause and cardiovascular mortality, a collaborative meta-analysis of high-risk population cohorts. Kidney Int. 2011;79:1341–52. 32. Gansevoort RT, Correa-Rotter R, Hemmelgarn BR, Jafar TH, Heerspink HJ,
Mann JF, et al. Chronic kidney disease and cardiovascular risk: epidemiology mechanisms, and prevention. Lancet. 2013;382:339–52.
33. Tuttle KR, Bakris GL, Bilous RW, Chiang JL, de Boer IH, Goldstein-Fuchs J, et al. Diabetic kidney disease: a report from an ADA consensus conference. Diabetes Care. 2014;37:2864–83.
34. Lipska KJ, Krumholz H, Soones T, Lee SJ. Polypharmacy in the aging patient: a review of Glycemic control in older adults with type 2 diabetes. JAMA. 2016;315:1034–45.
35. Matsushita K, van der Velde M, Astor BC, Woodward M, Levey AS, de Jong PE, et al. Association of estimated glomerular filtration rate and albuminuria with all-cause and cardiovascular mortality in general population cohorts: a collaborative meta-analysis. Lancet. 2010;375:2073–81.
36. Levey AS, de Jong PE, Coresh J, El Nahas M, Astor BC, Matsushita K, et al. The definition, classification, and prognosis of chronic kidney disease: a KDIGO controversies conference report. Kidney Int. 2011;80:17–28. 37. Hallan SI, Matsushita K, Sang Y, Mahmoodi BK, Black C, Ishani A, et al. Chronic
kidney disease prognosis consortium. Age and Association of Kidney Measures with Mortality and end-Stage Renal Disease. JAMA. 2012;308:2349–60. 38. Kirkman MS, Briscoe VJ, Clark N, Florez H, Haas LB, Halter JB, et al. Diabetes
in older adults. Diabetes Care. 2012;35:2650–64.
39. Yu MK, Lyles CR, Bent-Shaw LA, Young BA, Authors P. Risk factor, age and sex differences in chronic kidney disease prevalence in a diabetic cohort: the pathways study. Am J Nephrol. 2012;36:245–51.
40. Russo GT, Giandalia A, Romeo EL, Marotta M, Alibrandi A, De Francesco C, et al. Lipid and non-lipid cardiovascular risk factors in postmenopausal type 2 diabetic women with and without coronary heart disease. J Endocrinol Investig. 2014;37:261–8.
41. Hateren KJ, Landman GW, Kleefstra N, Groenier KH, Kamper AM, Houweling ST, Bilo HJ. Lower blood pressure associated with higher mortality in elderly diabetic patients (ZODIAC-12). Age Ageing. 2010;39:603–9.
42. Sullivan JC, Gillis EE. Sex and gender differences in hypertensive kidney injury. Am J Physiol Renal Physiol. 2017;https://doi.org/10.1152/ajprenal.00206.2017. 43. Cobo G, Hecking M, Port FK, Exner I, Lindholm B, Stenvinkel P, Carrero JJ.
Sex and gender differences in chronic kidney disease: progression to end-stage renal disease and haemodialysis. Clin Sci (Lond). 2016;130:1147–63. 44. Penno G, Solini A, Bonora E, Fondelli C, Orsi E, Zerbini G, et al. Clinical
significance of nonalbuminuric renal impairment in type 2 diabetes. J Hypertens. 2011;29:1802–9.
45. Yu MK, Katon W, Young BA. Associations between sex and incident chronic kidney disease in a prospective diabetic cohort. Nephrology (Carlton). 2015;20:451–8.
46. Diamond-Stanic MK, You YH, Sharma K. Sugar, sex, and TGF-beta in diabetic nephropathy. Semin Nephrol. 2012;32:261–8.
47. Zitt E, Pscheidt C, Concin H, Kramar R, Lhotta K, Nagel G. Anthropometric and metabolic risk factors for ESRD are disease-specific: results from a large population-based cohort study in Austria. PLoS One. 2016;
48. Jardine MJ, Hata J, Woodward M, et al. Prediction of kidney-related outcomes in patients with type 2 diabetes. Am J Kidney Dis. 2012;60:770–8. 49. de Hauteclocque A, Ragot S, Slaoui Y, Gand E, Miot A, Sosner P, et al. The
influence of sex on renal function decline in people with type 2 diabetes. Diabet Med. 2014;31:1121–8.
50. Hecking M, Bieber BA, Ethier J, Kautzky-Willer A, Sunder-Plassmann G, Säemann MD, et al. Sex-specific differences in Hemodialysis prevalence and practices and the male-to-female mortality rate: the dialysis outcomes and practice patterns study (DOPPS). PLoS Med. 2014;https://doi.org/10.1371/ journal.pmed.1001750.
51. Villar E, Remontet L, Labeeuw M, Ecochard R. Effect of age, gender, and diabetes on excess death in end-stage renal failure. J Am Soc Nephrol. 2007;18:2125–34.
52. Tancredi M, Rosengren A, Svensson AM, Kosiborod M, Pivodic A, Gudbjörnsdottir S, et al. Excess mortality among persons with type 2 diabetes. N Engl J Med. 2015;373:1720–32.
53. Carrero JJ, de Mutsert R, Axelsson J, Dekkers OM, Jager KJ, Boeschoten EW, et al. Sex differences in the impact of diabetes on mortality in chronic dialysis patients. Nephrol Dial Transplant. 2011;26:270–6.
54. Levey AS, Coresh J, Greene T, Stevens LA, Zhang YL, Hendriksen S, et al. Chronic kidney disease epidemiology collaboration. Using standardized serum creatinine values in the modification of diet in renal disease study equation for estimating glomerular filtration rate. Ann Intern Med. 2006;145:247–54.
55. Levey AS, Stevens LA, Schmid CH, Zhang YL, Castro AF 3rd, Feldman HI, et al. A new equation to estimate Glomerular filtration rate. Ann Intern Med. 2009;150:604–12.
56. Russo GT, Giandalia A, Romeo EL, Nunziata M, Muscianisi M, Ruffo MC, et al. Fracture risk in type 2 diabetes: current perspectives and gender differences. Int J Endocrinol. 2016;https://doi.org/10.1155/2016/1615735.
57. Gentile S, Piscitelli P, Viazzi F, Russo G, Ceriello A, Giorda C, et al. Antihyperglycemic treatment in patients with type 2 diabetes in Italy: the impact of age and kidney function. Oncotarget. 2017;8:62039–48. 58. Trifirò G, Parrino F, Pizzimenti V, Giorgianni F, Sultana J, Muscianisi M, et al.
The Management of Diabetes Mellitus in patients with chronic kidney disease: a population-based study in southern Italy. Clin Drug Investig. 2016; 36:203–12.
• We accept pre-submission inquiries
• Our selector tool helps you to find the most relevant journal • We provide round the clock customer support
• Convenient online submission • Thorough peer review
• Inclusion in PubMed and all major indexing services • Maximum visibility for your research
Submit your manuscript at www.biomedcentral.com/submit