ScienceDirect
Available online at Available online at www.sciencedirect.comwww.sciencedirect.com
ScienceDirect
Structural Integrity Procedia 00 (2016) 000–000
www.elsevier.com/locate/procedia
2452-3216 © 2016 The Authors. Published by Elsevier B.V.
Peer-review under responsibility of the Scientific Committee of PCF 2016.
XV Portuguese Conference on Fracture, PCF 2016, 10-12 February 2016, Paço de Arcos, Portugal
Thermo-mechanical modeling of a high pressure turbine blade of an
airplane gas turbine engine
P. Brandão
a, V. Infante
b, A.M. Deus
c*
aDepartment of Mechanical Engineering, Instituto Superior Técnico, Universidade de Lisboa, Av. Rovisco Pais, 1, 1049-001 Lisboa,
Portugal
bIDMEC, Department of Mechanical Engineering, Instituto Superior Técnico, Universidade de Lisboa, Av. Rovisco Pais, 1, 1049-001 Lisboa,
Portugal
cCeFEMA, Department of Mechanical Engineering, Instituto Superior Técnico, Universidade de Lisboa, Av. Rovisco Pais, 1, 1049-001 Lisboa,
Portugal
Abstract
During their operation, modern aircraft engine components are subjected to increasingly demanding operating conditions, especially the high pressure turbine (HPT) blades. Such conditions cause these parts to undergo different types of time-dependent degradation, one of which is creep. A model using the finite element method (FEM) was developed, in order to be able to predict the creep behaviour of HPT blades. Flight data records (FDR) for a specific aircraft, provided by a commercial aviation company, were used to obtain thermal and mechanical data for three different flight cycles. In order to create the 3D model needed for the FEM analysis, a HPT blade scrap was scanned, and its chemical composition and material properties were obtained. The data that was gathered was fed into the FEM model and different simulations were run, first with a simplified 3D rectangular block shape, in order to better establish the model, and then with the real 3D mesh obtained from the blade scrap. The overall expected behaviour in terms of displacement was observed, in particular at the trailing edge of the blade. Therefore such a model can be useful in the goal of predicting turbine blade life, given a set of FDR data.
© 2016 The Authors. Published by Elsevier B.V.
Peer-review under responsibility of the Scientific Committee of PCF 2016.
Keywords: High Pressure Turbine Blade; Creep; Finite Element Method; 3D Model; Simulation.
* Corresponding author. Tel.: +351 218419991.
E-mail address: [email protected]
Procedia Structural Integrity 13 (2018) 1663–1669
2452-3216 2018 The Authors. Published by Elsevier B.V. Peer-review under responsibility of the ECF22 organizers. 10.1016/j.prostr.2018.12.348
ScienceDirect
Structural Integrity Procedia 00 (2018) 000–000
www.elsevier.com/locate/procedia
2452-3216 © 2018 The Authors. Published by Elsevier B.V. Peer-review under responsibility of the ECF22 organizers.
ECF22 - Loading and Environmental effects on Structural Integrity
Evaluation of mechanical properties of polyethylene for pipes by
energy approach during tensile and fatigue tests
G. Risitano
a*, E. Guglielmino
a, D. Santonocito
a aUniversity of Messina, Department of Engineering, Contrada di Dio, 98166 Messina, ItalyAbstract
Since its introduction in pipe applications more than 40 years ago, polyethylene (PE) has been taking a growing place in gas and water distribution due to its low cost, lightness and good corrosion resistance. Besides, long-term properties have been steadily rising due to the development of novel PE-based materials. The present highest standard is the PE100 class. Several laboratory tests are used to extract design data for long-term failure-type prediction based on stress and time to failure relationship. It remains difficult to assess the relation between creep and fatigue loadings on the one side. On the other side, the manufacturing process of the test specimens influences considerably the obtained performance for viscoelastic materials subjected to working conditions. In present paper, the mechanical properties of high-density polyethylene (HDPE), PE 100 class, for pipes were investigated using experimental techniques. Thermographic technique was used during the static tests in order to identify the maximum stress zone and also during the fatigue tests to study the temperature evolution of the specimen. The aim of this study is the application of the Thermographic Method for the fatigue assessment of PE100.
© 2018 The Authors. Published by Elsevier B.V. Peer-review under responsibility of the ECF22 organizers. Keywords: polyethylene; fatigue assessment; Thermographic Method.
1. Introduction
Since its introduction in pipe applications more than 40 years ago, polyethylene (PE) has been taking a growing place in gas and water distribution due to its low cost, lightness and good corrosion resistance. Besides, long-term properties have been steadily rising due to the development of new PE based materials. Lifetime prediction of
* Corresponding author. Tel.: +39 347 3209239.
E-mail address: [email protected]
10.1016/j.prostr.2018.12.348 2452-3216
© 2018 The Authors. Published by Elsevier B.V. Peer-review under responsibility of the ECF22 organizers.
ScienceDirect
Structural Integrity Procedia 00 (2018) 000–000
www.elsevier.com/locate/procedia
2452-3216 © 2018 The Authors. Published by Elsevier B.V. Peer-review under responsibility of the ECF22 organizers.
ECF22 - Loading and Environmental effects on Structural Integrity
Evaluation of mechanical properties of polyethylene for pipes by
energy approach during tensile and fatigue tests
G. Risitano
a*, E. Guglielmino
a, D. Santonocito
a aUniversity of Messina, Department of Engineering, Contrada di Dio, 98166 Messina, ItalyAbstract
Since its introduction in pipe applications more than 40 years ago, polyethylene (PE) has been taking a growing place in gas and water distribution due to its low cost, lightness and good corrosion resistance. Besides, long-term properties have been steadily rising due to the development of novel PE-based materials. The present highest standard is the PE100 class. Several laboratory tests are used to extract design data for long-term failure-type prediction based on stress and time to failure relationship. It remains difficult to assess the relation between creep and fatigue loadings on the one side. On the other side, the manufacturing process of the test specimens influences considerably the obtained performance for viscoelastic materials subjected to working conditions. In present paper, the mechanical properties of high-density polyethylene (HDPE), PE 100 class, for pipes were investigated using experimental techniques. Thermographic technique was used during the static tests in order to identify the maximum stress zone and also during the fatigue tests to study the temperature evolution of the specimen. The aim of this study is the application of the Thermographic Method for the fatigue assessment of PE100.
© 2018 The Authors. Published by Elsevier B.V. Peer-review under responsibility of the ECF22 organizers. Keywords: polyethylene; fatigue assessment; Thermographic Method.
1. Introduction
Since its introduction in pipe applications more than 40 years ago, polyethylene (PE) has been taking a growing place in gas and water distribution due to its low cost, lightness and good corrosion resistance. Besides, long-term properties have been steadily rising due to the development of new PE based materials. Lifetime prediction of
* Corresponding author. Tel.: +39 347 3209239.
polymeric materials has been the subject of numerous studies [1][2][3][4]. The present highest standard is PE 100 class (ISO 12162), high-density polyethylene (HDPE), which means that pipes made from such materials should withstand a hoop stress of 10 MPa for 50 years at room temperature including a 1.25 safety factor.
The use of HDPE in applications requiring a long service lifetime such as for pressurized pipes for water and gas, has dramatically increased in the last years. For the new generation of pipe materials, a lifetime as long as 100 years is expected under normal operation conditions. To ensure proper performance over such a long time, precisely predicting the behavior of the HDPE pipes under the respective storage conditions is very important. Such information is usually acquired using accelerated laboratory aging procedures, one of which is the hydrostatic pressure test, the most frequently and widely used method. Accelerated stress cracking test are also commonly performed in surfactant environment in order to reduce test time, but transposition of the results for predicting life time of pipes in natural conditions is not straightforward.
Deveci et al. in [5] discussed correlations of molecular weight, molecular weight distribution, short chain branching and rheological properties of different polyethylene materials with their slow crack growth resistances obtained from the strain hardening and crack round bar tests and their correlations with notched pipe tests.
In [6], an experimental analysis for determining the fatigue strength of HDPE-100 under cyclic loading is presented. The curve of cumulative fatigue damage versus number of cycles (D-N) was deduced from stiffness degradation. Based on the three stage damage trend, the remaining fatigue life is numerically predicted by considering a double term power damage accumulation model. This model is found to be accurate, both in modeling the rapid damage growth in the early life and near the end of the fatigue life. Numerical results illustrate that the proposed model is capable of accurately fitting several different sets of experimental data.
The traditional methods of fatigue assessment of metallic and composite materials are extremely time consuming. In order to overcome the above-mentioned problems, an innovative approach for fatigue assessment of materials and structures has been proposed by La Rosa and Risitano [7]: the Thermographic Method (TM). The Thermographic Method, based on thermographic analyses, allows the rapid determination of the fatigue limit. A review of the scientific results in literature, related to the application of the thermographic techniques to composite materials have been presented by Vergani et al. [8].
An innovative approach to determinate the fatigue limit during tensile static test has been proposed by Clienti et al. [9] for plastic material and by Risitano and Risitano [10] for metallic material. In [9], authors suggest that during quasi-static tensile tests the area, where first irreversible plasticization occurred, is detectable by the analysis of the T vs σ curve considering the temperature change of the curve slope. This variation identifies the transition zone between thermoelastic and thermoplastic behaviour, or in other words, the beginning of irreversible micro-plasticization. The authors have suggested that in that transition zone, there is the damage limit of material. This damage limit must be understood as the macroscopic stress value that would cause the material to break if subjected to cyclic loading at any load ratio. Then, it is very close to the traditional fatigue limit. This approach, called Static Thermographic Method (STM), correlated the first deviation from linearity of the temperature surface of the material during tensile test to the fatigue limit. This was observed for basalt fibre reinforced composites by Colombo et al. [11] and glass fibre reinforced composites by Crupi et al. [12] [13].
This paper investigates static and fatigue behavior for a high-density polyethylene (HDPE), PE 100 class. The aim of this study is to apply for the first time both the TM and STM for the fatigue assessment of HDPE comparing the results with the results obtained by the traditional procedure, obviously taking into account that the polyethylene has different and more complex fatigue mechanisms respect to metallic materials.
Nomenclature
c specific heat capacity at costant pressure [kJ/(kg.K)]
f frequency [Hz]
Km thermoelastic coefficient [MPa-1]
N number of cycles
Nf number of cycle to failure
R stress ratio
T surface temperature [K]
T0 initial temperature [K]
α thermal linear expansion coefficient [K-1]
ε strain
ρ density [kg/m3]
σ stress [MPa]
σ1 uniaxial stress [MPa]
σmax maximum stress during fatigue test [MPa]
ΔT temperature increment during static test [K]
ΔTd temperature increment during fatigue test [K]
ΔTstab stabilization temperature during TM test [K]
2. Material and methods
The material under study was a high density polyethylene, PE, commercially named PE100. Table 1 shows the mechanical properties of the material by producer datasheet. Table 2 shows the values elaborated on 10 specimens by authors.
Table 1. Mechanical properties of PE 100 by datasheet.
Tensile Stress at Yield Tensile Modulus Tensile Strain at break Density
σy [MPa] E [MPa] εf [%] ρ [kg/m3]
25 1100 >600% 948
ISO 527-2 (50 mm/min) ISO 527-2 (1 mm/min) ISO 527-2 ISO 1872-2/ISO 1183 Table 2. Mechanical properties of PE 100 elaborated on 10 specimens by authors.
Tensile Stress at Yield Tensile Modulus Density σy [MPa] E [MPa] ρ [kg/m3]
25.9±1.9 861±91 948
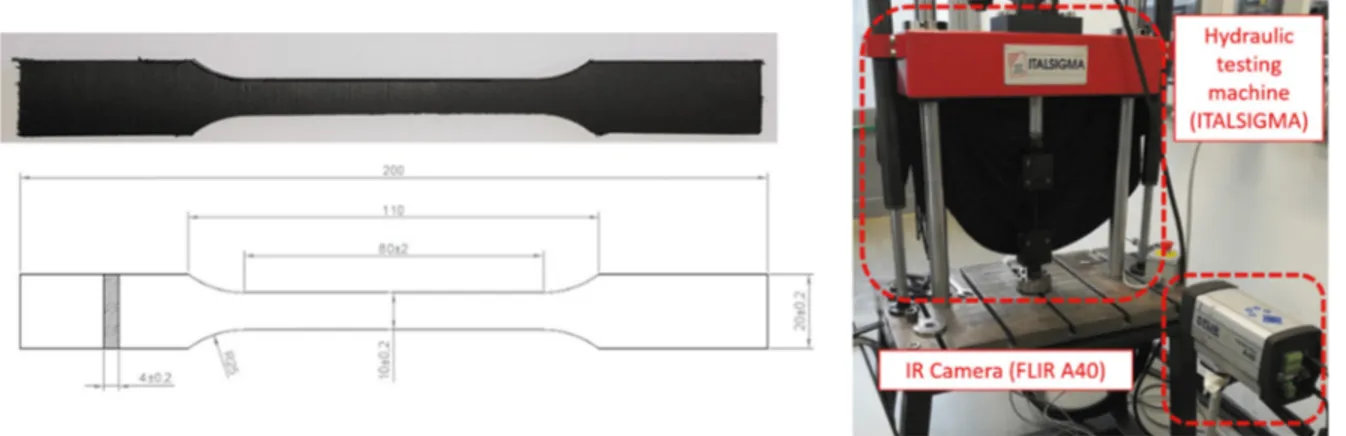
ISO 527-2 (50 mm/min) ISO 527-2 (1 mm/min) 2.1. Dog bone specimens (
Fig. 1a) were injection moulded (type 1A of the ISO 527-2:1993 standard).
polymeric materials has been the subject of numerous studies [1][2][3][4]. The present highest standard is PE 100 class (ISO 12162), high-density polyethylene (HDPE), which means that pipes made from such materials should withstand a hoop stress of 10 MPa for 50 years at room temperature including a 1.25 safety factor.
The use of HDPE in applications requiring a long service lifetime such as for pressurized pipes for water and gas, has dramatically increased in the last years. For the new generation of pipe materials, a lifetime as long as 100 years is expected under normal operation conditions. To ensure proper performance over such a long time, precisely predicting the behavior of the HDPE pipes under the respective storage conditions is very important. Such information is usually acquired using accelerated laboratory aging procedures, one of which is the hydrostatic pressure test, the most frequently and widely used method. Accelerated stress cracking test are also commonly performed in surfactant environment in order to reduce test time, but transposition of the results for predicting life time of pipes in natural conditions is not straightforward.
Deveci et al. in [5] discussed correlations of molecular weight, molecular weight distribution, short chain branching and rheological properties of different polyethylene materials with their slow crack growth resistances obtained from the strain hardening and crack round bar tests and their correlations with notched pipe tests.
In [6], an experimental analysis for determining the fatigue strength of HDPE-100 under cyclic loading is presented. The curve of cumulative fatigue damage versus number of cycles (D-N) was deduced from stiffness degradation. Based on the three stage damage trend, the remaining fatigue life is numerically predicted by considering a double term power damage accumulation model. This model is found to be accurate, both in modeling the rapid damage growth in the early life and near the end of the fatigue life. Numerical results illustrate that the proposed model is capable of accurately fitting several different sets of experimental data.
The traditional methods of fatigue assessment of metallic and composite materials are extremely time consuming. In order to overcome the above-mentioned problems, an innovative approach for fatigue assessment of materials and structures has been proposed by La Rosa and Risitano [7]: the Thermographic Method (TM). The Thermographic Method, based on thermographic analyses, allows the rapid determination of the fatigue limit. A review of the scientific results in literature, related to the application of the thermographic techniques to composite materials have been presented by Vergani et al. [8].
An innovative approach to determinate the fatigue limit during tensile static test has been proposed by Clienti et al. [9] for plastic material and by Risitano and Risitano [10] for metallic material. In [9], authors suggest that during quasi-static tensile tests the area, where first irreversible plasticization occurred, is detectable by the analysis of the T vs σ curve considering the temperature change of the curve slope. This variation identifies the transition zone between thermoelastic and thermoplastic behaviour, or in other words, the beginning of irreversible micro-plasticization. The authors have suggested that in that transition zone, there is the damage limit of material. This damage limit must be understood as the macroscopic stress value that would cause the material to break if subjected to cyclic loading at any load ratio. Then, it is very close to the traditional fatigue limit. This approach, called Static Thermographic Method (STM), correlated the first deviation from linearity of the temperature surface of the material during tensile test to the fatigue limit. This was observed for basalt fibre reinforced composites by Colombo et al. [11] and glass fibre reinforced composites by Crupi et al. [12] [13].
This paper investigates static and fatigue behavior for a high-density polyethylene (HDPE), PE 100 class. The aim of this study is to apply for the first time both the TM and STM for the fatigue assessment of HDPE comparing the results with the results obtained by the traditional procedure, obviously taking into account that the polyethylene has different and more complex fatigue mechanisms respect to metallic materials.
Nomenclature
c specific heat capacity at costant pressure [kJ/(kg.K)]
f frequency [Hz]
Km thermoelastic coefficient [MPa-1]
N number of cycles
Nf number of cycle to failure
R stress ratio
T surface temperature [K]
T0 initial temperature [K]
α thermal linear expansion coefficient [K-1]
ε strain
ρ density [kg/m3]
σ stress [MPa]
σ1 uniaxial stress [MPa]
σmax maximum stress during fatigue test [MPa]
ΔT temperature increment during static test [K]
ΔTd temperature increment during fatigue test [K]
ΔTstab stabilization temperature during TM test [K]
2. Material and methods
The material under study was a high density polyethylene, PE, commercially named PE100. Table 1 shows the mechanical properties of the material by producer datasheet. Table 2 shows the values elaborated on 10 specimens by authors.
Table 1. Mechanical properties of PE 100 by datasheet.
Tensile Stress at Yield Tensile Modulus Tensile Strain at break Density
σy [MPa] E [MPa] εf [%] ρ [kg/m3]
25 1100 >600% 948
ISO 527-2 (50 mm/min) ISO 527-2 (1 mm/min) ISO 527-2 ISO 1872-2/ISO 1183 Table 2. Mechanical properties of PE 100 elaborated on 10 specimens by authors.
Tensile Stress at Yield Tensile Modulus Density σy [MPa] E [MPa] ρ [kg/m3]
25.9±1.9 861±91 948
ISO 527-2 (50 mm/min) ISO 527-2 (1 mm/min) 2.1. Dog bone specimens (
Fig. 1a) were injection moulded (type 1A of the ISO 527-2:1993 standard).
The static tests were carried out using an ITALSIGMA’s servo-hydraulic load machine at a crosshead rate equal to 5 mm/min with constant temperature and relative humidity (23 °C and 50% RH). The tensile tests were carried out on 10 specimens. During all tensile tests, the infrared
camera FLIR A40 was used ( Fig. 1b).
The 10 specimens, investigated under fatigue loading, have the same geometry (
Fig. 1a) of those used for the static tests and are made with the same technological process. For fatigue tests, the following parameters were used:
• load ratio R= 0.1; • test frequency f= 5 Hz.
The tests were performed in constant stress at constant temperature and relative humidity (23 °C and 50% RH). As previously mentioned, during all the tests the surface temperature of the specimen was monitored with an IR camera. Two types of tests were performed. One series of fatigue tests (7 specimens) were carried out with a constant load until failure. Other series of tests (3 specimens) were carried out with increasing load step until failure: for two tests, eleven 10.000 cycles loading step from 10 MPa to 20 MPa were used; while for the other test, nine 10.000 cycles loading step from 12 MPa to 20 MPa were used. The specimen fails when it reaches an elongation equal to the elastic limit elongation of the material. This value was obtained considering the maximum stress achieved by the specimens during the previous static tests and it is equal to 6.9 mm.
3. Theoretical approach
During static tests of common engineering metals, the temperature evolution on the specimen surface, detected by means of an infrared camera, is characterized by three phases: an initial approximately linear decrease due to the thermoelastic effect (phase 1), then the temperature deviates from linearity until a minimum (phase 2) and a very high further temperature increment until the failure (phase 3).
Fig. 2. Typical trend of stress and temperature during a static tensile test.
A typical trend of stress and temperature during a static tensile test is shown in Fig. 2. For linear isotropic homogeneous material and in adiabatic condition, the variation of temperature during phase 1 of the static test for uniaxial stress state is:
1 0 1 0 T K T c T m (1)
Clienti et al. [9] for the first time correlated the first deviation from linearity, which corresponds to the end of phase 1, to the fatigue limit of plastic materials. As reported in [11] “the end of the thermoelastic phase could be related…to a stress value σD, which can identify the initiation of a different kind of damage”.
During HCF tests of common engineering metals, the temperature evolution on the specimen surface, detected by means of an infrared camera, is characterized by three phases when the specimen is cyclically loaded above its fatigue limit: an initial rapid increment (phase I), a plateau region (phase II), then a very high further temperature increment until the failure (phase III). The same trend was observed for metals in low cycle fatigue (LCF) by Crupi et al. [14], very high cycle fatigue VHCF regimes by Crupi et al. [15] and for marine welded joints by Corigliano et al. [16].
For that concerns the SFRP composite materials, the temperature evolution during the fatigue tests is different [13]. After an initial linear increment (phase I), there is another linear increment with lower slope (phase II).
4. Results and discussion
During tensile tests, the temperature of the specimen surface was detected by means of an IR camera. Fig. 3a shows the applied stress and the temperature increment ΔT, detected by means of the themocamera, during a tensile test. In the initial part of the ΔT–t curve, a linear trend is clearly visible in the curve (phase 1) and its slope corresponds to the thermoelastic coefficient Km of eq. (1); then the temperature deviates from linearity (phase 2) presenting a zero
derivative flex. It is possible to draw two linear regression lines, one for phase 1 and the other for phase 2 and to determinate the relative equations of the two straight lines.
Fig. 3. (a) Applied stress and experimental temperature increment during tensile test; (b) ΔT vs N curve
By solving the system of the two equations, it is possible to determine the coordinates of the meeting point of the two straight lines and, therefore, the stress value for which there is the transition from phase 1 (thermoelastic phase) to phase 2 (thermoplastic phase).
In the specific case, the stress value is 12.3 MPa. Obviously, the problem could also be resolved graphically. Similar behavior can also be seen in the other tensile tests and the value of the fatigue limit determinate by STM on 3 specimens is 12.53±0.25 MPa.
Fatigue tests at constant amplitude values of the stress range were carried out until failure at a load ratio R= 0.1. The temperature of the specimen surface was detected by an IR camera during each fatigue test. Fig. 3b Errore. L'origine riferimento non è stata trovata. plots the typical ΔT vs N curve, during a fatigue test at σmax= 17 MPa,
showing the three phases of TM: an initial rapid linear increment (phase I), an another linear increment with lower slope (phase II) and a sudden increase just before the specimen failure (phase III). The three different phases of TM are also evident, for the same specimen, in the thermal image sequence of Fig. 4.
Fig. 4. Evolution of PE100 specimen surface temperature during the fatigue test
Fig. 5a shows the S-N data obtained applying the traditional procedure, based on fatigue tests carried out at constant amplitude of stress ranges, the S-N data obtained by mean of TM and the S-N data of PE100 from different manufacturer as reported by Deveci et al. in [5]. It is interesting to note that the fatigue strength is between 12 MPa (run out test) and 15 MPa (2ꞏ106 cycles to failure).
Fig. 5. (a) S-N curve; (b) Fatigue limit predicted by the TM.
Fig. 5b shows the fatigue limit predicted by the TM using the stabilization temperature applied to all the twenty fatigue tests. As recommended in [17], two distinct linear regressions have been drawn; the x coordinate of the point in common to the two straight lines is the fatigue limit. It is very interesting to note that the fatigue strength is 11.32 MPa.
The values obtained using the different approaches seem to be in good agreement: • By S-N curve: between 12 and 15 MPa;
• Thermographic Method: 11.32 MPa;
• Static Thermographic Method: 12.53±0.25 MPa. 5. Conclusions
Full-field techniques were applied for the analysis of high density polyethylene PE100 specimens under static and fatigue loading. The IR technique allowed the application of the Thermographic Method.
The thermographic measurements during static tests can be used to predict the fatigue limit. The aim of this study is the application of this procedure for the fatigue assessment of polyethylene (PE).
The predictions of the fatigue strength, obtained by means of STM during tensile test and of TM during fatigue tests, were compared with the value obtained by the traditional procedure. The predicted values are in good agreement with the experimental values of fatigue strength.
The results gave interesting information for the development of prediction models for the fatigue strength assessment of polyethylene.
Acknowledgements
The research reported in this paper was conducted with the support of Plastitalia S.p.a. References
1. Langlois, V., Audouin, L., Verdu, J., and Courtois, P. (1993) Thermooxidative aging of crosslinked linear polyethylene: Stabilizer consumption and lifetime prediction. Polym. Degrad. Stab., 40 (3), 399–409.
2. Gugumus, F. (1999) Effect of temperature on the lifetime of stabilized and unstabilized PP films. Polym. Degrad. Stab., 63 (1), 41–52. 3. Celina, M., Gillen, K.T., and Assink, R.A. (2005) Accelerated aging and lifetime prediction: Review of non-Arrhenius behaviour due to two
competing processes. Polym. Degrad. Stab., 90 (3), 395–404.
4. Gillen, K.T., Bernstein, R., Clough, R.L., and Celina, M. (2006) Lifetime predictions for semi-crystalline cable insulation materials: I. Mechanical properties and oxygen consumption measurements on EPR materials. Polym. Degrad. Stab., 91 (9), 2146–2156.
5. Deveci, S., and Fang, D. (2017) Correlation of molecular parameters, strain hardening modulus and cyclic fatigue test performances of polyethylene materials for pressure pipe applications. Polym. Test., 62, 246–253.
6. Djebli, A., Bendouba, M., Aid, A., Talha, A., Benseddiq, N., and Benguediab, M. (2016) Experimental Analysis and Damage Modeling of High-Density Polyethylene under Fatigue Loading. Acta Mech. Solida Sin., 29 (2), 133–144.
7. La Rosa, G., and Risitano, A. (2000) Thermographic methodology for rapid determination of the fatigue limit of materials and mechanical components. Int. J. Fatigue, 22 (1), 65–73.
8. Vergani, L., Colombo, C., and Libonati, F. (2013) A review of thermographic techniques for damage investigation in composites. Fract. Struct. Integr., 0 (27), 1–12.
9. Clienti, C., Fargione, G., La Rosa, G., Risitano, A., and Risitano, G. (2010) A first approach to the analysis of fatigue parameters by thermal variations in static tests on plastics. Eng. Fract. Mech., 77 (11).
10. Risitano, A., and Risitano, G. (2013) Determining fatigue limits with thermal analysis of static traction tests. Fatigue Fract. Eng. Mater. Struct., 36 (7).
11. Colombo, C., Vergani, L., and Burman, M. (2012) Static and fatigue characterisation of new basalt fibre reinforced composites. Compos. Struct., 94 (3), 1165–1174.
12. Crupi, V., Guglielmino, E., Risitano, G., and Tavilla, F. (2015) Experimental analyses of SFRP material under static and fatigue loading by means of thermographic and DIC techniques. Compos. Part B Eng., 77.
13. Crupi, V., Guglielmino, E., Scappaticci, L., and Risitano, G. (2017) Fatigue assessment by energy approach during tensile and fatigue tests on PPGF35. Procedia Struct. Integr., 3, 424–431.
14. Crupi, V., Chiofalo, G., and Guglielmino, E. (2011) Infrared investigations for the analysis of low cycle fatigue processes in carbon steels. Proc. Inst. Mech. Eng. Part C J. Mech. Eng. Sci., 225 (4), 833–842.
15. Crupi, V., Epasto, G., Guglielmino, E., and Risitano, G. (2015) Thermographic method for very high cycle fatigue design in transportation engineering. Proc. Inst. Mech. Eng. Part C J. Mech. Eng. Sci., 229 (7).
16. Corigliano, P., Epasto, G., Guglielmino, E., and Risitano, G. (2017) Fatigue analysis of marine welded joints by means of DIC and IR images during static and fatigue tests. Eng. Fract. Mech., 183.
17. Curà, F., Curti, G., and Sesana, R. (2005) A new iteration method for the thermographic determination of fatigue limit in steels. Int. J. Fatigue, 27 (4), 453–459.