1
Amending the Anisotropy Barrier and Luminescence Behavior of
Heterometallic Trinuclear Linear [M
II-Ln
III-M
II] (Ln
III= Gd, Tb, Dy; M
II= Mg
/ Zn) Complexes by Change from Divalent Paramagnetic to Diamagnetic
Metal ions
Sourav Das,[a] K. S. Bejoymohandas,[b], [c] Atanu Dey,[a] Sourav Biswas,[a] M. L. P. Reddy,[b], [c]
Roser Morales[d], Eliseo Ruiz[d], Silvia Titos-Padilla,[e] Enrique Colacio,*[e] and Vadapalli
Chandrasekhar,*[a], [f]
[a] Department of Chemistry, Indian Institute of Technology Kanpur, Kanpur-208016, India Home page: http://www.iitk.ac.in
[b] Materials Science and Technology Division, National Institute for Interdisciplinary Science and Technology (NIIST), Council of Scientific and Industrial Research (CSIR), Thiruvananthapuram 695 019, India.
Home page: http://www.niist.res.in/english/
[c] Academy of Scientific and Innovative Research (AcSIR), New Delhi 110001, India. Home page: http://acsir.res.in/
[d] Departament de Química Inorgànica and Institut de Recerca de Química Teòrica i Computacional, Universitat de Barcelona, Diagonal 645, E-08028 Barcelona, Spain
[e] Departamento de Química Inorgánica, Facultad de Ciencias, Universidad de Granada, Avenida de Fuentenueva s/n, 18071 Granada, Spain.
Home page: http://www.ugr.es
[f] National Institute of Science Education and Research, Institute of Physics Campus, SachivalayaMarg, PO: Sainik School, Bhubaneswar - 751 005, India.
2
Home page: http://www.niser.ac.in
AUTHOR EMAIL ADDRESS: [email protected]; [email protected]
Abstract
The sequential reaction of a multisite coordinating compartmental ligand LH4
[2-(2-hydroxy-3-(hydroxymethyl)-5-methylbenzylideneamino)-2-methylpropane-1,3-diol] with appropriate
lanthanide salts followed by the addition of Mg(NO3)2·6H2O or Zn(NO3)2·6H2O in a 4:1:2
stoichiometric ratio in the presence of triethylamine affords a series of isostructural heterometallic trinuclear complexes containing [Mg2Ln]3+ [Ln = Dy (1), Gd (2) and Tb (3)] and
[Zn2Ln]3+ [Ln = Dy (4), Gd (5) and Tb (6)] cores. The formation of 1-6 is demonstrated by X-ray
crystallography as well as ESI-MS spectra. All complexes are isostructural possessing a linear trimetallic core with a central lanthanide ion. In this article we have discussed the comprehensive studies, involving synthesis, structure, magnetism and photophysical properties on this family of trinuclear [Mg2Ln]3+ and [Zn2Ln]3+ heterometallic complexes. Complexes 1 and 4 show slow
relaxation of the magnetization below 12 K under zero applied direct-current field, but without reaching a neat maximum which is due to the overlapping with a faster quantum tunnelling relaxation mediated through dipole-dipole and hyperfine interactions. Under a small applied direct-current field of 1000 Oe the quantum tunneling was almost suppressed and temperature and frequency dependent peaks were observed, thus confirming the SMM behavior of complexes
1 and 4. The fit of the high-temperature relaxation times to the Arrhenius equation affords an
effective energy barrier for the reversal of the magnetization of Ueff =72(2) K with o = 8 x 10⁻⁹ s
3
an effective energy barrier for the reversal of the magnetization Ueff = 67(3) K with o = 4.5 x 10
-8 s. To rule out the involvement of intermolecular collaborative interactions in the dynamic of
relaxation, we have performed ac susceptibility measurements on 1:10 Dy:Y magnetic diluted samples of of 1 and 4, named as 1' and 4'. Interestingly, the diluted compounds 1' and 4' exhibits SMM behavior under zero magnetic field, thus suggesting that their relaxation processes are single molecular in origin and arise from the M-Dy-M unit. Ab initio CASSCF+RASSI calculations carried out on 1 and 4 confirm that the magnetic anisotropy is axial along the M-Dy-M axis and that the relaxation process occurs through the first excited energy level. Furthermore, the chromophoric [LH3]2– ligand is able to act as an “antenna” group which was found to be
effective in the selective sensitization of the emissions of TbIII-based complexes 3 and 6. The
emission quantum yields and the luminescence lifetimes at room temperature are 11.7 % and 0.606 ms for 3, 22.7 % and 0.799 ms for 6.
Keywords: Coordination Chemistry; Heterometallic complexes; Magnetic properties; Single
4
Introduction
Coordination compounds involving lanthanide metal ions have been attracting interest in view of their potential ability to be behave as single-molecule magnets, which have been proposed for applications in molecular spintronics,[1] ultrahigh density magnetic information storage,[2] and
quantum computing[3]. The utility of the lanthanide ions is due to the fact that some of them have
large unquenched orbital angular momenta and consequently large intrinsic magnetic anisotropy besides carrying a significant magnetic moment (i.e., DyIII, TbIII, HoIII, ErIII). In spite of the
attractiveness of lanthanide ion complexes in single-molecule magnets,[4] it is to be noted that
fast quantum tunnelling mechanism (QTM)-induced relaxation processes mediated through dipolar interactions, transverse anisotropy, or hyperfine interactions can reduce the energy barrier to an effective value (Ueff), thus diminishing the SMM properties of the
lanthanide-containing species.[5] To overcome this, there are a few techniques such as the dilution of such
complexes within a diamagnetic matrix to eliminate dipolar interactions[6] and/or the application
of a small static magnetic field[7] to partly or fully suppress the QTM relaxation processes. We, [8]
and others,[9] have experimentally shown that the very weak JM‑Ln value observed for 3d/4f
dinuclear (MII = Mn, Co, Ni, and Cu) [8c-e] and trinuclear (MII = Co and Ni) [8a], [8b] complexes
display small effective energy barriers for the separations of the low-lying split sublevels and consequently to a smaller energy barrier for magnetization flipping. In this regard, an effective plan to boost the SMM properties of the 3d/4f aggregates would be get rid of the very weak MII–
LnIII interactions that split the ground sublevels of the LnIII ion by substituting the paramagnetic
MII ions by a diamagnetic ion [6c], [9a], [10].In addition to their interest in magnetism, lanthanide
5
biomedical analysis[11] (fluoroimmuno assays, cellular imaging, and MRI contrast agents) to
materials science (tunable lasers, amplifiers for optical communications, optical fibers, light emitting diodes etc). [12] These applications are possible because of some important
characteristics of the lanthanide ions: long excited-state life times, high-quantum efficiencies, substantial Stokes shifts and sharp line-like emission bands ranging from near infra-red (PrIII,
NdIII, ErIII) to visible (EuIII, TbIII) spectral domains.[13] In spite of these favourable physical
properties, direct photoexcitation of lanthanide ions has some intrinsic drawbacks as a result of spin and parity forbidden f-f transition.[14] One of the ways of overcoming this problem is to use
suitable organic ligands as sensitizers/chromophores. The latter not only can shield the lanthanide ions from vibrational coupling, but also, under favourable conditions, transfer energy to the lanthanide centre via the so called antenna effect.[15] In addition to this well-known
strategy, more recently there has been interest on 3d-4f complexes, where the 3d-metal complex moiety can act as the antenna chromophore for sensitization of lanthanide ions.[16] Several
ongoing efforts reveal that near-UV or visible range absorbing d-block metal complexes can function as low-energy sensitizers resulting in a strong/bright emission from the d/f ensemble.[16]
On the other hand, utilization of s/f heterometallic combinations have not received attention. Previously, utilizing a tris-hydrazone ligand, P(S)[N(CH3)N=CHC6H4-o-OH]3 (LH3), we
constructed trinuclear Mg(II) complexes that showed promising luminescent properties[17]. Also,
this ligand system and its variation were used to prepare 3d and 3d/4f complexes[18]. In view of
this we are interested to assemble hetero-bimetallic complexes of the type MgII/LnIII and
ZnII/LnIII with a view to probe their magnetism and photophysical properties. Accordingly, we
6
photophysical properties on a family of trinuclear [Mg2Ln]3+ and [Zn2Ln]3+ heterometallic
complexes.
7
Results and Discussion Synthetic Aspects
We have recently reported the efficacy of the ligand 2-(2-hydroxy-3-(hydroxymethyl)-5-methylbenzylideneamino)-2-methylpropane1,3-diol (LH4) to assemble a series of linear tri
nuclear heterometallic CoII2Ln (Ln = Gd, Tb, Dy and Ho) [8b] as well as NiII2Ln[8a] (Ln = Gd, Tb,
Dy and Ho) complexes. Spurred by these results, we were interested in examining the generality of LH4 in assisting such heterometallic ensembles. Accordingly, the sequential reaction of LH4
with Ln(NO3)3·nH2O, followed by the addition of Mg(NO3)2·6H2O/Zn(NO3)2·6H2O in a 4:1:2
stoichiometric ratio in the presence of triethylamine afforded a series of isostructural heterometallic trinuclear complexes containing [Mg2Ln]3+ [Ln = Dy (1), Gd (2) and Tb(3)] and
[Zn2Ln]3+[Ln = Dy (4), Gd (5) and Tb (6)] cores (Scheme 1). ESI-MS spectra of 1-6 reveal that
they retain their molecular integrity in solution (see experimental section and Supporting Information). The ESI-MS spectrum of 1, as a representative example, is given in Figure 1 while those of the others are given in the Supporting Information (Figures S1-S5).
8
Figure 1. (a) Experimental mass spectral pattern of the parent ion peak of complex 1; (b)
simulated isotopic pattern for the parent ion peak showing a close resemblance with the experimental spectrum and (c) full range ESI-MS spectrum of complex 1.
Molecular Structures of 1-6
Single-crystal X-ray diffraction studies reveal that complexes 1-6 are isostructural (only with the change in the divalent metal ions; MgII in complexes 1-3 and ZnII in complexes 4-6) and
crystallize in the monoclinic space group P21/n. Complexes 1-6 are tricationic, containing three
nitrates as the counter anions.
The molecular structure of 1 will be discussed herein to illustrate the common structural features of the six complexes. The molecular structure of 1 is shown in Figure 2 and those of 2-6 are given in Supporting Information (Figure S6). Bond parameters associated with complex 1 are
9
given in the caption of Figure 2 and those of complexes 2-6 are given in the Supporting information (Tables S1 to S5 respectively).
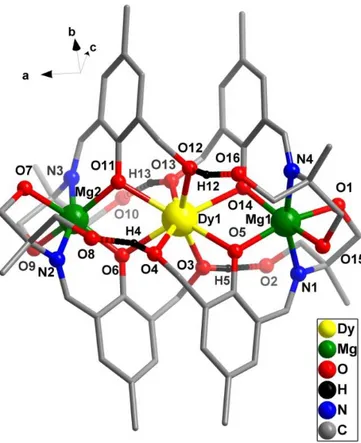
Figure 2. The tricationic complex, 1 (hydrogen atoms, the solvent molecules and nitrate counter
anion have been omitted for clarity). Selected bond distance (Å) and bond angle (o) parameters:
Dy(1)-O(3) 2.329(5), Dy(1)-O(11) 2.346(5), Dy(1)-O(6) 2.353(5), Dy(1)-O(14) 2.354(6),Dy(1)-O(5) 2.383(6), Dy(1)-O(4) 2.395(7), Dy(1)-O(13) 2.407(7), Dy(1)-O(12) 2.411(6), Dy(1)-Mg(2) 3.482(3), Dy(1)-Mg(1) 3.484(3), Mg(1)-O(3) 1.989(7), Mg(1)-O(14) 2.031(7), Mg(1)-O(1) 2.062(10), Mg(1)-N(4) 2.106(9), Mg(1)-O(15) 2.124(9), Mg(1)-N(1) 2.154(8), Mg(2)-O(6) 1.994(6), Mg(2)-O(11) 2.016(6),Mg(2)-O(9) 2.078(7), Mg(2)-O(7) 2.108(7), Mg(2)-N(2) 2.126(8), Mg(2)-N(3) 2.144(9), Mg(1)–O(3)–Dy(1)107.3(3), Mg(2)–O(6)–Dy(1)106.2(2), Mg(2)–O(11)–Dy(1)105.7(2), Mg(1)–O(14)–Dy(1)105.0(3).
10
The heterometallic complexes are formed by the cumulative coordination action of four [LH3]
-ligands. Although the ligand LH4 consists of four coordination sites that can lose a proton, under
the reaction conditions only the phenolic proton gets deprotonated. This phenomenon is similar to that observed in our previous reports.7 The assembly of the trinuclear complexes can be
described in the following way. The phenolate oxygen of each ligand LH4 adopts a µ-bridge
between the MgII and the lanthanide ion. The bond distances associated with the phenolate
oxygen and the metal centers are as follows: Mg–Oavg~ 2.008 Å and Dy–Oavg~ 2.345Å. Due to
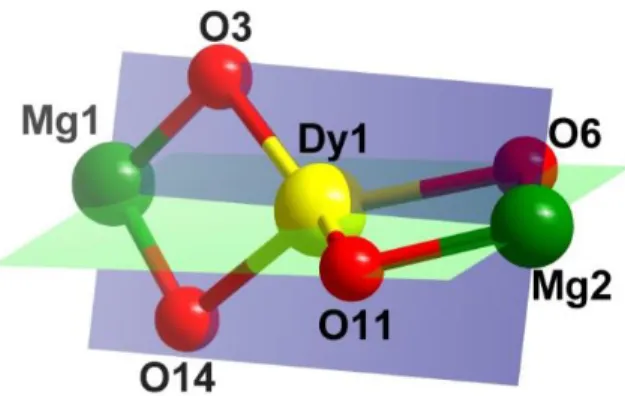
the participation of four [LH3]- in coordination, two four-membered rings (Mg1-O3-Dy1-O14
and Mg2-O6-Dy-O11) are generated (Figure 3).
Figure 3.The trinuclear core of 1 showing two four-membered MgDyO2 rings at an angle of ~
60°.
The two four-membered rings bisect each other with an angle of 59.7°. Some more details of the coordination behaviour are as follows. The imino-nitrogen of the ligand binds with MgII ion with
a distance of 2.016–2.144 Å. The benzylic hydroxyl group of the ligand is not deprotonated and coordinates with the dysprosium ion with a distance of Dy–Oavg~ 2.398 Å. The alcoholic
11
coordinates with the MgII ion with a distance of 2.062–2.124 Å. The other protonated alcoholic
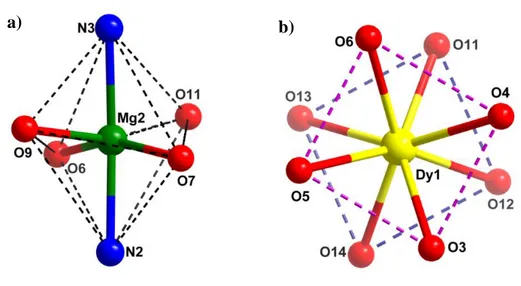
hydroxyl group remains free and takes part in an intramolecular hydrogen bonding with the benzylic hydroxyl group (Figure 2). Further, a two-dimensional hydrogen bonding network is seen along the ab plane; each trinuclear unit interacts with four neighbouring molecules through the nitrate anions (Figure S7). The bond parameters associated with the intra and inter molecular hydrogen bonding are given in Table S6. Based on the various coordination actions as discussed above, MgII ion is hexacoordinated (2N, 4O), in a distorted octahedral geometry; DyIII ion is
eight coordinated (8O) and in a distorted square antiprismatic geometry (Figure 4). Within the DyO8 square antiprism, the interplanar distance, dpp (distance between the upper and lower
planes comprising four oxygen atoms: O3, O4, O5, O6 and O11, O12, O13, O14) is 2.539 Å, whereas the intraplanar distances dip (the shortest distance between the oxygen atoms defining
the above indicated planes) is 2.840 Å. The dpp and dip values clearly indicate an axial
compression of the square-antiprism in 1.[5d] Besides this, the angle (angle between the S8
axis, which is almost perpendicular to the M-Dy-M axis, and a Dy-O direction) of 60.81˚ is greater than the magic angle = 57.4˚ (angle for non-distorted square antiprism) [5b] also
supports the axial compression phenomena of the square-antiprism in 1. The angle between the diagonals of the two squares, (skew angle), is 55.24˚ (for the ideal square antiprism geometry is 45˚) whereas the dihedral angle between the upper and lower O4 squares is =1.2˚ (the ideal geometry angle is zero). The values of the above structural parameters (dip, dpp, , , ) point
to a rather distorted DyO8 square antiprism. In connection with this, the calculation of the degree
of distortion of the DyO8 coordination polyhedron with respect to an ideal eight-vertex
polyhedra, by using the continuous shape measure theory and SHAPE software[19],show that the
12
lowest shape measures correspond to square antiprism (SAPR-8), biaugmented trigonal prism (BTPR-8) and trigonal dodecahedron (TDD-8) with values of 1.113, 2.166 and 2.196, respectively. The structural parameters and shape measures for 4 are very close to those found for 1 (Table S8).
The three metal centres are arranged in a linear fashion with an intermetallic Mg1–Dy–Mg2 angle of 177.9°. The intermetallic seperations are in the range of Mg–Dy = 3.48 Å and Mg–Mg = 6.96 Å.
Figure 4. (a) Distorted octahedral geometry around Mg(II) ion and (b) distorted
square-antiprismatic geometry around Dy(III) ion.
13
Magnetic properties
The direct-current (dc) magnetic susceptibilities (M) of complexes 1-6 has been measured in
the 2-300 K temperature range under an applied magnetic field of 0.1 T and are given in Figure 5 in the form MT vs T.
Figure 5. Temperature dependence of theχMTfor complexes 1-6.
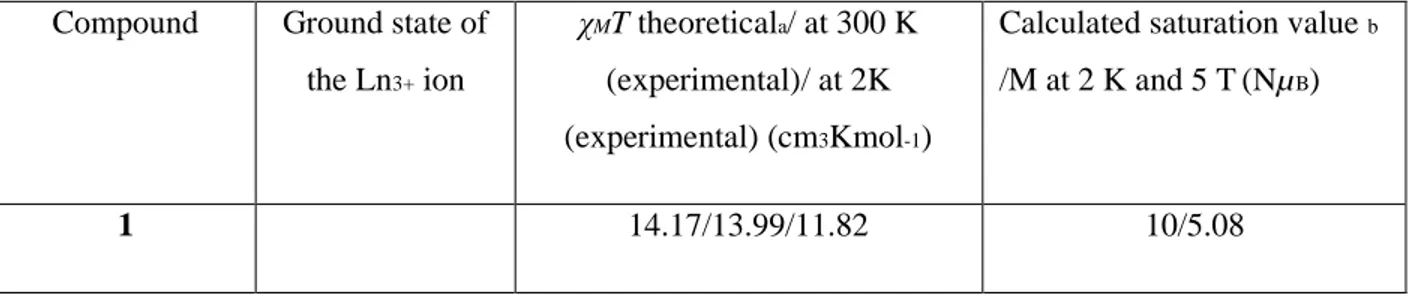
The room temperature χMT values for these complexes are very close to those calculated for
isolated LnIII ions in the free-ion approximation (Table 1).
Table 1: Direct current magnetic data for 1-6.
Compound Ground state of the Ln3+ ion
χMT theoreticala/ at 300 K
(experimental)/ at 2K (experimental) (cm3Kmol-1)
Calculated saturation value b
/M at 2 K and 5 T(NµB)
14 4 6H15/2, gJ =4/3 14.17/13.90/12.08 10/5.23 2 5 8S7/2, gJ =2 7.875/8.125/7.944 7.875/8.07/8.01 7.0/7.04 7.0/7.15 3 6 7F6, gJ =3/2 11.82/13.18/5.41 11.82/12.93/3.4 9.0/5.49 9.0/5.57 a
( 1) 3 2 2 + = g J J k N T j M b ) 1 ( 2 ) 1 ( ) 1 ( 2 3 ; ; + + − + + = + = = J J L L S S g S L J NJ M T T J B On cooling, the MT product of the DyIII (1 and 4) and TbIII (3 and 6) complexes steadily
decreases down to 2 K, which is due to the depopulation of the excited mj sublevels of the DyIII
and TbIII ions, which arise from the splitting of the 6H15/2 and 7F6 ground terms, respectively, by
the ligand field, and/or possible very weak intermolecular interactions between the Ln3+ ions.
The MT product for the GdIII compounds (2 and 4) remains almost constant from room
temperature to 2 K, as expected for such an isotropic ion.
The field dependence of the magnetization for complexes 1-6 are given in Figure S8. The M versus H plot at 2 K for the DyIII (1 and 4) and TbIII (3 and 6) complexes shows a relatively rapid
increase in the magnetization at low field to reach almost saturation for magnetic fields of 5T. The observed saturation values for the DyIII and TbIII complexes are rather lower than the
calculated ones, which is due to crystal-field effects leading to significant magnetic anisotropy.[7a], [20]
The relatively simple point-charge model [5b, 5d] predicts just that DyO8 coordination environments
with an axially elongated square-antiprism D4d symmetry, which can be achieved by increasing the
15
compressed square-antiprism D4d symmetry, which can be reached by increasing the electronic
density near to the basal plane, does not favour the SMM behavior in DyO8 complexes but in the
Er3+ counterparts. Taking into account exclusively the above symmetry criterion, compounds 1 and
4, both possessing axially compressed square-antiprism D4d symmetry, should not exhibit SMM
behavior. It is worth mentioning that this symmetry criterion applies quite well to homoleptic DyO8
systems with almost equivalent oxygen atoms. However, in heteroleptic DyO8 systems with
distorted square-antiprism D4d symmetry and non-equivalent oxygen atoms, the symmetry criterion
is unsuitable for predicting SMM behavior. In these cases, the differences in charge between the oxygen atoms coordinated to the Dy3+ ion play a central role in dictating the SMM behavior. In this
regard, the free ion electron density for the DyIII ion has an oblate shape, which can be stabilized by
an axial crystal field, where the donor atoms with the largest electron densities are located above and below the equatorial plane, thus minimizing the repulsive interactions between the ligands and f-electrons charge clouds. [5c],[9a],[10e] The oxygen atoms involved in the shortest Dy-O bond
distances give rise to increased electrostatic repulsions with the Dy3+ electron density and, to reduce
these repulsive interactions, the Dy3+ disc surface electron density is accommodated almost
perpendicular to the shortest Dy-O bonds. [4g], [10b], [10g], [21]. Therefore, the magnetic moment that is
perpendicular to the electron density disc is found in the direction of the shortest Dy-O bonds. In the case of the heteroleptic complexes 1 and 4, the shortest Dy-O distances involve the phenoxide-oxygen donor atoms at opposite positions of the DyIII ion and therefore an easy–axis anisotropy
could be expected, the magnetic moment lying parallel to the direction defined by the phenoxide-oxygen atoms and therefore close to the M-Dy-M (M = MgII and ZnII) line. The presumable
easy-axis anisotropy of the DyIII ion favors the slow relaxation of the magnetization and the SMM
16
In order to know if compounds 1-6 exhibit slow relaxation of the magnetization and SMM behavior, ac magnetic susceptibility measurements as a function of the temperature and frequency were performed under zero and 1000 Oe dc fields. The results of these measurements demonstrate that only compounds 1 and 4 exhibit frequency dependence the out-of-phase ("M) signals typical of
thermally activated relaxation process (Figure S9 and S10). However, no neat maxima are observed in the temperature dependence of the out-of-phase ("M) at different frequencies, which can be due
to overlapping of different relaxation processes, including a faster quantum tunnelling relaxation process even at frequencies as high as 1400 Hz. This behaviour seems to indicate that 1 and 4 shows slow relaxation of the magnetization and possibly SMM behaviour. The increase of the out-of-phase ("M) signals at very low temperature can be taken as a clear indication of the existence of fast
quantum tunneling of magnetization.
When the ac measurements were performed in the presence of a small external dc field (Figure 6) of 1000 G to fully or partly suppress the quantum tunneling relaxation of the magnetization (QTM), broad peaks appear for 1 with maxima in the temperature range 9.0 K (1488 Hz)-4.5 K (10 Hz). For frequencies upper than 280 Hz two maxima begin to be visible in the 6-9 K range. It should be mentioned that the existence of several thermally activated relaxation processes for crystallographically equivalent DyIII ions is not unprecedented, [4g], [7a], [9b] demonstrating once again
the complexity of the relaxation processes occurring for 4f-containing complexes. The Cole-Cole diagram for 1 in the temperature range 5-6 K (Figure S11) exhibits semicircular shapes but the semicircles become distorted between 6.2 K and 8.2 K indicating the presence of two relaxation process. The fitting of the Cole-Cole plot to the generalized Debye model for two thermally activated processes allowed the extraction of their corresponding relaxation times.
17
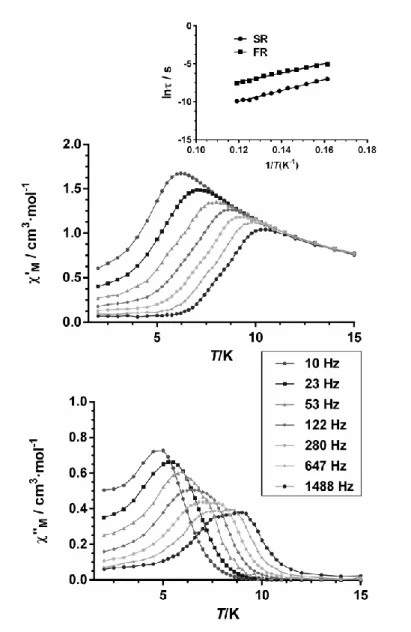
Figure 6. Temperature dependence of in-phase 'M (top) and out-of-phase "M (bottom)
components of the ac susceptibility for complex 1 measured under 1000 Oe applied dc field and Arrhenius plot (inset).
The fit of the temperature dependence of the relaxation times for both processes to the Arrhenius equation (Figure 6 inset) afforded an effective energy barrier for the reversal of the magnetization of
18
Ueff =72(2) K with o = 8 x 10⁻⁹ s for the SR process and Ueff = 61(2) K with o = 4 x 10⁻⁷ s for the
FR process. The Arrhenius plot constructed with the relaxation times extracted from the fitting of the of "M vs frequency data to the Debye equation for only one relaxation process leads to an
intermediate value of Ueff =68(1) K with o = 7 x 10⁻⁸ s, as expected.
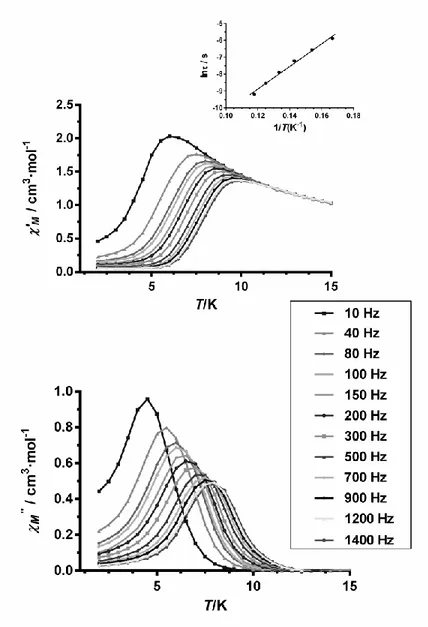
AC susceptibility measurements under an external dc field of 1000 G for 4 (Figure 7) show that the quantum tunneling relaxation of the magnetization (QTM) is almost suppressed and maxima are observed in the temperature range 4.5 K (10 Hz)-8.0 K (1400 Hz). The Cole-Cole diagram for 4 in the temperature range 4.5-9 K (Figure S12) exhibits semicircular shapes and can be fitted using the generalized Debye model, affording values (this parameter determines the width of the distribution of relaxation times, so that = 1 corresponds to an infinitely wide distribution of relaxation times, whereas = 0 describes a single relaxation process) in the range 0.31(4.5 K)-0.21(9 K), which suggest the existence of more than one relaxation process. The relaxation times extracted from the frequency-dependent susceptibility data follow an Arrhenius law with an effective energy barrier for the reversal of the magnetization Ueff = 67(3)
K and o = 4.5 x 10⁻⁸ s (Figure 7, inset). The Arrhenius plot constructed from the temperatures
and frequencies of the maxima observed for the "M signals in Figure 7 leads virtually to the
same result. As expected, the isostructural complexes 1 and 4 exhibit very similar SMM behavior with almost identical Ueff and o parameters.
19
Figure 7. Temperature dependence of in-phase 'M (top) and out-of-phase "M (bottom)
components of the ac susceptibility for complex 4 measured under 1000 Oe applied dc field and Arrhenius plot (inset).
It is well known that when different processes contribute to the relaxation, the Arrhenius plot usually deviates from linearity [22]. Despite the fact that the values extracted from 1 and 4 under a
20
relaxation times for these complexes do not deviate from the Arrhenius linear plot in the temperature range where the curves corresponding to the frequency dependence of the out-of-phase signals show maxima (curves used to extract accurate relaxation times).
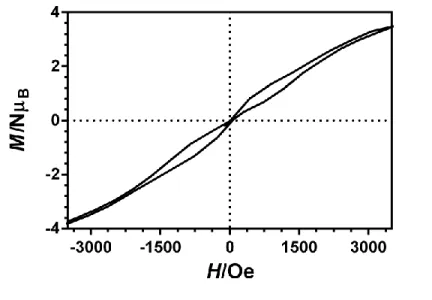
We have performed magnetization hysteresis loop measurements on powder samples of 1 and 4 at 2 K and using a sweeping rate of 0.25 T with the aim of confirming the SMM properties of these compounds (Figure 8 and S13). The compounds exhibit at 2 K butterfly shaped hysteresis loops with a large step near zero field, which is consistent with the QTM generally found for 4f containing complexes and with the tail that these compound exhibits at low temperature in the M″
vs T plot.
Figure 8. Magnetic hysteresis loop for 1 at 2 K and using a sweeping rate of 0.25 T.
In order to know how the intermolecular magnetic dipolar interactions influence the relaxation of the magnetization in these complexes and to unequivocally demonstrate that the relaxation process is single molecular in origin, we have performed ac susceptibility measurements on the
21
magnetic diluted samples 1' and 4'. These samples were prepared through crystallization with the diamagnetic and isostructural Mg2Y and Zn2Y complexes using a Dy/Y molar ratio of 1:10 (the
amount of Dy present in the dilute sample was calculated to be 10.8 and 10.2% for 1' and 4', respectively, from the magnetization values at 5 T and 2 K of the magnetic dilute and neat compounds). X-Ray powder spectra for 1' and 4' clearly show that theses complexes are isostructural between themselves and with the neat compounds (Figure S14). Interestingly, the diluted compounds 1' and 4' shows under zero-field (Figure S15 and Figure 9) out-of-phase peaks in the ranges 6.5 (2000)-8.5K (1000 Hz) and 6.5 (300)-8K (1400 Hz), respectively. The removal of intermolecular interactions in the diluted complex partly suppresses the QTM process and slows relaxation of the magnetization thus allowing the appearance of clear maxima in the temperature dependence of the out-of-phase ("M) signals at different frequencies. Below
approximately 5 K, the out-of-phase ("M) signals increase and show the typical tail due to the
22
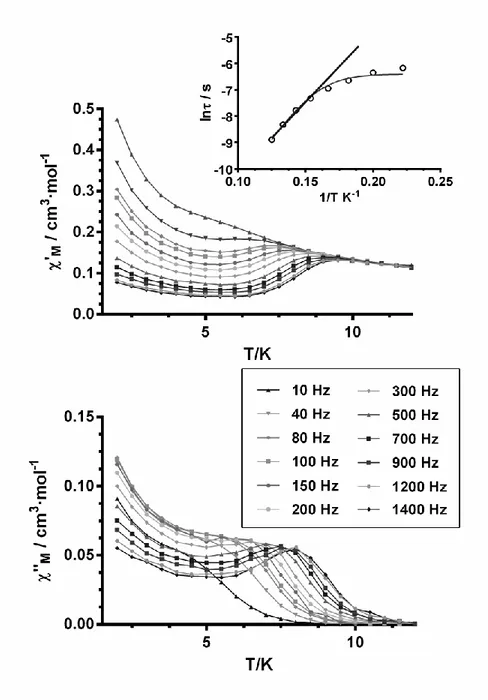
Figure 9. Temperature dependence of in-phase 'M (top) and out-of-phase "M (bottom)
components of the ac susceptibility for the diluted complex 4' under zero applied dc field. Inset: Arrhenius plots of relaxation times of 4'. The black straight solid line represents the best fitting of the experimental data to the Arrhenius equation. The grey line represents the best fit to QTM plus thermally activated relaxation processes.
23
The relaxation times were extracted from the fitting of the frequency -dependent ac data for
1' and 4' to the Debye model (Figure S16). The results were then used in constructing the
Arrhenius plot shown in the insets of Figure S15 and Figure 9. The fit of the high temperature data (above 6.5 K and 5.5 K for 1' and 4', respectively) afforded an effective energy barrier for the reversal of the magnetization of 56.8 (4) K with o = 3.4 x 10⁻⁸ s for 1'
and 54(4) K with o = 1.7 x 10⁻⁷ s for 4'. The Arrhenius plots, constructed from the
temperatures and frequencies of the maxima observed for the "M signals in Figure S15 and
Figure 9, lead virtually to the same results, as expected. As the data deviate from linearity in the low temperature region due to the existence of the QTM relaxation process, we have fitted the temperature dependence of the relaxation time to the following equation th at considers the simultaneous occurrence of both the thermal and QTM processes:
The fit afforded the following parameters: Ueff = 66(7) K with o = 1.7 x 10⁻⁸ s and QT =
0.0017(1) s is for 1' and Ueff = 72(3) K with o = 1.2 x 10⁻⁸ s and QT = 0.0004(2) s is for 4'. The
Ueff values are very close to that obtained for 1 and 4 under a static magnetic field of 1000 Oe
when the QTM process is almost fully suppressed. The Cole-Cole plots for 1' and 4' (Figure S17) show in the 6-9.5 K and 5.5-8 K temperature regions semicircular shapes with values in the range 0.44-0.33 and 0.14-0.38, respectively, thus indicating the presence of a distribution of relaxation processes in those regions. These results and the fact that compounds 2 and 5 do not
24
exhibit out-of-phase ac signals in the temperature dependence of the out-of-phase ac susceptibility plot, clearly point out that the relaxation processes observed in 1 and 4 arise from the M-Dy-M unit rather than from intermolecular interactions and long-range ordering. After applying a small static field of 1000 Oe, the QTM is almost suppressed due a combination of field and dilution effects (Figures S18, S19 and S20) and the fit of the relaxation times vs 1/T data for 1' and 4' in the 9-6 K and 9.8-7 K temperature ranges to the Arrhenius law leads (insets Figure S18 and S19), as expected, to a considerable increase of the thermal energy barrier and a decrease of o (Ueff = 90(7) K and o = 1.1 x 10⁻⁹ for 1' and Ueff = 106(4) K and o = 5.2 x 10⁻¹⁰
for 4'. As expected, the relaxation processes for 1' and 4' under an applied field of 1000 Oe are slower than those for 1 and 4 under the same applied field. The above results for the dilute (1’ and 4’) and undiluted (1 and 4) complexes suggest that the application of a magnetic field of 1000 Oe and the 1/10 Dy/Y dilution process slow the magnetization almost in the same extent. Therefore, it is not surprising that the combination of both effects results in an additional significant slowing of the magnetization relaxation process.
Some experimental results have shown that the substitution of a paramagnetic ion by ZnII
improves the SMM properties.[9a], [10e-h] This is mainly due to the following facts: (i) As the
M-Dy interactions are very small, the first excited state is of only a few wavenumbers above the ground state and therefore a small effective thermal energy barrier is expected. (ii) a paramagnetic ion could create a random transversal field for the DyIII ions which would
favour the faster QTM process and mask of the slow relaxation process[6a], [c], [23] (iii) a
diamagnetic ion would mitigate the intermolecular interactions that favour the fast QTM.[9],
25
Complexes 1 and 4 represent additional good examples of the benefit effects of such substitution as the isostructural analogues Co2Dy and Ni2Dy do not show maxima in the
out-of-phase signal even in the presence of an applied dc field, [8a, b] whereas 1 and 4 show a significant
thermal energy barrier of approximately 70 K. It should be noted in this context that experimental results and theoretical calculations have recently shown that all reported ZnDy compexes have higher Ueff than the mononuclear Dy counterparts.[10h] Therefore, it is clear the
presence of ZnII helps to enhance the Ueff.
In order to support the presence of axial anisotropy and to provide a good description of the parameters involved in the spin relaxation processes of 1 and 4 [21,24], we have performed
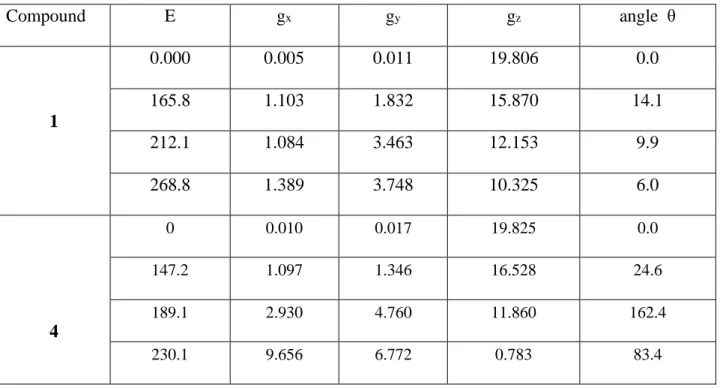
electronic structure calculations based on CASSCF methods. Table 2 presents the calculated energies and g factors for the four lowest Kramers’ doublets. The excitation energies between the ground and second Kramers’ doublets for 1 and 4 are 165.8 and 147.2 cm-1, respectively, which
fall within the typical range for DyIII CASSCF+RASSI calculations. It is worth mentioning that
the experimental temperature dependence of the MT product can be well reproduced from the
energy levels obtained in the ab initio calculations (Figure S21) The ground states are strongly axial (gz around 19.8), with almost vanishing transversal components of g. The easy-axis
anisotropy of the DyIII ion favors the slow relaxation of the magnetization and the SMM
behavior [19a, 21]. Furthermore, the calculated excitation energies in the CASSCF step are also favorable for a strongly anisotropic magnetic moment, with an almost two-fold degenerate ground state (first excitation energies 2.5 and 1.6 cm-1 for complexes 1 and 4, respectively ) and
a higher second excited state (139.6 and 105.6 cm-1, respectively). This energy profile favors the
mixing of mostly the first two CASSCF states in the ground-state wavefunction obtained with the RASSI method, both of similar shape (Figure 10 and Supporting Information Figure S22)
26
resulting in an oblate beta electron density for such state [21]. The plotted beta density of the 4f DyIII electrons obtained in the CASSCF step for the ground state of the two complexes is
represented in Figure 9 (DyIII is 4f9 and the 7 alpha electrons give an isotropic spherical electron
density showing the expected oblate beta electron density for such state). [21]
Table 2. Calculated energies (cm-1), g-factors and the angle between magnetic moment with that
of the ground state for the four lowest Kramers’ doublets in compounds 1 and 4.
Compound E gx gy gz angle θ 1 0.000 0.005 0.011 19.806 0.0 165.8 1.103 1.832 15.870 14.1 212.1 1.084 3.463 12.153 9.9 268.8 1.389 3.748 10.325 6.0 4 0 0.010 0.017 19.825 0.0 147.2 1.097 1.346 16.528 24.6 189.1 2.930 4.760 11.860 162.4 230.1 9.656 6.772 0.783 83.4
27
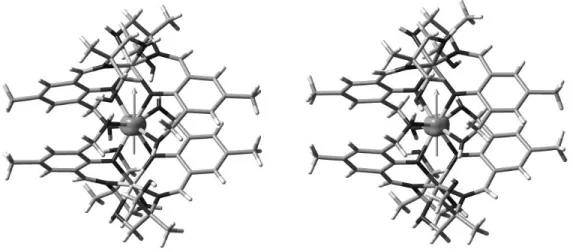
Figure 10. (above) Beta spin density of the DyIII f electrons for the spin-free CASSCF ground
states of 1 (left) and 4 (right), respectively. The direction of the magnetic moment of the ground state is indicated as an orange arrow.
The calculated magnetic moment of the ground state for the two complexes is aligned with the direction of the three metal atoms present in the structure. In order to verify the influence of the ligand potential on the anisotropy of the 4f electronic density of the DyIII cation, we constructed
electrostatic potential maps of the ligand environment projected on the DyIII position by means of
DFT calculations (Figure S23). The differences in the electrostatic potential are very small due to the presence of eight relatively similar oxygen atoms coordinated to the metal. There is a not a clear preferential orientation to accommodate the oblate density of the DyIII with the lowest
electron repulsion with the ligands. Nevertheless, as indicated elsewhere, the distances with the phenoxo oxygen atoms are shorter than those with the alkoxo groups, so that the beta electron density (Figure S23) is accommodated in the equatorial region where the phenoxo groups are located. Despite the small differences in the electrostatic potential created by the oxygen atoms of the ligand, we have been able to calculate the direction of the anisotropy axis of the DyIII ion
28
observed in Figure (Figures S24 and S25), the orientation of the anisotropic axis on each Dy3+
ion compare rather well with that obtained by ab initio methods.
To shed light on the mechanism of the magnetic relaxation in complexes 1 and 4 we computed the transversal magnetic moments between the connecting pairs of opposite magnetization (Figure 11). As can be observed, the transversal magnetic moment between the ground state Kramers’ doublet is very small in both complexes (around 10-3 B), which suggest that QTM is
almost suppressed in the ground state. This must be the reason why 1 and 4 exhibit SMM behavior at zero field. The off diagonal terms of the transversal moments between the ground state and the excited states of opposite magnetization (related with the Orbach process) are only slightly larger than those involving the ground state (around 10-2 B) and therefore the relaxation
takes place through the first excited state via mainly a thermal assisted QTM process, with transversal moments between the two level of the first excited Kramers doublet of 0.55 and 0.48 B for complexes 1 and 4, respectively. Finally, the fact that the effective thermal energy barriers
for 1 and 4 are almost one third of the calculated energy gap between ground and first Kramers’ doublets is most likely due to the existence of QTM promoted by dipole-dipole and hyperfine interactions, which cannot be fully suppressed by dilution and/or by the applications of a small static magnetic field. It is worth mentioning that a much greater reduction of the experimental Ueff with regard to the calculated one (from 200 cm-1 to 23 cm-1) has been recently observed for
a bipyramidal trigonal complex [DyIII(NHPhiPr2)3(THF)2][26]. This large reduction of the Ueff
could be due to the fact that the transversal moment between the ground state Kramers’ doublet is greater than those observed in 1 and 4, thus favouring the QTM and the reduction of the Ueff.
29
Figure 11. Calculated magnetization blocking barrier at CASSCF+RASSI level for 1 (left) and 4
(right) complexes. The black lines correspond to the Kramers’ doublet as function of the magnetic moment. Dotted, solid and arrow lines correspond to quantum tunneling (and thermally-assisted quantum tunneling), Orbach and magnetization reversal mechanism, respectively. The values indicated close to the arrows indicate the matrix elements of the transition magnetic moments.
Photophysical Properties
Electronic Spectra of the Complexes (1-6)
The UV–visible absorption spectra of the free ligand (LH4) and those of the corresponding
complexes 1-6 were recorded in CH3OH solution (c = 1 × 10⁻⁵ M) at 298 K and are depicted in Figure 12. The ligand-centered absorption properties of complexes 1-6 are listed in Table 3.
30
Figure 12. UV–visible absorption spectra for HL4 and complexes 1-6 in CH3OH solution (10–5
M).
The ligand displays absorption bands that spread up to the visible region with absorption maxima at 223, 259, 285, 328 and 415 nm. These band originate due to ligand-centred spin-allowed singlet π–π* transition. The trends in the absorption spectra of the complexes (1-6) are not exactly identical to those observed for the free ligands, indicating that the singlet excited states of the ligands are perturbed by the metal coordination. They display an absorption band localized in the UV region and the absorption maxima of 223, 259 and 328 nm observed for the ligand is red-shifted in all the complexes and are found respectively at ~240, ~270 and ~345nm which can be
31
attributed to the stabilization of the π* orbitals of the ligand upon complexation with the metal ions. It is also noteworthy that the large molar absorption coefficients observed for the LH4
implies that they have a strong ability to absorb light. The magnitudes of molar absorption coefficient values for the complexes were approximately four times higher than that of the ligand, and this trend is consistent with the presence of four ligands in each complex. In this context it is important to mention that in the metal complexes a higher extinction coefficient is observed in comparison to the ligand which indicates the possibility that the ligand can be involved in for the sensitization of lanthanide luminescence.
Table 3: Absorption properties of the ligand and complexes (1-6) in methanol at 298 K
Compound Absorbance λ[nm] (εmaxX 103 M-1cm-1) in solution
1 342 (11.94), 266 (49.60), 237(57.03) 2 340 (13.05), 265 (49.53), 238 (61.56) 3 340 (13.93), 267 (63.39), 237 (65.52) 4 352 (11.06), 268 (23), 240 (48.28) 5 351 (10.62), 269 (64), 240 (59.8) 6 350 (10.11) ,268 (19.26), 240 (43) Ligand 413(2), 328 (2), 285 (4), 258 (7), 223 (15)
32
Photoluminescent properties
In order to understand the energy migration pathways for complexes 1-6, it was necessary to determine the singlet and triplet energy levels of the ligand (LH4). The singlet (1ππ*) energy
level of the ligand (LH4) was determined by reference to the wavelength of the UV-vis upper
absorption edge of Gd3+ complexes 2 and 5 (Figure 12) and the relevant values are 363 nm
(27548 cm–1) and 372 nm (26881 cm–1) respectively. In order to determine the triplet energy (3ππ*) level we have carried out the low temperature (77 K) phosphorescence measurement of
the same gadolinium derivative and the values are found to be 442 nm (22,575 cm–1) and 459 nm (21,778 cm–1) respectively, for the complexes 2 and 5. It is well known that Gd3+ complexes are
ideal for determining triplet energy levels (3ππ*) of the ligand for the following reasons: i) the
lowest-lying excited energy level (6P7/2) for Gd3+ is located at 32150 cm−1 which prohibits any energy transfer to the gadolinium ion from the ligand ii) the heavy paramagnetic ion effect of Gd3+ enhances the possibility of intersystem crossing from the singlet to the triplet state.[27] It is
therefore concluded that the luminescence observed for the gadolinium derivative is explicitly ligand-oriented.
33
Figure 13. Phosphorescence spectra of gadolinium derivative 2 and 5 at 77 K.
It is well documented that the singlet and triplet energy gap {ΔE(1ππ*–3ππ*)} of the ligand
should be close to 5000 cm−1 for an effective inter system crossing (ISC).[28] Thus, in the present
study, it amounts to 4973 cm–1 for 2 and 5103 cm–1 for 5, and therefore suggests that this ligand has a good capability for intersystem-crossing efficiency. The low-temperature phosphorescence spectra of the Gd3+ complexes 2 and 5 are shown in Figure 13.
34
Figure 14. Room-temperature excitation and emission spectra for (a) complex 3 (λex = 340 nm)
and (b) complex 6 (λex = 375 nm) with emission monitored at approximately 545 nm.
Among 1-6, the only Tb(III) derivatives, 3 and 6 exhibit metal-centered luminescence (Figure S26, for Dy(III) derivative). The combined steady state excitation and emission spectra for the Tb3+derivatives 3 and 6 in the solid state at room temperature are depicted in Figure 14a and 14b,
respectively. The excitation spectra for 3 and 6 exhibit a broad band in the 300-400 nm region (centered at ~338 nm for 3 and ~350 nm for 6) because of the π–π* transitions of the ligand. Moreover, it is worth mentioning that in the cases of 3 and 6 the ligand-centered emission is not detected implying an efficient energy transfer process to metal from the ligand excited states. Upon excitation at the ligand energy level (λex= 340 nm), 3 and 6 exhibit a series of characteristic
sharp emission bands of Tb3+centred at 490, 545, 585, and 620 nm, which result from
deactivation of the 5D4 excited state to the corresponding 7FJ ground state of the Tb3+ ion (J = 6,
35
5, 4, 3).[29] The more intense transition centred at 545 nm corresponds to the transition of 5D4 → 7F5.
Table 4: 5D0/5D4 Lifetimes (τobs), Radiative Lifetimes (τRAD), Intrinsic Quantum Yields (ΦLn),
Energy Transfer Efficiencies (Φsen), and Overall Quantum Yields (Φoverall) for Complexes 3 and 6
compound τobs(µs) aτRAD(µs) ΦLn(%) Φsen(%) Φoverall (%)
3 606 ± 8 1474 ± 6 41 28.5 11.7 ± 1
6 799 ± 5 2337 ± 6 34 66.7 22.7 ± 2
aτRAD = observed lifetime at 77K in CD3OD
The room temperature excited state 5D4 (Tb3+) luminescence life time values were measured
(monitored at 545 nm) and were found to be τ0 = 0.606 ms for compound 3 and 0.799 ms for
compound 6. Actually in both the instances a single exponential decay curve was found highlighting the presence of a single terbium emitting center. Even though there exists a less favourable Franck Condon overlap factor with the fourth vibrational overtone of the proximate OH oscillators (
υ
OH∼3300 to 3500 cm-1) to that of the Tb3+ emitting centre, the 5D4 lifetimevalues of Tb3+ complexes 3 and 6 are found to be essentially temperature dependent, with
τ
RADvarying by more than twice (Table 4) while going from 298 (Figure 15) to 77 K (Figure S27), thereby indicating the dominant contribution of a temperature-dependent vibrational quenching which is usually observed in the case of luminescent heterometallic transition metal-lanthanide based complexes[16h] Most probably, the non-radiative deactivation of the terbium emitting state
in the [ZnIITbIII] or [MgIITbIII] complex is dominated by an efficient back-energy transfer process
36
triplet state (ca. 22,575 cm-1) lies ca. 2075 cm-1 above the 5D4 level of terbium (20,500 cm-1),
while the same for complex 6 is found to be 1278 cm-1. Hence the low energy difference between
the ligand triplet and metal centered emissive excited states in complex 6 will trigger the rate of thermally activated back energy transfer and is evidenced from the nearly thrice enhanced decay profile at 77K for complex 6 (Table 4).
Figure 15. Phosphorescence decay of (a) complex 3 and (b) complex 6. The emission was
monitored at 545 nm (5D4 → 7F5) respectively in solid state at 298 K.
To quantify the ability of the ligands designed to sensitize the luminescence of lanthanides, and to draw conclusions concerning the relationship between the structure and the properties, it was appropriate to analyze the emission in terms of eq 1 (below) where Φoverall and ΦLn, represent
the ligand-sensitized andintrinsic luminescence quantum yields of Ln3+; Φsen represents the
37
efficiency of the ligand-to-metal energy transfer and
τ
obs/τ
RAD are the observed and the radiativelifetimes of Ln3+.[30]
Φoverall=Φsen×ΦLn=Φsen× (
τ
obs/τ
RAD) (1)The intrinsic quantum yield for Tb3+ (ΦTb) was estimated using eq 2 with the assumption that the
decay process at 77 K in a deuterated solvent is purely radiative.[31]
ΦTb=
τ
obs(298 K)/τ
obs(77 K) (2)Table 4 summarizes the Φoverall, ΦLn, and Φsen. In the case of terbium luminescence, solid-state
measurements gave an absolute quantum yield of 11.7 % for complex 3 compared with 22.7 % for complex 6. The closeness of the ligand triplet energy towards terbium emitting centre in complex 6 provide efficient energy transfer as evidenced from the impressive sensitization efficiency of 66.7 % which in turn give rise to a 22.7 % quantum yield when compared to complex 3, where the sensitization efficiency and quantum yields are is found to be 28% and 11.7%, respectively.
Conclusion
The efficacy of the ligand LH4 in synthesizing trinuclear heterometallic complexes allowed us to
synthesize a new series of isostructural complexes containing [Mg2Ln]3+ [Ln = Dy (1), Gd (2)
and Tb (3)] and [Zn2Ln]3+ [Ln = Dy (4), Gd (5) and Tb (6)] cores. Unlike the previous cases [8a, 8b], we have deliberately incorporated diamagnetic metal ions viz. Zn2+ and Mg2+ within the
cluster hoping to enhance the SMM properties by suppressing quantum tunnelling as well as increasing the energy gap between ground state and excited state. Complexes 1 and 4 show SMM behavior with the following parameters: Ueff =72(2) K with o = 8 x 10⁻⁹ s for the SR
38
process and Ueff = 61(2) K with o = 4 x 10⁻⁷ s for the FR process in complex 1, and Ueff = 67(3)
K with o = 4.5 x 10⁻⁸ s in complex 4. Ac susceptibility measurements on the magnetic diluted
samples of 1 and 4, named as 1' and 4', which were prepared through crystallization with the diamagnetic and isostructural Mg2Y and Zn2Y complexes using a Dy/Y molar ratio of 1:10,
clearly show that the relaxation dynamics is not due to intermolecular interactions and/or long range ordering and therefore has single molecular origin. Interestingly, the diluted compounds 1' and 4' exhibits SMM behavior under zero magnetic field and QTM at low temperature. The fit to a combination of activated and QTM relaxation processes afforded the following parameters: Ueff = 66(7) K with o = 1.7 x 10⁻⁸ s and QT = 0.0017(1) s. Ueff = 72(3) K with o = 1.2 x 10⁻⁸ s
and QT = 0.0004(2) s. The Ueff values are very close to that obtained for 1 and 4 under a static
magnetic field of 1000 Oe. After applying a small static field of 1000 Oe on 1' and 4', the QTM is almost suppressed due a combination of field and dilution effects and, as expected, the thermal energy barrier undergoes an slight increase with the concomitant decrease of o (Ueff = 90(7) K
and o = 1.1 x 10⁻⁹ for 1' and Ueff = 106(4) K and o = 5.2 x 10⁻¹⁰ for 4'. The results for the
diluted complexes clearly indicate that the relaxation of magnetization originates from the M-Dy-M unit rather than from intermolecular interactions and/or long-range ordering. Ab initio calculations, carried out on complexes 1 and 4, confirm that the magnetic anisotropy is uniaxial along the M-Dy-M unit and that the relaxation takes place through the first excited state via mainly a thermal assisted QTM process Additionally, the effectiveness of the ligand [LH3]2– to
act as "anteena" has discussed in details here. Both the TbIII based complexes display bright
green luminescence efficiency in the solid state with sensitization efficiency of 66.7 % for 6 but for 3 the sensitization efficiency is 28% due to poor matching of the triplet state of the ligand
39
with the emissive excited states of the metal ion. Thus, compound 6 may render as pledging candidate for use in various photonic applications.
Experimental Section
Reagents and General Procedures.Solvents and other general reagents used in this work were
purified according to standard procedures.[32] Mg(NO3)2·6H2O and 2-amino-2-
methylpropane-1,3-diol was obtained from S.D. Fine Chemicals, Mumbai, India. 2,6-Bis(hydroxymethyl)-4-methylphenol, Dy(NO3)3·5H2O, Tb(NO3)3·5H2O Gd(NO3)3·6H2O, Y(NO3)·6H2O and MnO2
were obtained from Sigma Aldrich Chemical Co. and were used as received.2-(2-Hydroxy-3-(hydroxymethyl)-5-methylbenzylideneamino)-2-methylpropane1,3-diol (LH4) was synthesized
by a procedure as reported earlier.[8b]
Instrumentation. Melting points were measured using a JSGW melting point apparatus and are
uncorrected. IR spectra were recorded as KBr pellets on a Bruker Vector 22 FT IR spectrophotometer operating at 400-4000 cm-1. Elemental analyses of the compounds were
obtained from Thermoquest CE instruments CHNS-O, EA/110 model. Electrospray ionization mass spectrometry (ESI-MS) spectra were recorded on a Micromass Quattro II triple quadrupole mass spectrometer.
Magnetic Properties: The variable temperature (2-300 K) magnetic susceptibility
measurements on a polycrystalline sample of 1 and 4 under an applied field of 1000 Oe were carried out with a Quantum Design SQUID MPMS XL-5 device. Ac susceptibility measurements under different applied static fields were performed using an oscillating ac field of 3.5 Oe and ac frequencies ranging from 10 to 1000 Hz. The experimental susceptibilities were corrected for the sample holder and diamagnetism of the constituent atoms by using Pascal’s
40
tables. A pellet of the sample cut into very small pieces was placed in the sample holder to prevent any torquing of the microcrystals.
Photophysical Characterization. The absorbance spectrum of the ligand and complexes were
measured on a Shimadzu, UV-2450 UV-vis-NIR spectrophotometer. The photoluminescence (PL) spectrum of the complexes were recorded on a Spex-Fluorolog FL22 spectrofluorimeter equipped with a double grating 0.22 m Spex 1680 monochromator and a 450 W Xe lamp as the excitation source and a Hamamatsu R928P photomultiplier tube detector. Emission and excitation spectra were corrected for source intensity (lamp and grating) by standard correction curves. The lifetime measurements were carried outat room temperature using a Spex 1040D phosphorimeter. Photoluminescence quantum yield of the powder sample as well as in the solution state were measured using a calibrated integrating sphere in a SPEX FluorologSpectrofluorimeter. A Xe-arc lamp was used to excite the sample placed in the sphere, with 365 nm as the excitation wavelength. Absolute quantum yield was calculated on the basis of the de Mello method[33] using the equation
ΦPL= [Ei(λ) − (1 − A)E0(λ)]/Le(λ)A (1)
In eq 2
A = [L0(λ) − Li(λ)]/L0(λ) (2)
Where Ei(λ) and E0(λ) are respectively the integrated luminescence as a result of direct excitation
of sample and secondary excitation. A is the absorbance of the sample calculated using eq 1. Li(λ) is the integrated excitation when the sample is directly excited, L0(λ) is the integrated
41
excitation when the excitation light first hits the sphere and reflects to the sample, and Le(λ) is
the integrated excitation profile for an empty sphere.
X-ray Crystallography. The crystal data for the compounds have been collected on a Bruker
SMART CCD diffractometer (MoKα radiation, λ = 0.71073 Å). The program SMART[34a] was
used for collecting frames of data, indexing reflections, and determining lattice parameters, SAINT[34a] for integration of the intensity of reflections and scaling, SADABS[34b] for absorption
correction, and SHELXTL[29c,d] for space group and structure determination and least-squares
refinements on F2. All the structures were solved by direct methods using the program
SHELXS-97[34e] and refined by full-matrix least-squares methods against F2 with SHELXL-97.[34e]
Hydrogen atoms were fixed at calculated positions and their positions were refined by a riding model. All non-hydrogen atoms were refined with anisotropic displacement parameters. The crystallographic figures have been generated using Diamond 3.1e software.[34f] The crystal data
and the cell parameters for compounds 1-6 are summarized in Table 5 and Table 6. The crystal data and the cell parameters for 1' and 4' are summarized in Table S9. CCDC-1020216 (for 1), CCDC-1020217 (for 2), CCDC-1020218 (for 3), CCDC-1020219 (for 4), CCDC-1020220 (for
5), CCDC-1020221 (for 6), CCDC-1040620 (for 1') and CCDC-1040621 (for 4') contain the
crystallographic data for the complexes reported in this paper. This data can be obtained free of
charge from the Cambridge Crystallographic Data Centre via
www.ccdc.cam.ac.uk/data_request/cif.
Table 5: Crystal data and structure refinement parameters for 1-3.
1 2 3 Formula C54H80DyMg2N7 O28 C108H160Gd2Mg4N14 O55 C108H164Mg4N14O57 Tb2 M/g 1486.37 2946.24 2985.61
42
Crystal system Monoclinic Monoclinic Monoclinic
Space group P21/n P21/n P21/n a/Å 14.912(5) 14.965(7) 14.913(5) b/Å 22.627(5) 22.945(11) 22.633(5) c/Å 20.411(5) 20.737(10) 20.453(5) β (°) 92.978(5) 93.529(9) 93.100(5) V/Å3 6878(3) 7107(6) 6893(3) Z 4 2 2 ρc/g cm-3 1.435 1.376 1.438 μ/mm-1 1.189 1.032 1.130 F(000) 3068 3040 3088 Cryst size (mm3) 0.055x0.042x 0.031 0.059x0.045x 0.025 0.068x0.042x 0.021 θ range (deg) 4.10 to 25.03 4.15 to 25.02 4.09 to 25.02 Limiting indices -15<=h<=17 -26<=k<=24 -24<=l<=19 -17<=h<=17 -25<=k<=27 -24<=l<=24 -13<=h<=17 -26<=k<=26 -24<=l<=24 Reflns collected 35644 51654 35761 Indreflns 12082 [R(int) = 0.0541] 12470 [R(int) = 0.0475] 12082 [R(int) = 0.0690] Completeness to θ (%) 99.4 % 99.3 % 99.2 %
Refinement method Full-matrix-block
least-squares on F2 Full-matrix-block least-squares on F2 Full-matrix-block least-squares on F2 Data/restraints/ parameters 12082 / 24 / 869 12470 / 66 / 866 12082 / 59 / 878 Goodness-of-fit on F2 1.055 1.161 1.030 Final R indices [I > 2θ(I)] R1 = 0.0796 wR2 = 0.2272 R1 = 0.0763 wR2 = 0.2085 R1 = 0.0920 wR2 = 0.2487
R indices (all data) R1 = 0.1097
wR2 = 0.2517
R1 = 0.0903
wR2 = 0.2179
R1 = 0.1322
wR2 = 0.2784
Largest diff. peak and hole(e ·Å-3)
43
Table 6: Crystal data and structure refinement parameters for 4-6.
4 5 6
Formula C108 H164Dy2N14
O57Zn4
C55H84GdN7O28Zn2 C108H160N14O55Tb2Zn4
M/g 3157.10 1579.28 3113.82
Crystal system Monoclinic Monoclinic Monoclinic
Space group P21/n P21/n P21/n a/Å 15.029(5) 15.030(5) 15.068(5) b/Å 22.431(5) 22.444(5) 22.488(5) c/Å 20.077(5) 20.107(5) 20.177(5) β (°) 92.961(5) 92.928(5) 93.039(5) V/Å3 6759(3) 6774(3) 6827(3) Z 2 4 2 ρc/g cm-3 1.551 1.549 1.438 μ/mm-1 1.885 1.757 1.515 F(000) 3236 3244 3192 Cryst size (mm3) 0.066 x 0.047 x 0.023 0.057 x 0.031 x 0.012 0.051 x 0.032 x 0.023 θ range (deg) 4.08 to 25.03 4.08 to 25.03 4.13 to 25.03 Limiting indices -17<=h<=17 -26<=k<=26 -23<=l<=23 -17<=h<=17 -26<=k<=26 -23<=l<=23 -17<=h<=10 -26<=k<=26 -24<=l<=23 Reflns collected 38515 38018 35090 Indreflns 11881 [R(int) = 0.0459] 11909 [R(int) = 0.0617] 11991 [R(int) = 0.0752] Completeness to θ (%) 99.5 99.5 99.5
Refinement method Full-matrix-block
least-squares on F2 Full-matrix-block least-squares on F2 Full-matrix-block least-squares on F2 Data/restraints/ parameters 11881 / 21 / 875 11909 / 21 / 875 11991 / 22 / 866 Goodness-of-fit on F2 1.126 1.084 1.024 Final R indices [I > 2θ(I)] R1 = 0.0900 wR2 = 0.2041 R1 = 0.0880 wR2 = 0.2105 R1 = 0.0873 wR2 = 0.2256
R indices (all data) R1 = 0.1162
wR2 = 0.2172
R1 = 0.1304
wR2 = 0.2297
R1 = 0.1357
wR2 = 0.2570
Largest diff. peak and hole(e ·Å-3)
44 Computational Details
Low energy spectra and g factors of the four lowest Kramer’s doublets of the two studied complexes were obtained by means of CASSCF+RASSI calculations, as implemented in the MOLCAS 7.8 software package.[24] The approach is divided in two steps: (i) CASSCF(7,9)
calculations for three different multiplicities (sextet, quartet and doublet) (ii) The effect of spin-orbit coupling on the basis of the converged wave functions obtained in the previous step is included by the Restricted Active Space State Interaction (RASSI) method. Spin Hamiltonian parameters (such as g factors) can be calculated from the wave functions resulting after the state interaction step employing the SINGLE_ANISO program. We included 21, 128 and 98 states for the sextet, quartet and doublet CASSCF calculations, while the employed basis set has the following contractions: Dy [9s8p6d4f3g2h]; Zn [4s3p2d1f]; O [4s3p2d1f]; N [4s3p2d1f]; C [3s2p]; H [2s]. The structure of the model was extracted from the corresponding X-ray structure without any ligand simplification. Electrostatic potential maps were obtained by B3LYP calculations as implemented in the Gaussian09[35] using a TZVP basis set and the geometry for
the ligand environment of the previous CASSCF+RASSI calculations and removing the central DyIII ion.
Synthesis
General Procedure for the Synthesis of 1-6
A general procedure was applied for the preparation of 1-6. To a solution of LH4 in methanol (30
mL), Ln(NO3)3·nH2O ( For 1, n = 5; 2, n = 6; 3, n = 5; 4, n = 5; 5, n = 6; 6, n = 5;) was added.
Then, triethylamine was added to the above solution and stirred it for 15 minutes. After that a methanolic solution of Mg(NO3)2·6H2O or Zn(NO3)2·6H2O was added drop wise, resulting in a
45
solution. This was filtered and the filtrate evaporated to dryness. The residue obtained was washed with diethyl ether, dried, dissolved in methanol/chloroform (1:1) and kept for crystallization under vapour diffusion conditions. After 4-7 days, pure crystalline products suitable for X-ray diffraction were isolated. Specific details of each reaction and the characterization data of the products obtained are given below.
[Mg2Dy(LH3)4]·3NO3·2MeOH·1H2O (1)
Quantities: Mg(NO3)2·6H2O (0.036 g, 0.14 mmol), Dy(NO3)3·5H2O (0.03 g, 0.07 mmol), LH4
(0.08 g, 0.29 mmol) and Et3N (0.06 ml, 0.59 mmol). Yield: 0.072 g, 69% (based on Dy). Mp:
>260°C.IR (KBr) cm–1: 3208 (b), 2929 (w), 2881 (w), 1637 (s), 1569 (s), 1456 (s), 1384 (s), 1294
(s), 1269 (s), 1172 (w), 1038 (s), 999 (w), 973 (w), 819 (s).ESI-MS m/z, ion: 406.79, [C52H72N4O16Mg2Dy]3+. Anal. Calcd. for C54H82DyMg2N7O28 (1488.42): C, 43.58; H, 5.55; N,
6.59. Found: C, 43.68; H, 5.29; N, 6.89.
[Mg2Gd(LH3)4]·3NO3·2MeOH·0.5H2O (2)
Quantities: Mg(NO3)2·6H2O (0.036 g, 0.14 mmol), Gd(NO3)3·6H2O (0.03 g, 0.07 mmol), LH4
(0.08 g, 0.29 mmol) and Et3N (0.06 ml, 0.59 mmol). Yield: 0.066 g, 64% (based on Gd). Mp:
>260°C.IR (KBr) cm–1: 3207 (b), 2927 (w), 2880 (w), 1638 (s), 1568 (s), 1456 (s), 1384 (s), 1295 (s), 1270 (s), 1173 (w), 1036 (s), 998 (w), 976 (w), 819 (s).ESI-MS m/z, ion: 404.78, [C52H72N4O16Mg2Gd]3+. Anal. Calcd. for C54H81N7O27.5Mg2Gd(1473.40): C, 44.00; H, 5.54; N,
6.65. Found: C, 44.21; H, 5.42; N, 6.83.
[Mg2Tb(LH3)4]·3NO3·2MeOH·1.5H2O (3)
Quantities: Mg(NO3)2·6H2O (0.036 g, 0.14 mmol), Tb(NO3)3·5H2O (0.03 g, 0.07 mmol), LH4
46
>260°C. IR (KBr) cm–1: 3208 (b), 2927 (w), 2883 (w), 1638 (s), 1568 (s), 1456 (s), 1385 (s),
1299 (s), 1271 (s), 1169 (w), 1037 (s), 999 (w), 973 (w), 819 (s).ESI-MS m/z, ion: 405.11, [C52H72N4O16Mg2Tb]3+. Anal. Calcd. for C54H83N7O28.5Mg2Tb(1492.42): C, 43.42; H, 5.60; N,
6.56. Found: C, 43.31; H, 5.59; N, 6.62.
[Zn2Dy(LH3)4]·3NO3·2MeOH·1.5H2O (4)
Quantities: Zn(NO3)2·6H2O (0.042 g, 0.14 mmol), Dy(NO3)3·5H2O (0.03 g, 0.07 mmol), LH4
(0.08 g, 0.29 mmol) and Et3N (0.06 ml, 0.59 mmol). Yield: 0.075 g, 67.82 % (based on Dy). Mp:
>260°C. IR (KBr) cm–1: 3225 (b), 2924 (w), 2882 (w), 1635 (s), 1567 (s), 1455 (s), 1384 (s),
1293 (s), 1223 (s), 1170 (w), 1048 (s), 998 (w), 974 (w), 819 (w), 794 (w).ESI-MS m/z, ion: 435.09, [C52H72N4O16Zn2Dy]3+. Anal. Calcd .for C54H83DyN7O28.5Zn2 (1579.58): C, 41.06; H,
5.30; N, 6.21. Found: C, 41.15; H, 5.25; N, 6.35.
[Zn2Gd(LH3)4]·3NO3·3MeOH (5)
Quantities: Zn(NO3)2·6H2O (0.042 g, 0.14 mmol), Gd(NO3)3·6H2O (0.03 g, 0.07 mmol), LH4
(0.08 g, 0.29 mmol) and Et3N (0.06 ml, 0.59 mmol). Yield: 0.078 g, 70.55 % (based on Gd). Mp:
>260°C. IR (KBr) cm–1: 3226 (b), 2925 (w), 2880 (w), 1635 (s), 1567 (s), 1455 (s), 1383 (s), 1295 (s), 1220 (s), 1173 (w), 1047 (s), 999 (w), 974 (w), 819 (w), 795 (w).ESI-MS m/z, ion: 433.09, [C52H72N4O16Zn2Gd]3+. Anal. Calcd. for C55H84GdN7O28Zn2 (1579.28): C, 41.83; H,
5.36; N, 6.21. Found: C, 41.90; H, 5.51; N, 6.32.
[Zn2Tb(LH3)4]·3NO3·2MeOH·0.5H2O (6)
Quantities: Zn(NO3)2·6H2O (0.042 g, 0.14 mmol), Tb(NO3)3·5H2O (0.03 g, 0.07 mmol), LH4
(0.08 g, 0.29 mmol) and Et3N (0.06 ml, 0.59 mmol). Yield: 0.071 g, 65.10 % (based on Tb). Mp:
>260°C. IR (KBr) cm–1: 3220 (b), 2922 (w), 2881 (w), 1635 (s), 1568 (s), 1456 (s), 1383 (s), 1291 (s), 1221 (s), 1169 (w), 1045 (s), 998 (w), 971 (w), 819 (w), 796 (w).ESI-MS m/z, ion:
47
434.09, [C52H72N4O16Zn2Tb]3+. Anal. Calcd. for C54H81N7O27.5TbZn2 (1557.99): C, 41.63; H,
5.24; N, 6.29. Found: C, 41.71; H, 5.15; N, 6.45.
Procedure for the Synthesis of 1' and 4'
This diluted complexes were prepared by following the same method as that for 1-6 but here we have used 0.007 mmol of Dy(NO3)3·5H2O and 0.063 mmol of Y(NO3)3·6H2O instead of 0.07
mmol of Dy(NO3)3·5H2O. As a crystallization solvent here we have used Methanol/Acetonitrile
mixture. Specific details of each reaction and the characterization data of the products obtained are given below.
[Mg2Dy0.14Y0.86(LH3)4]·3NO3·2MeOH·CH3CN (1')
Quantities: Mg(NO3)2·6H2O (0.036 g, 0.14 mmol), Dy(NO3)3·5H2O (0.003 g, 0.007 mmol),
Y(NO3)3·6H2O (0.0241g, 0.063 mmol), LH4 (0.08 g, 0.29 mmol) and Et3N (0.06 ml, 0.59 mmol).
Yield: 0.076 g, 75% (based on Mg). Mp: >260°C. IR (KBr) cm–1: 3210 (b), 2931 (w), 2880 (w), 1635 (s), 1566 (s), 1455 (s), 1384 (s), 1298 (s), 1271 (s), 1173 (w), 1035 (s), 998 (w), 974 (w), 819 (s). Anal. Calcd. for C56H83Dy0.14Mg2N8O27Y0.86 (1448.08): C, 46.44; H, 5.77; N, 7.73.
Found: C, 46.63; H, 5.84; N, 7.79.
[Zn2Dy0.1Y0.9(LH3)4]·3NO3·2MeOH·2H2O·CH3CN (4')
Quantities: Zn(NO3)2·6H2O (0.042 g, 0.14 mmol), Dy(NO3)3·5H2O (0.003 g, 0.007 mmol),
Y(NO3)3·6H2O (0.0241g, 0.063 mmol), LH4 (0.08 g, 0.29 mmol) and Et3N (0.06 ml, 0.59 mmol).
Yield: 0.071 g, 64.88 % (based on Zn). Mp: >260°C. IR (KBr) cm–1: 3222 (b), 2926 (w), 2879 (w), 1632 (s), 1568 (s), 1451 (s), 1386 (s), 1289 (s), 1224 (s), 1173 (w), 1049 (s), 999 (w), 974 (w), 819 (w), 795 (w). Anal. Calcd .for C56H87Dy0.10N8O29Y0.90Zn2 (1563.29): C, 43.02; H,