1
UNIVERSITY OF FOGGIA
P
H.D.
“I
NNOVATION ANDM
ANAGEMENT OFH
EALTHYF
OOD”
(XXIX CYCLE)
C
OORDINATOR:
PROF.
F
RANCESCOC
ONTÒAnalysis of Socio-Economic and Environmental Sustainability of
Barley Supply Chain: a Healthy Crop for Human Nutrition
Ph.D. candidate:
Emilia Lamonaca
Tutor:Prof. Caterina Tricase
Co-tutor:Prof. Francesco Contò
2
CONTENTS
ABSTRACT ... 11
INTRODUCTION ... 12
1. Chapter 1 BARLEY ... 15
1.1. Botanical and agronomic characteristics of barley ... 15
1.2. Crop management ... 19
1.2.1. Tillage practices ... 19
1.2.2. Weeds and Weed Control ... 19
1.2.3. Fertility ... 19
1.2.4. Water management ... 20
1.2.5. Harvest ... 20
1.3. An overview of grain sector from a market perspective ... 20
1.3.1. The trend of barley market ... 21
1.3.1.1. International market of barley ... 21
1.3.1.2. European market of barley ... 23
1.3.1.3. Italian market of barley ... 25
1 1..33..11..33..11. . MMaarrkkeettooffbbaarrlleeyyiinnAAppuulliiaarreeggiioon ... 26 n 1.3.2. Barley supply chain in Italy ... 26
1.4. Intended uses of barley ... 28
1.4.1. Barley for feed ... 29
1.4.2. Barley for malt ... 29
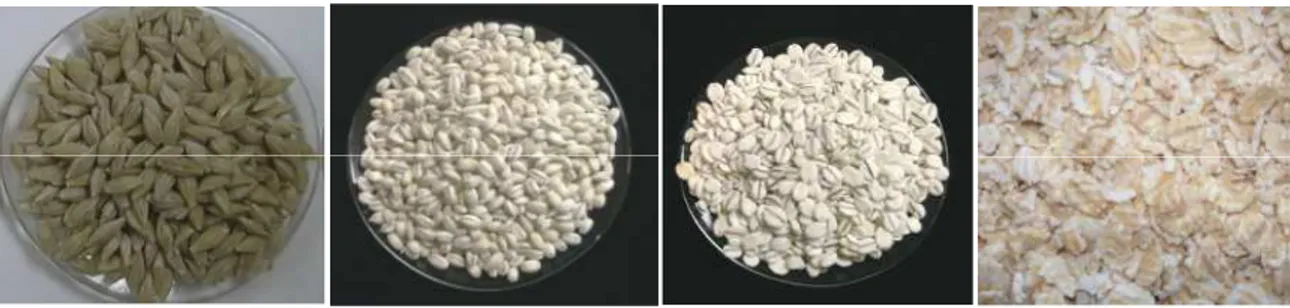
1.4.3. Barley for food... 30
1.4.3.1. Health benefits of barley food ... 31
2. Chapter 2 METHODOLOGICAL APPROACH ... 32
2.1. Combination of Uniform and shifted Binomial variables models ... 32
2.2. Life Cycle Assessment ... 34
2.2.1. General definition ... 34
2.2.2. LCA phases ... 34
2.2.3. Characterization model: Impact 2002+ ... 36
2.2.4. LCA in agricultural researches ... 38
3. Chapter 3 RESULTS AND DISCUSSION ... 40
3.1. CUB models for the analysis of consumers’ perception ... 40
3.1.1. Research design ... 40
3.1.2. Description of the sample ... 41
3
3.1.4. Analysis of consumers’ food purchasing decisions ... 42
3.1.4.1. CUB models without covariates ... 42
3.1.4.2. CUB model with socio-demographic variables as covariates ... 44
3.1.5. Analysis of consumers’ perception about quality of organic food ... 45
3.1.5.1. CUB models without covariates ... 45
3.1.5.2. CUB models with socio-demographic variables as covariates ... 47
3.1.5.3. CUB models with drivers of purchasing decisions as covariates ... 48
3.2. LCA of barley supply chain ... 50
3.2.1. Goal and scope definition ... 50
3.2.1.1. Functional Units ... 50
3.2.1.2. System boundaries ... 50
3.2.1.3. Allocation procedure ... 52
3.2.2. LCI ... 55
3.2.2.1. Data collection and modeling ... 55
3.2.2.2. Calculation of N-based emissions from fertilization ... 56
3.2.3. LCIA and interpretation ... 60
3.2.3.1. Comparison between organic and conventional barley cultivation ... 60
3.2.3.2. Organic barley cultivation ... 65
3.2.3.3. Conventional barley cultivation ... 76
CONCLUSIONS ... 87
REFERENCES ... 89
APPENDIX ... 97
I. CUB models ... 97
i. Questionnaire ... 97
II. Life Cycle Assessment ... 101
i. Comparison between organic and conventional barley cultivation ... 101
ii. Organic barley cultivation... 105
iii. Conventional barley cultivation ... 113
III. Nomenclature ... 121
4
LIST OF FIGURES
Figure 1. Research framework... 14
Figure 2. Hordeum vulgare L. ... 16
Figure 3. Barley grain and cross section. ... 17
Figure 4. Percentage al location of energy in barley grain. ... 18
Figure 5. The relevance of Italian grain sector. ... 21
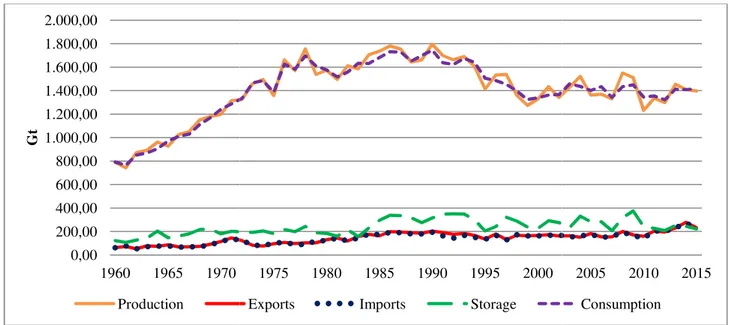
Figure 6. Global trend of market fundamentals of barley during the period 1960-2015. ... 21
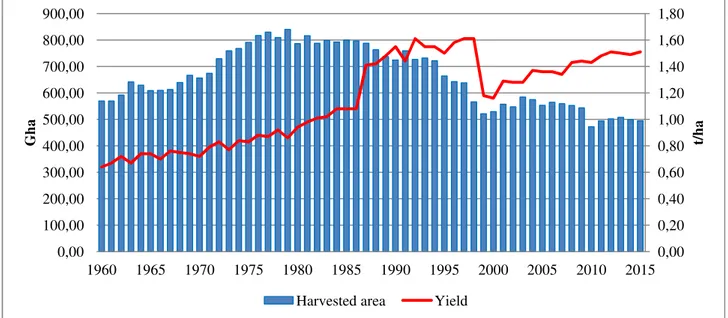
Figure 7. Global harvested area and yields of barley during the period 1960-2015. ... 22
Figure 8. Leading world producers of barley in 2015. ... 23
Figure 9. European trend of market fundamentals of barley during the period 1960-2015. ... 23
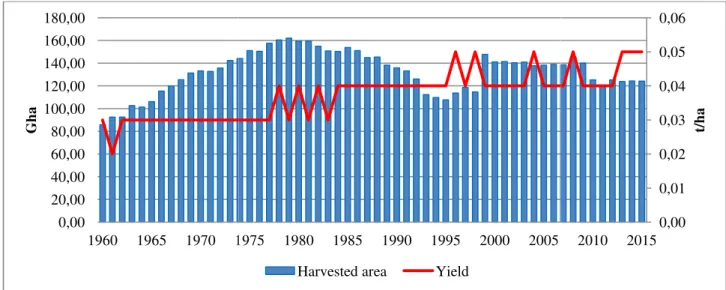
Figure 10. European harvested area and yields of barley during the period 1960-2015. ... 24
Figure 11. Leading European producers of barley in 2013. ... 24
Figure 12. Italian production of barley, classified by geographical area, during the period 2000-2013. ... 25
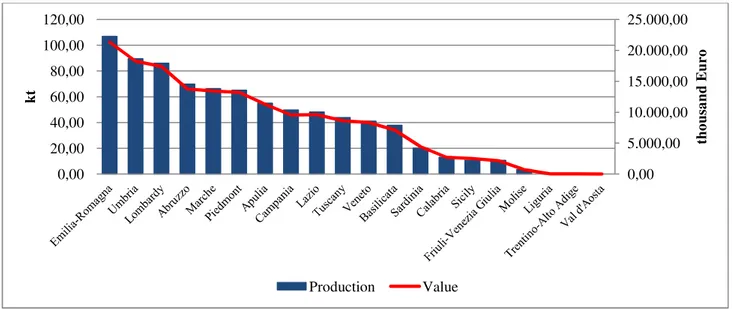
Figure 13. Italian produced quantity and value of production of barley in 2013. ... 25
Figure 14. Apulian area intended to barley cultivation and produced quantity of barley during the period 2008-2012. ... 26
Figure 15. Quantitative flows along barley supply chain. ... 27
Figure 16. The main stakeholders of barley supply chain. ... 28
Figure 17. Intended uses of barley world production in 2011. ... 29
Figure 18. Whole grain, pearled grain, rolled grain, and flake of barley. ... 30
Figure 19. Trend of barley for food use during the period 1961-2011. ... 30
Figure 20. LCA phases ... 35
Figure 21. Impact categories and pathways covered by the IMPACT 2002+ methodology ... 37
Figure 22. Representation in the parametric space of estimated feeling and uncertainty for groups of items related to Food purchasing decisions (left panel) and to Perception about organic food’s quality (right panel). ... 43
Figure 23. Estimated CUB distributions for groups of items related to Food purchasing decisions (upper panel) and to Perception about organic food’s quality (lower panel), with significant effect of covariate gender (solid line = males; dashed line = female). ... 45
Figure 24. Representation in the parametric space of estimated feeling and uncertainty for items related to consumers’ perception about quality of organic food. ... 46
Figure 25. Estimated CUB distributions for groups of items related to Food purchasing decisions (upper panel) and to Perception about organic food’s quality (lower panel), with significant effect of covariate gender (solid line = males; dashed line = female). ... 48
5
Figure 26. Estimated CUB distributions for items related to Perception about organic food’s quality†, with
items related to Food purchasing decisions†† as covariates, considering two levels of assumed importance for
covariates (solid line = low importance, dashed line = high importance). ... 49 Figure 27. System boundary for organic and conventional barley production. ... 52 Figure 28. Process of economic allocation between barley products. ... 54 Figure 29. Comparison between organic and conventional barley cultivation processes (with reference to 1 ha FU) and related caused-damages (weighing points). ... 61 Figure 30. Comparison between organic and conventional barley cultivation processes (with reference to 1 kg FU) and related caused-damages (weighing points). ... 61 Figure 31. Comparison between organic and conventional barley cultivation processes (with reference to 1ha FU) and related caused-impacts (weighing points). ... 63 Figure 32. Comparison between organic and conventional barley cultivation processes (with reference to 1kg FU) and related caused-impacts (weighing points). ... 63 Figure 33. Characterization per impact category for organic barley cultivation processes (with reference to 1ha FU). ... 66 Figure 34. Characterization per impact category for organic barley cultivation processes (with reference to 1kg FU). ... 66 Figure 35. Weighing evaluation per damage category for organic barley cultivation processes (with reference to 1ha FU). ... 69 Figure 36. Weighing evaluation per damage category for organic barley cultivation processes (with reference to 1kg FU)... 69 Figure 37. Weighing evaluation per impact category for organic barley cultivation processes (with reference to 1ha FU). ... 72 Figure 38. Weighing evaluation per impact category for organic barley cultivation processes (with reference to 1kg FU)... 72 Figure 39. Damages flows for organic barley cultivation process (with reference to 1ha FU). ... 75 Figure 40. Damages flows for organic barley cultivation process (with reference to 1kg FU). ... 75 Figure 41. Characterization per impact category for conventional barley cultivation processes (with reference to 1ha FU). ... 77 Figure 42. Characterization per impact category for conventional barley cultivation processes (with reference to 1kg FU)... 77 Figure 43. Weighing evaluation per damage category for conventional barley cultivation processes (with reference to 1ha FU). ... 80 Figure 44. Weighing evaluation per damage category for conventional barley cultivation processes (with reference to 1kg FU). ... 80 Figure 45. Weighing evaluation per impact category for conventional barley cultivation processes (with reference to 1ha FU). ... 83 Figure 46. Weighing evaluation per impact category for conventional barley cultivation processes (with reference to 1kg FU). ... 83
6
Figure 47. Damages flows for conventional barley cultivation process (with reference to 1ha FU). ... 86 Figure 48. Damages flows for conventional barley cultivation process (with reference to 1kg FU). ... 86 Figure 49. Comparison between organic and conventional barley cultivation processes (with reference to 1ha FU) and related caused-damages (weight points). ... 101 Figure 50. Comparison between organic and conventional barley cultivation processes (with reference to 1kg FU) and related caused-damages (weight points). ... 101 Figure 51. Comparison between organic and conventional barley cultivation processes (with reference to 1ha FU) and normalization of related caused-damages. ... 102 Figure 52. Comparison between organic and conventional barley cultivation processes (with reference to 1kg FU) and normalization of related caused-damages. ... 102 Figure 53. Comparison between organic and conventional barley cultivation processes (with reference to 1ha FU) and related caused-impacts (weight points). ... 103 Figure 54. Comparison between organic and conventional barley cultivation processes (with reference to 1kg FU) and related caused-impacts (weight points). ... 103 Figure 55. Comparison between organic and conventional barley cultivation processes (with reference to 1ha FU) and normalization of related caused-impacts. ... 104 Figure 56. Comparison between organic and conventional barley cultivation processes (with reference to 1kg FU) and normalization of related caused-impacts. ... 104 Figure 57. Percentage contribution of organic barley cultivation processes on each damage category (with reference to 1ha FU). ... 105 Figure 58. Percentage contribution of organic barley cultivation processes on each damage category (with reference to 1kg FU). ... 105 Figure 59. Percentage contribution of organic barley cultivation processes on each impact category (with reference to 1ha FU). ... 106 Figure 60. Percentage contribution of organic barley cultivation processes on each impact category (with reference to 1kg FU). ... 106 Figure 61. Weight evaluation per damage category for organic barley cultivation process (with reference to 1ha FU). ... 107 Figure 62. Weight evaluation per damage category for organic barley cultivation process (with reference to 1kg FU). ... 107 Figure 63. Normalization of damage categories for organic barley cultivation process (with reference to 1ha FU). ... 108 Figure 64. Normalization of damage categories for organic barley cultivation process (with reference to 1kg FU). ... 108 Figure 65. Weight evaluation per impact category for organic barley cultivation process (with reference to 1ha FU). ... 109 Figure 66. Weight evaluation per impact category for organic barley cultivation process (with reference to 1kg FU). ... 110
7
Figure 67. Normalization of impact categories for organic barley cultivation process (with reference to 1ha FU). ... 111 Figure 68. Normalization of impact categories for organic barley cultivation process (with reference to 1kg FU). ... 112 Figure 69. Percentage contribution of conventional barley cultivation processes on each damage category (with reference to 1ha FU)... 113 Figure 70. Percentage contribution of conventional barley cultivation processes on each damage category (with reference to 1kg FU). ... 113 Figure 71. Percentage contribution of conventional barley cultivation processes on each impact category (with reference to 1ha FU)... 114 Figure 72. Percentage contribution of conventional barley cultivation processes on each impact category (with reference to 1kg FU). ... 114 Figure 73. Weight evaluation per damage category for conventional barley cultivation process (with reference to 1ha FU). ... 115 Figure 74. Weight evaluation per damage category for conventional barley cultivation process (with reference to 1kg FU). ... 115 Figure 75. Normalization of damage categories for conventional barley cultivation process (with reference to 1ha FU). ... 116 Figure 76. Normalization of damage categories for conventional barley cultivation process (with reference to 1kg FU). ... 116 Figure 77. Weight evaluation per impact category for conventional barley cultivation process (with reference to 1ha FU). ... 117 Figure 78. Weight evaluation per impact category for conventional barley cultivation process (with reference to 1kg FU)... 118 Figure 79. Normalization of impact categories for conventional barley cultivation process (with reference to 1ha FU). ... 119 Figure 80. Normalization of impact categories for conventional barley cultivation process (with reference to 1kg FU). ... 120
8
LIST OF TABLES
Table 1. Classification report of barley. ... 15
Table 2. Chemical composition and energy value for 100g of edible barley grain. ... 18
Table 3. Compounds with biological activity in barley caryopsis ... 31
Table 4. Questionnaire items, source of adoption, and descriptive statistics. ... 40
Table 5. Socio-demographic characteristics of the sample. ... 41
Table 6. Estimated CUB(0,0) models parameters for groups of items. ... 43
Table 7. Results from estimated CUB(1,0) and CUB(0,1) models parameters for groups of items. ... 44
Table 8. Estimated CUB(0,1) models parameters for groups of items, with significant covariates. ... 44
Table 9. Estimated CUB(0,0) models parameters for items related to consumers’ perception about quality of organic food. ... 46
Table 10. Results from estimated CUB(1,0) and CUB(0,1) models parameters for items related to consumers’ perception about quality of organic food, with socio-demographic variables as covariates. ... 47
Table 11. Estimated CUB(0,1) models parameters for items related to consumers’ perception about quality of organic food, with significant covariates†. ... 47
Table 12. Estimated CUB(0,1) models parameters for items related to consumers’ perception about quality of organic food, with items related to food purchasing decisions as covariates†. ... 48
Table 13. Main input inventory-data related to the production of organic and conventional barley, using different F.U. ... 57
Table 14. Damages assessment and weighing, evaluated by Impact 2002+. ... 62
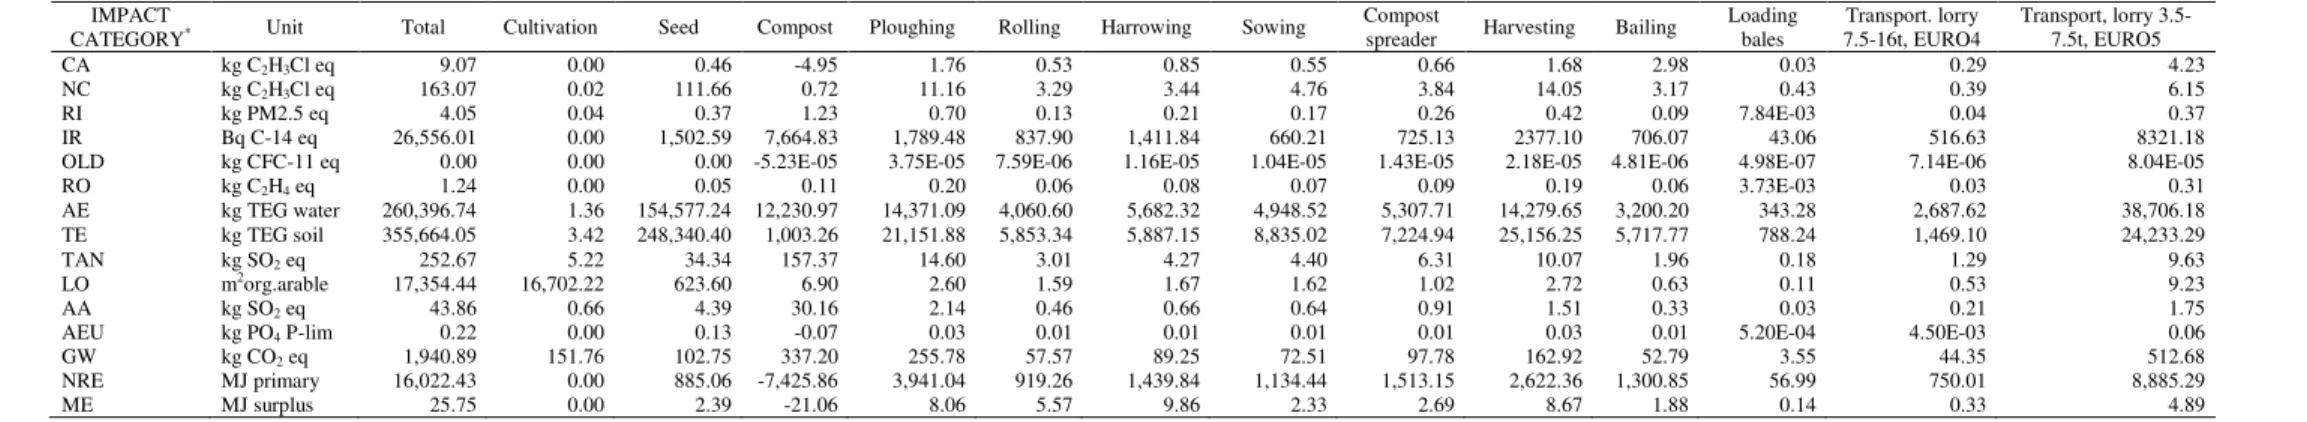
Table 15. Characterisation and weighing, evaluated by Impact 2002+. ... 64
Table 16. Most impacting resources and substances referring to organic and conventional barley cultivation, classified by damage categories. ... 64
Table 17. Characterization per impact category for organic barley cultivation processes (with reference to 1ha FU). ... 67
Table 18. Characterization per impact category for organic barley cultivation processes (with reference to 1kg FU). ... 67
Table 19. Damages assessment for organic barley cultivation process (with reference to 1ha and 1kg FUs). 70 Table 20. Weighing evaluation per damage category for organic barley cultivation process (with reference to 1ha and 1kg FUs). ... 70
Table 21. Impacts assessment for organic barley cultivation process (with reference to 1ha FU). ... 73
Table 22. Impacts assessment for organic barley cultivation process (with reference to 1kg FU). ... 73
Table 23. Weighing evaluation per impact category for organic barley cultivation process (with reference to 1ha FU). ... 74
Table 24. Weighing evaluation per impact category for organic barley cultivation process (with reference to 1kg FU). ... 74
9
Table 25. Characterization per impact category for conventional barley cultivation processes (with reference to 1ha FU). ... 78 Table 26. Characterization per impact category for conventional barley cultivation processes (with reference to 1kg FU)... 78 Table 27. Damages assessment for conventional barley cultivation process (with reference to 1ha and 1kg FUs). ... 81 Table 28. Weighing evaluation per damage category for conventional barley cultivation process (with reference to 1ha and 1kg FUs). ... 81 Table 29. Impacts assessment for conventional barley cultivation process (with reference to 1ha FU). ... 84 Table 30. Impacts assessment for conventional barley cultivation process (with reference to 1kg FU). ... 84 Table 31. Weighing evaluation per impact category for conventional barley cultivation process (with reference to 1ha FU). ... 85 Table 32. Weighing evaluation per impact category for conventional barley cultivation process (with reference to 1kg FU). ... 85 Table 33. Weight evaluation per damage category for organic and conventional barley cultivation processes (with reference to 1ha and 1kg FUs). ... 101 Table 34. Normalization of damage categories for organic and conventional barley cultivation processes (with reference to 1ha and 1kg FUs). ... 102 Table 35. Weight evaluation per impact category for organic and conventional barley cultivation processes (with reference to 1ha and 1kg FUs). ... 103 Table 36. Normalization of impact categories for organic and conventional barley cultivation processes (with reference to 1ha and 1kg FUs). ... 104 Table 37. Weight evaluation per damage category for organic barley cultivation process (with reference to 1ha and 1kg FUs). ... 107 Table 38. Normalization of damage categories for organic barley cultivation process (with reference to 1ha and 1kg FUs). ... 108 Table 39. Weight evaluation per impact category for organic barley cultivation process (with reference to 1ha FU). ... 109 Table 40. Weight evaluation per impact category for organic barley cultivation process (with reference to 1kg FU). ... 110 Table 41. Normalization of impact categories for organic barley cultivation process (with reference to 1ha FU). ... 111 Table 42. Normalization of impact categories for organic barley cultivation process (with reference to 1kg FU). ... 112 Table 43. Weight evaluation per damage category for conventional barley cultivation process (with reference to 1ha and 1kg FUs). ... 115 Table 44. Normalization of damage categories for conventional barley cultivation process (with reference to 1ha and 1kg FUs). ... 116
10
Table 45. Weight evaluation per impact category for conventional barley cultivation process (with reference to 1ha FU). ... 117 Table 46. Weight evaluation per impact category for conventional barley cultivation process (with reference to 1kg FU)... 118 Table 47. Normalization of impact categories for conventional barley cultivation process (with reference to 1ha FU). ... 119 Table 48. Normalization of impact categories for conventional barley cultivation process (with reference to 1kg FU). ... 120
11
ABSTRACT
The scope of the research is to provide evidences about the benefits, in terms of healthiness, environmental sustainability, and productive efficiency, related to barley (Hordeum vulgare L.), a widespread crop in the Apulia region (italy). Seeking to pursue this general goal, the aim of the research is twofold: (i) investigating consumers’ perception about quality of organic food, in terms of sustainability and healthiness, and analyzing how and to what extent perceived quality of organic food is influenced by the presence of information related to quality on food products’ label, and consumers’ socio-demographic profile; (ii) comparing organic and conventional cultivation of barley, under favorable pedo-climatic conditions, to evaluate the potential environmental impacts related to the cultivation of barley and to identify the most suitable solution in terms of environmental sustainability and productive efficiency.
An approach based on Combination of Uniform and shifted Binomial random variables, named CUB model, was performed to analyze consumers’ preference in terms of two latent components, feeling and uncertainty. A Life Cycle Assessment (LCA) was performed alternatively using, as Functional Units (FUs), 1 ha of land involved in cultivation of barley to seek environmental sustainability and 1 kg of dry matter grains of produced barley to check productive efficiency.
Findings from CUB models highlight that the presence of specific information on food’s label (e.g. environmental label, organic certification, healthy claims) contributes to perceive organic food as food of superior quality. Results also underline how consumers’ socio-demographic profile plays a significant role in driving food purchasing decision mechanism.
Findings from comparative LCA show that organic barley cultivation is the most environmentally sustainable solution (but not efficient in production), vice versa conventional barley cultivation is the solution most efficient in production (but not environmentally sustainable). Efficiency in production and environmental sustainability may be balanced with methodological assumptions (choice of functional unit, allocation procedure) and qualitative elements (crop quality and adaptiveness to specific pedo-climatic conditions). A land-based FU is preferred in the analysis of the agricultural stage, while a mass-based FU is suitable for the assessment of a wider context, such as the entire supply chain.
The research seeks to fill the lack, existing in economic literature, about barley crop, which is a potential strength for Apulian farms, thanks to its sustainability and healthiness properties.
12
INTRODUCTION
During last decades, the focus of international and European challenges is on increasing attention to food safety and security and on growing concerns towards socio-economic and environmental changes. To cope with these challenges, food production and consumption should combine health and environmental perspectives (Lazzarini et al., 2016). Responsible production and consumption of food have become a mainstream topic (Yadav and Pathak, 2016; Dowd and Burke, 2013), because they address both health and environmental issues (Aschemann-Witzel et al., 2013): responsible production and consumption allow to achieve welfare of human beings (Yadav and Pathak, 2016) and environmental sustainability (UN, 2010). The steadily growing population shows an upward demand for food that puts high pressure on land and on inputs production. Agri-food sector contributes to human health and prosperity, but it is also responsible of great impacts (Lazzarini et al., 2016; van der Werf et al., 2014), and it is involved in complex socio-economic and environmental linkages (Arianfar and Sardarodiyan, 2016). Production and consumption of agri-food products are the cause of several problems for health and environment, such as for instance climate changes, resources depletion, and unhealthy diets (González-García et al., 2016; Lazzarini et al., 2016). An important challenge for decision-makers should be understanding the way to reduce these problems (Masuda, 2016; Korsaeth et al., 2012). It is established opinion that food production must come from a more sustainable agriculture, which may combine promotion of quality for consumers with protection of environmental resources (Lamonaca et al., 2016; Tricase et al., 2016; Meier et al., 2015). To this end the effort of agri-food sector should be to ensure a quality enhancement in products supply, in order to encourage customers confidence in supply chains and to support sustainability in production processes. All these goals should be oriented towards the logic of doing more and better with less, to achieve socio-economic and environmental quality and efficiency (Vassallo et al., 2016). Adopting organic farming is a way to reduce environmental impacts, to support more sustainable agricultural practices, and to obtain food products of higher quality (Lamonaca et al., 2016; Tricase et al., 2016; Meier et al., 2015).
At the same time, consumers tend to pay an ever increasing attention towards the relationship between nutrition and health (Mollet and Rowland, 2002; Young, 2000). The reasons of this tendency are mostly due to health scares, personalization of eating habits, as well as to demographic trends and socio-economic changes. Because consumers are even more conscious that food may contributes to improve psychophysical well-being (Menrad, 2003; Roberfroid, 2000a), they tend to consume healthy food (Kotilainen et al., 2006; Roberfroid, 2000a,b). Changes in food preferences and environmental awareness highlight the needs to improve a better assessment of impacts, risks, and opportunity of food production and consumption, through life cycle approach.
It is in this context that consumers increasingly appreciate functional food. The concept of functional food was firstly introduced in Japan in the Eighties with reference to food developed specifically to promote health or reduce the risk of illness. According to the definition given at European level by the European Commission Concerted Action on Functional Food Science in Europe (FUFOSE), a food can be considered functional if it is demonstrated satisfactorily that it is able to affect in a positive way one or more functions of body in a way that is relevant and to improve health and well-being and/or reduce the risk of disease (Doyon and Labrecque, 2008; EUFIC, 2006). There are different types of functional foods and diverse approaches to obtain them: a functional food can be a natural food, in which specific components can be introduced or implemented through specific farming practices and processing (e.g. food grains, cereals, wholemeal flours, etc.) or it can be a food that has been processed using different technological, chemical or biological systems. The suitable technological approach for the development of functional food is to increase natural and wholemeal or “traditional evolved” products in a way that respects raw materials, food, needs,
13
and preferences of the consumer (Sirò et al., 2008). Among different way to obtain functional foods, cereals, that widely and frequently come in our diet and meet consumer’s favor, are ideal to be used in transmitting compounds and substances with bioactive and dietary properties. In particular, barley (Hordeum vulgare L.) represents a valuable source of production of functional foods thanks to its characteristics (Sullivan et al., 2013; Baik and Ullrich, 2008). It deserves a particular attention and has a high potential from multiple points of views.
From an economic perspective, barley is the fourth most-produced crop in the world today, it is readily available in the world and is relatively inexpensive compared with other grain. Barley involves a huge amount of resources and people working in agricultural stage for its cultivation; transportation and trade of barley grains and related products, co-products, and by-products; processing, transportation, marketing, and consumption of barley products, as well as, research and development to improve production and use of barley (Ullrich, 2011).
From a social point of view, barley has a long history of cultivation and consumption in human and animal food, feed, and nutrition; alcoholic beverage production and consumption; and in the continuing development of the biological sciences (Baik et al., 2011; Ullrich, 2011). Over the time, the preponderant use of barley for feed and for brewing and distilling have de-emphasized its uses for food, because of cultural eating habits and lower preferences for barley compared to other grain. But nowadays the increasing awareness of human health benefits of consuming barley have boosted the attempts of food and crop scientists, barley industry, and food processors in an improvement of the food use of barley (Baik et al., 2011). The valuable qualitative and nutritional features of barley make it a crop of niche for the functional food market.
From an environmental perspective, thanks to barley adaptability to diverse pedo-climatic conditions, it is a high self-sustainable crop: barley can be produced at higher latitudes and altitudes and further into marginal areas, due to its reduced water necessities and its short life; it can be cultivated in all kinds of farm and constant yields are obtained even in unfavorable areas (Ingvordsen et al., 2015; Lamonaca and Tricase, 2015; Marinaccio et al., 2015; Francia et al. 2011).
These considerations have pioneered the framework of this research. The scope of this research is to provide evidence about the possible strengths, in terms of healthiness and environmental sustainability and efficiency, related to barley, a widespread crop in Apulia region (Italy).
Seeking to pursue this general goal, the research consists of two phases. The first step concerns the analysis of Italian consumers’ perception of healthiness and sustainability levels of organic food products, to identify which factors determine consumers’ eating habits and drive their food purchasing decisions. The second step consists in the evaluation of potential environmental impacts related to barley cultivation, both in organic and conventional farming, to identify the most suitable solution in terms of environmental sustainability and productive efficiency.
The identification of determinants of Italian consumers’ eating habits and food purchasing decisions is achieved adopting a Combination of Uniform and shifted Binomial random variables models, the so-called CUB models. The evaluation of potential environmental impacts related to barley cultivation is achieved performing a comparative Environmental Life Cycle Assessment (E-LCA) from cradle to farm gate between two production systems (organic and conventional farming) of two farms located in Apulia region.
14 Figure 1. Research framework.
Research Questions
Methodological approach Background
Which is the best solution for barley cultivation, between organic and conventional farming, in terms
of environmental sustainability and efficiency? How do consumers perceive organic food products,
in terms of healthiness and sustainability?
Growing concerns for healthiness and sustainability of agri-food products
Barley show potential as healthiness and environmental sustainable crop
Evaluation of potential environmental impacts related to barley cultivation in Apulia region Identification of determinants of Italian consumers'
eating habits and food purchasing decisions
Expected results
Concluding on potential of barley in terms of healthiness and sustainability for consumers and producers
Environmental Life Cycle Assessment (E-LCA) methodology
Combination of Uniform and shifted Binomial random variables (CUB) models
15
1.
Chapter 1
BARLEY
Barley (Hurdeum vulgare L.) is an ancient and important grain crop, grown and used worldwide (Sullivan et
al., 2013; Baik and Ullrich, 2008). Its prominence is due essentially to the role that has played in several
field, such as in the human development of agriculture, civilizations, and cultures, or in the sciences of agronomy, physiology, genetics, breeding, malting, and brewing (Ullrich, 2011).
The genus name of barley, Hordeum, derives from Roman gladiators, who were defined “hordearii” or “barley men” at their time, because they were used to consume barley to assume strength and stamina (Percival, 1921).
Barley was one of the first agricultural domesticates (Sullivan et al., 2013; Baik and Ullrich, 2008), playing a significant role at least 10,000 years ago, during the human transition from hunting to agrarian lifestyle in the Fertile Crescent of the Near East. (Ullrich, 2011). In thousands of years of domestication, barley has progressively accumulated features that facilitated agricultural production, thanks to results of environmental selection or human choice (von Bothmer and Komatsuda, 2011).
1.1. Botanical and agronomic characteristics of barley
Barley (Hordeum vulgare L.) belongs to Triticeae, a tribe in the grass family, Poaceae (Table 1) (USDA NRCS, 2016). Triticeae, which is one of the economically most important plant groups in the world, includes the major temperate grain, such as several species of wheat, rye, and barley (von Bothmer and Komatsuda, 2011).
Table 1. Classification report of barley.
Rank Scientific name Common name
Kingdom Plantae Plants
Subkingdom Tracheobionta Vascular plants
Superdivision Spermatophyta Seed plants
Division Magnoliophyta Flowering plants
Class Liliopsida Monocotyledons
Subclass Commelinidae -
Order Cyperales -
Family Poaceae/Gramineae Grass family
Genus Hordeum L. Barley
Species Hordeum vulgare L. Common barley
Source: elaboration on USDA NRCS (2016).
According to Sullivan et al. (2013), barley can be classified as: ⋅ spring or winter barley;
⋅ two-row barley, where only the central spikelet is fertile, or six-row barley, where both central and lateral spikelets are fertile;
⋅ hulled barley, which present an outer husk attached to the grain, or hull-less barley, which does not present an outer husk attached to the grain;
⋅ malting barley or feed barley, depending on end-use.
Species of genus Hordeum are characterized by few basic botanical features. Typically, each rachis node has a triplet, which are three one-flowered (one seeded) spikelets. Non domesticated species of Hordeum have
16
lateral spikelets always stalked, while Hordeum vulgare have lateral spikelets sessile. In the triplets lateral spikelets may be fertile and seed setting as in six-rowed barley, but they are sterile in two-rowed barley. An important feature is the large plasticity in morphological traits. Under unfavorable stress conditions caused by drought, heat, salinity, or flooding, the plants may be slender with a single, short culm with a minute spike, with a low but secured seed set. Under favorable conditions, the same genotype may be luxuriant with a height of 1 m, with several culms and large spikes and florets (von Bothmer and Komatsuda, 2011).
Figure 2. Hordeum vulgare L.
Source: USDA-NRCS PLANTS Database - Hitchcock, A.S. (rev. A. Chase) (1950), Manual of the grasses of the
United States, USDA Miscellaneous Publication No. 200, Washington, DC.
In general the composition of wholegrain barley consists of approximately 70% starch, 10-20% protein, 5-10% β-glucan, 2-3% free lipids and approximately 2.5% minerals, with total dietary fiber ranging from 11 to 34% and soluble dietary fiber being within 3-20% (Sullivan et al., 2013).
17 Figure 3. Barley grain and cross section.
Source: Sullivan, P., Arendt, E., and Gallagher, E. (2013), “The increasing use of barley and barley by-products in the production of healthier baked goods”, Trends in food science & technology, Vol. 29 No. 2, pp. 124-134.
Figure 4. Percentage al location of energy in barley grain. Source: elaboration on CREA (2016).
Table 2. Chemical composition and energy value for 100g of edible barley grain. Chemical composition Edible part Water Proteins Lipids Cholesterol Available carbohydrates Starch Soluble sugars Fiber (total) Soluble fiber Insoluble fiber Alcohol Energy Energy Sodium Potassium Iron Calcium Phosphorus Thiamine Riboflavin Niacin
Vitamin A - retinol equivalent Vitamin C
Source: elaboration on CREA (2016). 13%
4%
Carbohydrates
18
Percentage al location of energy in barley grain.
Chemical composition and energy value for 100g of edible barley grain. Unit % g g mg g g g g g g g g kcal kJ mg mg mg mg mg mg mg mg μg mg 83% 4%
Carbohydrates Proteins Lipids
Value for 100 g 100.00 12.20 10.40 1.40 0.00 70.50 64.10 0.00 9.20 4.41 4.83 0.00 319.00 1,333.00 3.00 120.00 0.70 14.00 189.00 0.09 0.08 3.10 0.00 0.00
19
Barley is the most widely adapted grain: it may be cultivated in vast and also marginal areas with relatively low yields and low management intensities (Ingvordsen et al., 2015; Lamonaca and Tricase, 2015; Marinaccio et al., 2015; Tondelli et al., 2015; Francia et al. 2011), while it does not produce acceptable yields under well-drained loam soils, at moderate rainfall (400-800 mm) or under irrigation, and at moderate temperature regimes (15-30 °C), because it is a rain-fed cereal (Ullrich, 2011). Barley is characterized by a good tolerance to drought, cold, and salt, although it does not tolerate highly humid warm climates (Ullrich, 2011). Typically, barley is grown in the cooler temperate zones where moisture levels are adequate for both autumn and spring planting and are adequate during the early summer months to enable grain to grow and fully mature. (Garstang and Spink, 2011; Ullrich, 2011).
1.2. Crop management
The worldwide adaptation of barley has encouraged research and development of best management practices for barley production (Ullrich, 2011). Unlike other regions of the world, the EU operate within the framework of Common Agricultural Policy (CAP), which support payments to farmers in compliance with Council Regulation 1782/2003 (European Commission, 2003), in order to achieve environmental and plant health as well as good agricultural and environmental conditions (e.g. avoidance of erosion, preservation of soil organic matter, etc.). The EU supports main cultural practices related to local growing conditions and intended to the progressive improvement of barley yields. Crop management practices thus aim at reducing variation of yields per hectare between years, depending on the effect of different types of climate, as well as to produce high and profitable yields (Garstang and Spink, 2011).
1.2.1. Tillage practices
Used tillage techniques for barley were essentially based on ploughing in seedbed preparation (Briggs, 1978), while recently it is common moves towards a minimum cultivation technique (min-till) to rapidly prepare seedbed and sow the crop in a few number of operations (Garstang and Spink, 2011). But min-till is not able to provide the same weeds control achievable by ploughing. The majority of crops are drilled using drills to put seeds into a range of seedbeds from min-tilled soil to a fully pre-prepared seedbed. Given seed rates ranging from about 100 to 250 kg/ha for light seeds, barley crop is able to start the period of rapid growth with enough healthy plants ready to respond to fertilization (Garstang and Spink, 2011).
1.2.2. Weeds and Weed Control
Weeds in cereals may be broad-leafed, which could be easily removed at the seedling stage, and grass, which are the most difficult to control. The main method of weed control in barley is the usage of herbicide, possibly during pre-emergence or early post-emergence: the first chemical ones were developed to remove broad-leafed weeds from cereals over 60 years ago. The increasing weeds resistance to herbicide as well as concerns about pesticide safety highlight the need to integrate the usage of herbicide with other control measures, such as crop rotation and cultivation techniques (Garstang and Spink, 2011).
1.2.3. Fertility
According to Ministry of Agriculture Fisheries and Food (MAFF) (2000) and De Clercq et al. (2001), an efficient management of nutrient requirements of barley has to take into account total nutrient input, total nutrient derived by barley crop, and supply of nutrients already in the soil at the start of the growing season. Barley mainly requires nitrogen, phosphate, and potassium; in addition, it requires sulfur more routinely where atmospheric deposition rates have fallen and soil supplies are inadequate. Applying phosphorus and nitrogen to barley in low rainfall areas improve water use efficiency. For the fertilization, in primis available nitrogen and variation in the mineralization of soil organic nitrogen supplies during the growing period have to take into account; in second instance in addition to soil supply organic fertilizer (e.g. slurry, higher dry
20
matter manures, etc.) needs to be considered; finally inorganic fertilizer can be applied to support anticipated production and to improve grain yield (Garstang and Spink, 2011).
1.2.4. Water management
Barley grown in the EU is mainly rain-fed and well adapted to drier conditions. Earlier maturation and harvest of barley may minimize its exposure to hotter weather conditions. To trigger germination in dry seedbeds, it is sufficient to provide water with showers. A return of drought conditions may determine significant seedling loss through desiccation: in these cases irrigation may be useful (Garstang and Spink, 2011).
1.2.5. Harvest
At harvest time, excessive moisture not always is advantageous. In general barley grain needs to have a content of moisture about 14% for safe storage at less than 15 °C, although the moisture requirement changes in accordance with ambient temperature and specific risk factor: storage temperature below 4-5 °C requires around 19-20% of moisture in barley grains, while storage temperatures above 30 °C requires around 12% of moisture in barley grains. Storage below 15 °C is essential to avoid insect damage (Garstang and Spink, 2011).
1.3. An overview of grain sector from a market perspective
Although on global markets grain are mainly considered as commodities, they represent the most relevant source of world’s food energy consumption (Tadesse et al., 2014; Serra and Gil, 2012; Wright, 2011), and a strategic sector for both producers and policymaker.
Global demand of grain is growing gradually at 1.8% per year. Nowadays, only few countries are responsible for the most of the total cereals production: China, the United States (US), the European Union (EU) and India together account for over 70% of global grain production; but new players are emerging also in South-Eastern Europe (e.g. Ukraine and Turkey) and in South America (e.g. Mexico, Argentina, Brazil). In general, the greatest producers are also the major consumers: the US and the EU are key consumers of grain, respectively with 15% and 12% of world total consumption, but in recent times also the emerging economies, such as China, India, Brazil and Russia, have become greater grain consumers. Regarding the traded volumes for cereal, they tripled in the last decade, although grain trade remains dependent on a small number of key export centers, such as the Northern and the Southern America and the Black Sea basin (USDA FAS, 2016; FAO - FAOSTAT, 2016).
At European level, in the last decades grain sector has reached a well-established development, thanks to the favorable conditions of the market and to the great support schemes provided by CAP. These factors allow grain sector to achieve high levels of technical, productive and organizational efficiency. Remarkable improvements have been gained in terms of productivity, with increases in yields and acreages; several market organizations have been created, with the resulting upgrade of the economic network. However the growth of grain sector nowadays suffers a slowdown, characterized by a drop in profitability and an increase in competitiveness: these levels of criticality have been encouraged by the search of new economic strategies, based on higher quality levels and oriented towards the promotion of niche products (Ismea, 2016).
Within the framework of the Italian agricultural productions, grain sector plays a prominent role due to its economic importance on the overall value in the primary sector and generally in the agribusiness, and to its significance in terms of number of involved farms and processing firms and of allocated area. Grain business affects both agricultural and processing stages. Regarding the agricultural stage, cereals correspond to 18% of the overall agricultural crops (Figure 5), which value amounts to 4,691 million of Euro; while in the
processing sectors cereal allow the strengthening of supply chain networks both in food and in feed industry (Ismea, 2016).
Figure 5. The relevance of Italian grain s Source: elaboration on Ismea (2016).
In Italy, the most important and widespread
together represent 82% of the overall value of cereals (Ismea, 2015).
1.3.1. The trend of barley market 1.3.1.1. International market of barley
Barley crop is the fourth most important cereal in the world, after wheat, corn Ullrich, 2011; Baik and Ullrich 2008).
market of barley. In this regard, considering a period of 55 years, quantities at the end of market year;
barley. The latter, in its turn, depends on harvested area and yields (Figur
Figure 6. Global trend of market fundamentals of barley during the period 1960 Source: elaboration on USDA FAS PSDO
In general, barley producers utilize
shows, domestic consumption absorbs almost the entire production fluctuating wildly around a stagnant trend
18% 82% Agricultural stage Grains Other agricultural crops 0,00 200,00 400,00 600,00 800,00 1.000,00 1.200,00 1.400,00 1.600,00 1.800,00 2.000,00 1960 1965 1970 G t Production 21
allow the strengthening of supply chain networks both in food and in feed industry
grain sector.
most important and widespread grain crops are soft and durum wheat, corn and barley, which together represent 82% of the overall value of cereals (Ismea, 2015).
International market of barley
Barley crop is the fourth most important cereal in the world, after wheat, corn and rice (Sullivan
Baik and Ullrich 2008). Market fundamentals are able to describe the operating principles of onsidering a period of 55 years, Figure 6 shows the
quantities at the end of market year; levels of consumption; export and import flows barley. The latter, in its turn, depends on harvested area and yields (Figure 7).
undamentals of barley during the period 1960-2015. Source: elaboration on USDA FAS PSDO (2016).
barley producers utilize the bulk of their production domestically (Ullrich,
domestic consumption absorbs almost the entire production: they share a common tendency, fluctuating wildly around a stagnant trend since 1975. While trade flows (i.e. imports and exports)
Agricultural stage Grains Other agricultural crops 3%4%5% 88% Processing stage 1975 1980 1985 1990 1995 2000
Exports Imports Storage
allow the strengthening of supply chain networks both in food and in feed industry
are soft and durum wheat, corn and barley, which
and rice (Sullivan et al., 2013; fundamentals are able to describe the operating principles of the world trend of stored consumption; export and import flows; production level of
(Ullrich, 2011). As Figure 6 hey share a common tendency, (i.e. imports and exports) rose
Processing stage Milling industry Pastry industry Feed industry Other sectors 2005 2010 2015 Consumption
22
gradually with sporadic peaks of low intensity and frequency, storage levels swing dramatically whit a slow upward trend (Figure 6). Barley is one of the most cultivated cereals, globally: production levels, harvested area, and yield have been relatively stable and growing over the period 1960-1995, but barley has decreased by about 12% in overall production in the past 20 years. Yield averages, hectare intended to barley cultivation, and total production generally reflect relative growing conditions, in particular precipitation, and management technology, such as for instance soil fertility and pest management (Ullrich, 2011). Although area of barley suffers a decrease with respect to the period from 1975 to 1990, its yields, except for a setback in 1997-2000, is steadily growing thanks to improvements in technical and productive efficiency (Figure 7). During the last period of fifty years, the tendency of barley world production shows an increase until the mid-Seventies, followed by an irregular curve trend. In contrast, barley world export and storage have a constant evolution during the same period (Figure 6). There is considerable trade of barley: FAO estimated that barley grain, typically exported and imported annually, this century have generated globally about 3 billion US$ per year (FAO - FAOSTAT, 2016).
Figure 7. Global harvested area and yields of barley during the period 1960-2015. Source: elaboration on USDA FAS PSDO (2016).
Current world production is approximately 1.400 Gt (USDA FAS PSDO, 2016). By far the leading barley producer1 is the EU (586.8 Gt), followed by Russian Federation (165 Gt) and Australia (86 Gt): the EU and
Russian Federation jointly account for more than 60% of the world’ s barley production (Figure 8) (USDA FAS PSDO, 2016). The widespread regional distribution of barley production over the globe highlights the high adaptability of this grain (Ullrich, 2011).
1 The major producers of barley for the last 55 years were identified by calculating their share of production with respect to the total
production of barley over the last 55 years.
0,00 0,20 0,40 0,60 0,80 1,00 1,20 1,40 1,60 1,80 0,00 100,00 200,00 300,00 400,00 500,00 600,00 700,00 800,00 900,00 1960 1965 1970 1975 1980 1985 1990 1995 2000 2005 2010 2015 t/ h a G h a
Figure 8. Leading world producers of b Source: elaboration on USDA FAS PSDO
1.3.1.2. European market of barley
As far as the EU is concerned, considering a period of 55 years, Figure
quantities at the end of market year; levels of consumption; export and import flows; production level of barley. Figure 10 shows the trend of area intended to barley cultivation and relative yields, over the past decades. Trend of production and consumption of barley
since the mid-Eighties (Figure 9).
Figure 9. European trend of market fundamentals of barley during the period 1960 Source: elaboration on USDA FAS PSDO (2016).
Current production of barley in the EU is approximately barley crop produced in the world (Figure
Gha, giving an average yield of 0.05 t/ha (Figure yields have increased, with sporadic but severe
2 Data about market fundamentals of barley, collected from USDA FAS PSDO’s
European Union from 1999 to 2015. 6,16% 5,51% 34,51%
European Union Russia
0,00 100,00 200,00 300,00 400,00 500,00 600,00 700,00 1960 1965 1970 G t Production 23 producers of barley in 2015. Source: elaboration on USDA FAS PSDO (2016).
concerned, considering a period of 55 years, Figure 9 shows the world trend of stored quantities at the end of market year; levels of consumption; export and import flows; production level of shows the trend of area intended to barley cultivation and relative yields, over the past Trend of production and consumption of barley in the EU reflects, while imports is almost null
undamentals of barley during the period 1960-20152.
Source: elaboration on USDA FAS PSDO (2016).
n the EU is approximately 586.8 Gt, which accounts for more than 40% world (Figure 9). The 586.8 Gt of barley from the EU was produced from 124.2 Gha, giving an average yield of 0.05 t/ha (Figure 10) (USDA FAS PSDO, 2016).
, with sporadic but severe peaks (Figure 10): in particular, the drop
Data about market fundamentals of barley, collected from USDA FAS PSDO’s database, refer to EU 42,01%
11,81%
Russia Australia Canada Others
1975 1980 1985 1990 1995 2000
Exports Imports Storage
shows the world trend of stored quantities at the end of market year; levels of consumption; export and import flows; production level of shows the trend of area intended to barley cultivation and relative yields, over the past in the EU reflects, while imports is almost null
Gt, which accounts for more than 40% of the ). The 586.8 Gt of barley from the EU was produced from 124.2 ) (USDA FAS PSDO, 2016). Over the last 55 years, he drop in yields in 1992
database, refer to EU-15 from 1960 to 1998 and to
2005 2010 2015
was caused, according to Garstang and Spink (2011),
EU countries. During the last decade, barley yields have been characterized by slower rate for the upward spikes in 2004, 200
from the mid-Nineties (Legg, 2005).
Figure 10. European harvested area and yields of barley during the Source: elaboration on USDA FAS PSDO
Countries of the EU produce over 40% of (17,26%), France (17,21%), Spain (16,
2016), which are amongst the top 10 countries that have the greater share of barley production in (Ullrich, 2011).
Figure 11. Leading European producers of barley in 201 Source: elaboration on FAO - FAOSTAT
Among the EU countries, Italy is the thirteenth with a production equal to 846,142 t FAOSTAT, 2016).
3 Data about yields and harvested area of barley, collected from USDA FAS PSDO’s database, refer to EU
to European Union from 1999 to 2015.
4 FAOSTAT’s database provides country-level data updated until 2014.
0,00 20,00 40,00 60,00 80,00 100,00 120,00 140,00 160,00 180,00 1960 1965 1970 1975 G h a 11,83% 36,93% Germany France 24
Garstang and Spink (2011), by unfavorable weather conditions During the last decade, barley yields have been characterized by slower rate
2008 and 2013-2014: also yields of other grain showed the same tendency 2005).
European harvested area and yields of barley during the period 1960-20153.
Source: elaboration on USDA FAS PSDO (2016).
the EU produce over 40% of barley world production: by far the leading producers are %), Spain (16,78%), and United Kingdom (11.83%) (Figure
amongst the top 10 countries that have the greater share of barley production in
producers of barley in 2013. FAOSTAT (2016).
Among the EU countries, Italy is the thirteenth with a production equal to 846,142 t
Data about yields and harvested area of barley, collected from USDA FAS PSDO’s database, refer to EU level data updated until 2014.
1975 1980 1985 1990 1995 2000 2005
Harvested area Yield
17,26%
17,21%
16,78%
Spain United Kingdom Others
conditions across much of the During the last decade, barley yields have been characterized by slower rate of growth, except 2014: also yields of other grain showed the same tendency
: by far the leading producers are Germany 83%) (Figure 11) (FAO - FAOSTAT, amongst the top 10 countries that have the greater share of barley production in the world
Among the EU countries, Italy is the thirteenth with a production equal to 846,142 t in 20144 (FAO -
Data about yields and harvested area of barley, collected from USDA FAS PSDO’s database, refer to EU-15 from 1960 to 1998 and 0,00 0,01 0,02 0,03 0,04 0,05 0,06 2010 2015 t/ h a
25 1.3.1.3. Italian market of barley
In Italy, barley is equally distributed throughout the territory: regions of Northern Italy are the most productive ones, followed by Southern Italy and, in a lesser percentage, by region of Central Italy (Figure 12) (INEA, 2016).
Figure 12. Italian production of barley, classified by geographical area, during the period 2000-2013. Source: elaboration on INEA (2016).
Among Italian regions, Emilia Romagna is the major producer of barley, with an annual production of
106.80 kt and a corresponding value of 21,335.50 thousand € in 20135, followed by Umbria and Lombardy
(Figure 13) (INEA, 2016).
Figure 13. Italian produced quantity and value of production of barley in 2013. Source: elaboration on INEA (2016).
5 INEA’s database provides regional-level data updated until 2013.
0,00 200,00 400,00 600,00 800,00 1000,00 1200,00 1400,00 20 00 20 01 20 02 20 03 20 04 20 05 20 06 20 07 20 08 20 09 20 10 20 11 20 12 20 13 k t
Northern Italy Central Italy Southern Italy Italy
0,00 5.000,00 10.000,00 15.000,00 20.000,00 25.000,00 0,00 20,00 40,00 60,00 80,00 100,00 120,00 th o u sa n d E u r o k t Production Value
26
1
1..33..11..33..11.. MMaarrkkeettooffbbaarrlleeyyiinnAAppuulliiaarreeggiioonn
In the Southern Italy regions barley is broadly cultivated and is efficient in production, thanks to favorable pedo-climatic conditions which are typical of those areas. Climate of Southern Italy is mostly Mediterranean with wet, mild winters and hot, dry summers (Lamonaca et al., 2016).
Amongst Southern regions of Italy, Apulia is the major producer, with an annual production of 55.10 kt and a corresponding value of 31,301.39 thousand € in 2013 (Figure 14) (INEA, 2016).
Figure 14. Apulian area intended to barley cultivation and produced quantity of barley during the period 2008-2012. Source: elaboration on Ismea (2016).
According to the last data provided by Ismea (2016), after a period of stable data referred to land intended to cultivation of barley (from 2008 to 2011), in 2012 barley harvested area suffered a severe reduction of about 32%. This is one of the reason also of the reduction in production of barley in Apulia region: from 2010 to 2012 barley production decreased of about 36% (Figure 14) (Ismea, 2016).
1.3.2. Barley supply chain in Italy
Barley crop has a considerable role by three points of view: economic, productive and environmental. From an economic perspective, barley production allows to boost some of major agro-industrial supply chains, such as milling and pastry industry, starch factory for both human nutrition and industrial applications, and feed industry. About the productive point of view, its availability on a specific area permits to foster domestic and international competitiveness of related supply chains. In environmental terms, barley helps to improve a well-balanced agro-soil profile of a particular territory.
Barley national supply strongly affects domestic barley availability (Figure 15). Domestic supply is equal to 0.9 million t of barley grain. In general, approximately 30% of domestic production is intended to consumption needs of the producing farms. Although annual production suffers of structural fluctuations, it is necessary to confide in significant amount of foreign raw material, which on average represents the 60% of the total barley supply. Imports essentially follow two channels: feed industry directly absorbs nearly 50% of imported quantities, while private traders import the remaining half (Ismea, 2015).
Grain production and distribution component is constituted of barley producers (farms) and their diverse aggregation forms, which support basic production and operate a first commercialization of the agricultural basic product. Agricultural consortia (AC), Cooperatives (Coops) and Producers Organizations (POs) take
0,00 5.000,00 10.000,00 15.000,00 20.000,00 25.000,00 30.000,00 35.000,00 40.000,00 0,00 10.000,00 20.000,00 30.000,00 40.000,00 50.000,00 60.000,00 70.000,00 80.000,00 90.000,00 100.000,00 2008 2009 2010 2011 2012 h a t
27
care of the commercialization of 60% of domestic barley grain, which they sell to feed industry. Private traders, which can use own storage centers or work as intermediary between farm and industry, spread approximately 30% of domestic supply, almost entirely addressed to feed industry (99% of the total) and to export only in a residual way (1% of the total). The remaining 10% of domestic production straight restock the feed industry (Ismea, 2016). All things considered, almost the entire domestic production of barley serves livestock farming, throughout feed industry.
Figure 15. Quantitative flows along barley supply chain. Source: elaboration on Ismea (2015).
The stakeholders involved in the whole barley supply chain are numerous. Barley supply chain, characterized by the existing structural dichotomy between agricultural and processing stages, encompasses barley grain production and its commercialization, production of flours, bakery products, by-products, and animal feeds (Figure 16).
Farms are the keystone of barley supply chain. Farmers consider barley as basic crop for the achievement of their economic aims and, in some pedo-climatic conditions, it is often the unique productive solution. Barley supply chain involves numerous farms, with lots of hectares intended to barley cultivation and a strongly pulverized supply of unstable quantity and quality. Farms production would be intended in part to primary processing industries and for the remaining share to mediators in aggregation forms (e.g. private traders, AC, Coops, and POs) and to feed industries. The former is essentially constituted by milling industry, while the agents in aggregation forms export barley grain as it is or serve milling and feed industries. Feed industry provides raw materials to domestic livestock or exports barley as animal feed (Ismea, 2016).
Barley supply chain encompasses also several processing industries, that have strengthened their network and supply relationships during the last years. Both primary and secondary processing industries are more concentrated in territorial and in productive terms. Processing stages need a steady procurement of barley grain, in qualitative and in quantitative terms. Primary processing sector is composed by milling industry sector, which provides to transformation of barley grain in flours. As by-products of this process, barley bran is essentially intended to animal feeds. Barley flours is addressed partially to the export and for the major part to the secondary processing industry (Ismea, 2016). Secondary processing is characterized by high
30% 60% 10% 50% 99% 50% 1%
Domestic barley grain production 0.9 mln t
Import
Livestock Barley grain export
Farm's own consumption: about 30% of agricultural production Agricultural consortia/Coop/PO Private traders Feed industry
28
productive variability and it includes barley-based bakery products, which in general are bread substitutes, pastry, confectionery, handmade and industrial bread-making industries. The productive fabric of bakery sector is characterized by a thick network of handcrafted workshops, which also make direct sale or, in some cases, they operate as manufacturing suppliers to Mass Retail Channel. Secondary processing sector addresses its productions on both foreign markets and domestic market, through several networks of wholesalers and intermediaries. The growth of exports and of domestic consumption supports an increasing national production of secondary industry (Ismea, 2016).
Figure 16. The main stakeholders of barley supply chain. Source: elaboration on Ismea (2015).
1.4. Intended uses of barley
Barley is a versatile crop, able to provide annual forage, grain for livestock, grain high in soluble fiber for human food, and grain suitable for malting (Blake et al., 2011). Most probably, in primis it was used as
Grain export
Traders/Private collection centers
Cooperatives Producers Organizations Agricultural consortia Feed industry Feed export Livestock Secondary processing
Handmade and industrial bread-making
Pastry industry Flours export
Grain import Farms
Confectionery industry
Pastry and bakery domestic consumption Pastry and bakery export
Milling industry Primary processing
human food, to then evolve into a feed, malting, brewing, and distilling grain, for which is best known worldwide (Ullrich, 2011).
According to the last data of FAO -
for feed; about 21% has been intended to malting, brewing, and distilling industries; lesser than 6% has been consumed as human food; in addition, a growing interest in renewable energy has led to modest use of barley grain for production of fuel ethanol (Figure 1
substitution effect with grain more suitable for human consumption, such as wheat and rice.
Figure 17. Intended uses of barley world production in Source: elaboration on FAO - FAOSTAT (
1.4.1. Barley for feed
Barley is a versatile, high-quality feed grain,
in diets of ruminant and non-ruminant livestock, poultry, and fish and wheat as a feed grain (Blake et al.
with respect to corn, barley plays a relevant role for food in areas where corn is not produced, especially where the climate is cool and/or dry (Ullr
intended to beef cattle rations. Also prize animals are often fed with barley soaked for 12 hours and then rolled (Blake et al., 2011). Barley is a traditional grain for
fibrous hull on its grain creates inconvenient (Blake
are added after ground during feed composition (Kellems and Church developed specific cultivar suited for commercial fish feed.
1.4.2. Barley for malt
The barley use that produces the largest value added is the production of malt, because it is associated to the production of beer and to the production of distilled alcoh
including beer goes back thousands of years
evidence to at least 8000 years ago in the Middle East and in Egypt ( Malt is also used for food applications
well as it is used as a source of flavor, aroma, and amylase activity, but in a small amount
72,60%
Food Processed
29
food, to then evolve into a feed, malting, brewing, and distilling grain, for which is best known FAOSTAT (2016), recently more than 70% of barley crop has been used n intended to malting, brewing, and distilling industries; lesser than 6% has been consumed as human food; in addition, a growing interest in renewable energy has led to modest use of barley fuel ethanol (Figure 17). The prominence of barley as food grain was due in part to a substitution effect with grain more suitable for human consumption, such as wheat and rice.
world production in 2011. FAOSTAT (2016).
quality feed grain, commonly used as a feed grain for livestock species, especially ruminant livestock, poultry, and fish, although it competes with corn, sorghum,
et al., 2011; Ullrich, 2011). However, given a greater adaptation of barley
a relevant role for food in areas where corn is not produced, especially where the climate is cool and/or dry (Ullrich, 2011). Traditionally, barley is dry rolled or ground and thus intended to beef cattle rations. Also prize animals are often fed with barley soaked for 12 hours and then Barley is a traditional grain for swine and poultry, although the presence of a fibrous hull on its grain creates inconvenient (Blake et al., 2011; Ullrich, 2011). For poultry feed
are added after ground during feed composition (Kellems and Church, 2002), while Bregitzer developed specific cultivar suited for commercial fish feed.
arley use that produces the largest value added is the production of malt, because it is associated to the production of beer and to the production of distilled alcoholic beverages. The history of alcoholic drinks including beer goes back thousands of years: in particular, the use of barley for beer dates from archeological evidence to at least 8000 years ago in the Middle East and in Egypt (Schwarz and Li, 2011; Ullri
for food applications in baking, cereal, confectionary, and distilled alcohol industries, as well as it is used as a source of flavor, aroma, and amylase activity, but in a small amount
5,60%
21,30% 0,50%
Processed Feed Other uses
food, to then evolve into a feed, malting, brewing, and distilling grain, for which is best known FAOSTAT (2016), recently more than 70% of barley crop has been used n intended to malting, brewing, and distilling industries; lesser than 6% has been consumed as human food; in addition, a growing interest in renewable energy has led to modest use of barley of barley as food grain was due in part to a substitution effect with grain more suitable for human consumption, such as wheat and rice.
as a feed grain for livestock species, especially , although it competes with corn, sorghum, , 2011; Ullrich, 2011). However, given a greater adaptation of barley a relevant role for food in areas where corn is not produced, especially ich, 2011). Traditionally, barley is dry rolled or ground and thus intended to beef cattle rations. Also prize animals are often fed with barley soaked for 12 hours and then although the presence of a , 2011; Ullrich, 2011). For poultry feed β-glucans 2002), while Bregitzer et al. (2007)
arley use that produces the largest value added is the production of malt, because it is associated to the The history of alcoholic drinks he use of barley for beer dates from archeological Schwarz and Li, 2011; Ullrich, 2011). in baking, cereal, confectionary, and distilled alcohol industries, as well as it is used as a source of flavor, aroma, and amylase activity, but in a small amount. Globally, barley