UNIVERSITY OF URBINO CARLO BO
DEPARTMENT OF BIOMOLECULAR SCIENCES
PhD course in Life Sciences, Health and Biotechnologies
Curriculum Health and Exercise Science
XXXIII CYCLE
CLINICAL IMPLICATIONS OF EXTRACELLULAR
VESICLES IN PROSTATE AND BREAST CANCER
SSD: BIO/16 HUMAN ANATOMY
TUTOR: Prof. Michela Battistelli
CO-TUTOR: Dr. Sara Salucci
i
INDEX
1. INTRODUCTION………....1
2. AIM OF THE WORK ………...4
3. MATERIALS AND METHODS………....5
3.1. Prostate cancer case series ………..………....5
3.2. Breast cancer case series ………...……..7
3.3. Serum and urine collection ………...8
3.4. EVs isolation and quantification ………...……..8
3.4.1. EVs from serum………...……….8
3.4.2. EVs from urinary supernatant ………..………...9
3.4.3. EVs quantification …………....………..………..………...9
3.5. TEM analysis ………..……….………...9
3.6. MACSPlex analysis ………..………10
3.7. miRNA isolation and quantification.………...…..11
3.8. Small-RNA Seq analysis ………..….11
3.9. Statistical analysis ……….11
4. RESULTS ...……….12
4.1. Serum and urinary supernatant EVs isolation .………..12
ii
4.3. MACSPlex results ……….15
4.3.1. Serum EVs ……….15
4.3.2. Urinary EVs ………..19
4.4. Small-RNA Seq results ……….24
5. DISCUSSION ……….28
REFERENCES ……….32
APPENDIX: LIST OF SCIENTIFIC PUBLICATIONS …….………...38
1.
Introduction
Extracellular vesicles (EVs) are small membrane-derived particles released in physiological and also pathological conditions. EVs can be found in different body fluids, such as blood, urine and saliva, but also into extracellular space of all cell types. EVs are distinguished by their diameter size: i. exosomes of 40–100 nm; ii. microvesicles of 100–500 nm; iii. apoptotic bodies of 500 nm–2 µm [1].
EVs carry several biological and genetic information leading to recognition of them as important mediators for cellular communication from donor to recipient cells [2-4]. EVs cargo (microRNAs, mRNAs, long non-coding RNAs, DNA fragments, proteins and lipids) can represent the heterogeneous content of the source cells with the advantage to be stable because they are protected from enzymatic degradation [5-7]. Moreover, EVs are able to alter the phenotype of recipient cells that take up them [4]. These characteristics lead to consideration of EVs as an important source of biomarkers research and discovery. In particular, recent evidence has shown the clinical implication of EVs as good candidates for investigation of biomarkers associated with cancer diagnosis, prognosis, monitoring and therapy decision [8, 9]. Moreover, the analysis of EVs detected in body fluids presents a non-invasive or minimally invasive approach to investigate cancer evolution, also in solid tumors which would otherwise require a tissue biopsy that may not always be feasible [8, 10].
Several isolation methods of EVs from biofluids are still studying and developing; however, nowadays, there is no gold standard method which provides a sample of high purity and low variability, leading to a difficult clinical application.
Exosomes are small vesicles generated from late endosomes by the inward budding of the plasma membrane of them. The second invagination of late endosomal membranes formed the intraluminal vesicles (ILVs) inside large multivesicular bodies. Most ILVs are released into the extracellular space upon fusion with the plasma membrane, which then are referred to as
exosomes [11, 12]. Exosomes are mainly studied focusing on their nucleic acid content and their ability to transfer mRNAs and microRNAs to neighbouring cells. Moreover, exosomes carry specific membrane proteins that can identify the source cells. Many exosome-specific proteins are present in exosome surface membranes, including several tetraspanin proteins (e.g. CD9, CD81 and CD63), proteins involved in cell adhesion, signalling and membrane trafficking [13]. Of note, Alix and TSG101 are frequently used as exosome markers because they implicate in the endosomal sorting complex required for transport pathway [14].
Exosomes are still deeply studied in association with cancer [8, 15]. The biogenesis of exosomes appears deregulated in cancer, resulting in an increased amount of vesicles released by cancer cell lines [16]. Exosomes could give information on the presence of early changes in cancer cells; their cargo could be a source of diagnostic, prognostic and metastatic biomarkers; and their transporters ability could be used in affecting cancer with specific exosome-based therapies [17].
Prostate Cancer (PCa) is the most frequently diagnosed cancer in the elderly population [18]. The serum prostate-specific antigen (PSA) level is the biomarker approved by the U.S. Food and Drug Administration (FDA) for the detection, follow-up and therapeutic monitoring of PCa [19]. However, the use of PSA test alone could not be sufficiently specific and, consequently, gives false-positive samples who need an invasive useless bioptic evaluation. In particular, PSA test is often poor to distinguish PCa from benign prostatic hyperplasia (BPH) patients, which is a non-malignant enlargement of the prostate due to a cellular growth that can be associated with an increased level of serum PSA [20]. For this reason, to prevent overestimated diagnosis and unnecessary treatment of patients with non-malignant conditions, the research of new noninvasive and more accurate early diagnostic PCa biomarkers are still ongoing.
PCa-related exosomes were found to contain cancer-related proteins such as the prostate-specific membrane antigen (PSMA) [21]. Some evidence showed the potential role of PCa-related exosomes isolated from serum and urine as early detection diagnostic markers for helping the patients' selection who need a bioptic evaluation [22-24].
Breast cancer (BC) is the most frequently diagnosed female cancer and the leading cause of cancer death in women in over 100 countries [25]. BC relapse occurs in the first 5 years after diagnosis in patients with hormone receptor-positive BC. Systemic recurrence is due to the presence of the minimal residual disease (MRD) after surgery or present at initial diagnosis, but undetectable by imaging or conventional blood tests [26, 27]. The detection of MRD using noninvasive approaches can allow monitoring the tumor evolution providing prognostic information and guiding therapeutic decisions. Recently, there is growing evidence that EVs play a role in early diagnosis, prognosis and cancer progression in breast cancer [28, 29], which opens the way to their feasible application in routinary clinics.
2.
Aim of the work
The main aim of this thesis was to improve the analysis and the characterisation of prostate and breast tumor-related EVs and to investigate their potential clinical implications. Different isolation methods were tested to obtain a high quantity and quality EVs from several body fluids (serum and urinary supernatant).
Prostate cancer EVs were investigated aiming to find an early diagnostic role. In particular, EVs isolated from sera and urine of PCa patients, BPH patients and healthy individuals, were phenotypically and morphologically characterised using MACSPlex kit, which allows simultaneous analysis of 37 surface epitopes, and transmission electron microscopy (TEM), respectively.
Breast cancer EVs were investigated for their miRNA cargo as potential monitoring MRD markers after surgery. In particular, EVs were isolated from sera of BC patients, which were collected after 6 months from the surgery, and of healthy individuals. Exosomal miRNAs were extracted and a small RNA Seq approach was performed.
3.
Materials and methods
3.1. Prostate cancer case series
Serum and urine were collected from 30 individuals: 10 with the first diagnosis of PCa, 10 with benign prostatic hyperplasia (BPH) and 10 healthy donors (H). All PCa patients underwent radical prostatectomy. Gleason score and pathological stage were evaluated after surgical removal of the tumor. All samples were enrolled at the Morgagni and Pierantoni Hospital (Forlì, Italy) and Bufalini Hospital (Cesena, Italy). This study was approved by the Local Ethics Committee (Comitato Etico Area Vasta Romagna e IRST) and informed consent was obtained from all patients (protocol number: L3P21). Written informed consent was obtained from all cases before the first sampling.
A summary of the clinical-pathological characteristics (age, baseline PSA level, Gleason score and stage) is reported in Table 1. The PSA level was statistically significant to distinguish PCa patients respect with other categories (p = 0.007).
Table 1: Prostate cancer case series summary.
PCa BPH Healthy donors p-value
n 10 10 10 - Median age, y (range) 73 (68-83) 74 (61-83) 53 (50-80) 0.067 Median baseline PSA level, ng/mL (range) 8.78 (0.49-118.40) 5.18 (1.38-11.00) 0.92 (0.59-5.29) 0.007 Gleason score - - - ≤6 3 >6 7 Stage - - - pT2 5 pT3 2 Unknown 3
3.2. Breast cancer case series
Twelve patients with breast cancer (BC) and 11 healthy donors (H) were enrolled at the Istituto Scientifico Romagnolo per lo Studio e la Cura dei Tumori IRST IRCCS, in Meldola (FC), Italy. Sera of patients were collected 6 months after surgical intervention. Healthy donors were menopausal women with recent negative mammography. The study was reviewed and approved by the Romagna Ethics Committee (C.E.R.O.M.) and IRST IRCCS Medical Scientific Committee (CMS). Written informed consent was obtained from all cases before the first sampling.
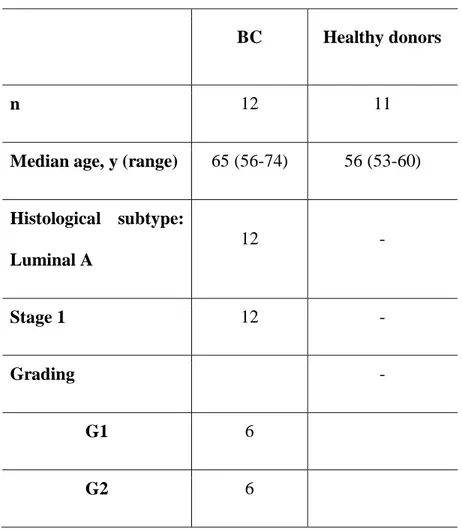
A summary of clinical-pathological information (age, histological subtype, stage and grading) is reported in Table 2.
Table 2: Breast cancer case series summary.
BC Healthy donors
n 12 11
Median age, y (range) 65 (56-74) 56 (53-60)
Histological subtype: Luminal A 12 - Stage 1 12 - Grading - G1 6 G2 6
3.3. Serum and urine collection
Approximately 5 mL of whole blood were collected in a serum tube without anticoagulant and centrifuged at 1.000 x g for 15 min at 4 °C. Then, serum was transferred into cryovials and immediately stored at −80° C until use.
In the PCa case series, the first-morning voided urine were also collected from all individuals at the same time points of the serum collection. The urine samples were maintained at 4° C for a maximum of 3 h until processing. Approximately 30 mL of urine were aliquoted and centrifuged at 850 g for 10 min. Then, the supernatants were transferred into cryovials and immediately stored at −80° C until use.
3.4. EVs isolation and quantification 3.4.1. EVs from serum
EVs from serum were isolated using Total Exosome Isolation (TEI) from serum reagent (Thermofisher Scientific) and Size Exclusion Chromatography (SEC) by qEV IZON columns (iZON Science, New Zealand). The TEI method was used to isolate EVs of PCa study; this method provided a high concentration of EVs samples, which were then selected for exosomes characterisation by MACSPLEX analysis. The SEC approach was used for BC study to obtain clean and purity samples, enriched by the exosomes population. Five hundred µL of serum were processed for each method.
Briefly, 100 µL of the TEI reagent were added to each serum sample. After incubation and centrifugation, according to the manufacturer's protocol, the EVs pellet was resuspended in 300 µL of 0.22 µm-filtered 1X PBS.
The SEC approach was performed following the manufacturer's protocol to obtain and store 500 µL of the fractions from 7 to 14 for each sample.
After quality and quantity check using Nanosight NS300 (Malvern Panalytical, UK) (see Section 3.4.3. below), the fraction 9 (F9) of each sample was evaluated as the one with the highest exosome content and was therefore chosen to proceed with the extraction of miRNAs.
3.4.2. EVs from urinary supernatant
Urinary supernatant EVs were isolated using TEI from urine reagent (Thermofisher Scientific). In particular, 2 mL of TEI reagent were added to 2 mL of urinary supernatant added to each sample. After incubation and centrifugation according to the manufacturer's protocol, the EVs pellet was resuspended in 250 µL of 0.22 µm-filtered 1X PBS.
3.4.3. EVs quantification
All isolated EVs were checked using Nanosight NS300 (Malvern Panalytical, UK), which provides the analysis of particles’ size distribution profile and concentration. Each sample was analysed after an optimal dilution for obtaining a great and evaluable particle/frame result. The resuspension buffer of EVs (0.22 µm-filtered 1X PBS) was used as the negative control.
Briefly, after the sample loading, the right focus level of the particles was adjusted. Three captures for 30 seconds each were used for the measurement.
3.5. TEM analysis
To evaluate the shape and the size of EVs negative staining for TEM has been carried out. For the PCa study, EVs isolated from serum and urinary supernatant were adsorbed to formvar carbon-coated 200 mesh grids (Agar Scientific Ltd., Stansted, UK) for 20 min. After grids drying, they were incubated with 2% (w/v) sodium phosphotungstate for 1 min and the liquid excess was removed with filter paper. After negative staining, specimens were observed by means of a Philips CM10 transmission electron microscope at 80 kV [30].
3.6. MACSPlex analysis
The MACSPlex Exosome Kit (Miltenyi Biotec) permits the detection of 37 exosomal surface epitopes (CD3, CD4, CD19, CD8, HLA-DR, CD56, CD105, CD2, CD1c, CD25, CD49e, ROR1, CD209, CD9, SSEA4, HLA-BC, CD63, CD40, CD62P, CD11c, CD81, MCSP1, CD146, CD41b, CD42a, CD24, CD86, CD44, CD326, CD133/1, CD29, CD69, CD142, CD45, CD31, CD20, CD14) plus two isotype controls (REA and IgG1).
For the PCa study, EVs were incubated with antibody-coated MACSPlex Exosome Capture Beads and then were labeled with the MACSPlex Exosome Detection Reagents for CD9, CD81, CD63. These complexes formed between the MACSPlex Exosome Capture Bead, exosomes, and the Detection Reagents can be analyzed based on the fluorescence characteristics (FITC and PE combination) of both the MACSPlex Exosome Capture Bead and the Detection Reagents.
Briefly, 6 µL and 80 µL of EVs from serum and urinary supernatant, respectively, were added to 114 µL and 40 µL of MACSPlex buffer, respectively, to obtain a final reaction volume of 120 µL. All samples were processed following the manufacturer’s instructions.
After the calibration of flow cytometer by using the MACSPlex Exosome Setup Beads included in the kit, the detection of FITC, PE and APC fluorophores were measured for each sample. One negative control (MACSPlex Buffer only) was used in each run experiment to
detect non-specific signals.
Finally, the fluorescence intensity of each marker was obtained subtracting the median fluorescence intensity of the negative control, used in the same run experiment, from the raw median fluorescence intensity of each marker.
3.7. miRNA isolation and quantification
For the BC study, exosomal miRNAs were isolated starting from 250 µL of the fraction 9 (F9) sample obtained from SEC method. miRNA isolation was performed using miRNeasy Serum/Plasma kit (Qiagen), following the manufacturer’s instructions, without the addition of miRNeasy Serum/Plasma Spike-In Control.
Two µL of miRNA was then quantified by NanodropTM ND-1000 spectrophotometer.
3.8. Small-RNA Seq analysis
Twelve µL of miRNA were processed by TruSeq Small RNA Library Preparation Kits (Illumina), following the manufacturer's protocol. Libraries were sequenced on NextSeq 500 (Illumina) using 75-nt in single end sequencing.
3.9. Statistical analysis
Non-parametric ranking test (Median test) was used to compare continuous data (age and PSA levels of patients).
MACSPlex results were analysed by 2-ways ANOVA followed by Tukey’s post hoc test correction for multiple comparisons.
To generate heatmaps of data, data were exported to comma separated files, which were subsequently imported into R Software for further analysis and data visualization.
All p-values were based on two-sided testing, and p-values < 0.05 were considered statistically significant.
Statistical analysis was carried out using SAS software, version 9.4 (SAS Institute), GraphPad Prism 7 Software (GraphPadPrism Software) and R statistical package version v 4.0.0 (R Foundation for Statistical Computing).
4.
Results
4.1. Serum and urinary supernatant EVs isolation
First of all, we chose to perform a comparison of serum EVs isolation methods using the PCa case series samples. Two different methods for serum EVs isolation were tested: TEI and SEC approaches. We found that the TEI method provides a great yield of EVs ( ~ 1012 particle/mL)
compared to SEC method (~ 109 particle/mL in the F9 sample). However, the samples isolated using TEI were more heterogeneous in terms of EVs populations than SEC samples (Fig. 1). No statistically significant differences (p = 0.2851) in terms of particles’ concentration were found in EVs from PCa patients, BPH or healthy individuals for both methods (Fig. 1). Moreover, no significant differences were observed even for the size distribution profile among the 3 individuals’ categories. For all these reasons, we have chosen to use serum EVs isolated by TEI method for the prostate cancer study, where the MACSPlex analysis provides the further exosomes selection using CD9, CD63 and CD81 bead capture. On the other hand, we chose to use the SEC method to isolate serum EVs in the breast cancer study to obtain a high purity EVs population, considering that the downstream Small RNA-Seq analysis requires a high clean sample for obtaining an efficient performance and an accurate bioinformatician analysis.
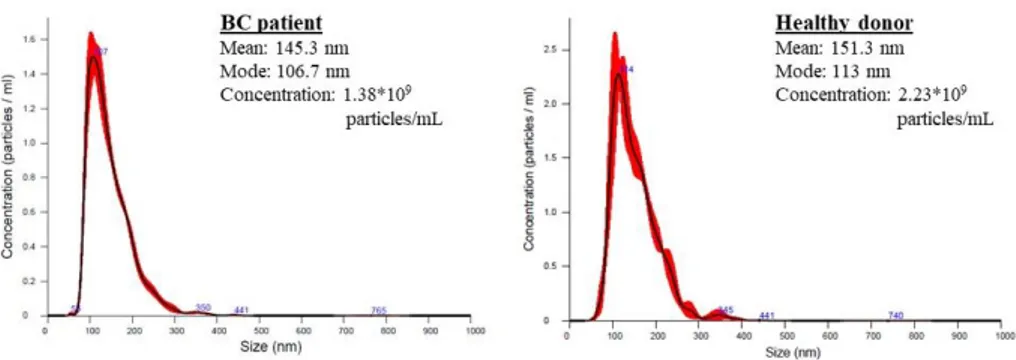
No significant differences, in terms of particles’ size distribution profile and concentration, were found in EVs from BC patients vs. healthy donors (Fig. 2).
Regarding the urinary supernatant EVs isolation, the TEI method was performed to allow the comparison with the serum EVs obtained from the matched sample. Urinary supernatant EVs were concentrated ~1010 particle/mL for each sample. However, there were
no statistically significant differences in urinary supernatant EVs concentration among the 3 categories (p = 0.3405) (Fig. 3).
Lastly, we observed that the urinary supernatant EVs quality was more heterogeneous compared to its matched serum EVs sample.
Figure 1
Fig. 1: The size distribution profile and concentration of serum EVs from samples of the PCa study. a) EVs isolated by TEI method; b) EVs isolated by SEC method (fraction 9 sample).
Figure 2
Fig. 2: The size distribution profile and concentration of serum EVs (fraction 9 by SEC method) from BC patients and healthy donor. The results were obtained by Nanosight Instrument.
Figure 3
Fig. 3: Urinary supernatant EVs profile and concentration by Nanosight Instrument of PCa study samples.
4.2. TEM results
TEM results showed the presence of serum and urinary supernatant EVs between 20 and 100 nm mostly with preserved membranes and spherical shapes (Fig. 4). Moreover, TEM observations highlighted a lower number of urinary supernatant EVs with respect to serum EVs from the same matched sample. This data confirms the different EVs concentration detected by Nanosight quantification between serum and urinary specimens.
However, no difference has been observed in the shape and size of EVs among the various conditions.
Figure 4
Fig. 4: Negative staining of serum and urinary supernatant EVs from the same matched sample. TEM observations showed numerous EVs between 20 and 100 nm.
4.3. MACSPlex results 4.3.1. Serum EVs
The mean fluorescence intensity of each marker was shown in Fig. 5. Significant differences among the 3 categories were reported for 5 markers (CD62P, CD41b, CD42a, CD29, CD31) (Table 3 and Fig. 6). In particular, the intensity of CD62P, CD41b and CD29 seemed to significantly distinguish PCa patients from BPH and H; whereas, CD42a seemed to correlate with PCa and BPH vs. H; and CD31 was significantly different between PCa and H (Table 3).
The heatmap analysis (Fig. 7) highlighted 2 main groups: the first compounds mostly of PCa and BPH patients and the second of H. The clusters generation seemed to be characterized by significant expression differences of CD29, CD41b, CD62P, CD42a, CD31, confirming the results of previous statistical analysis.
Figure 5
Fig. 5: Range to min to max of the mean fluorescence intensity for each serum EVs markers. Serum EVs from healthy donors in blue; from BPH patients in green; from PCa patients in red.
Table 3: A summary of the statistical results of serum EVs using 2-ways ANOVA test. Tukey's multiple comparisons test Mean Diff 95% CI Adjusted p-value CD62P Healthy vs. BPH 521.9 31.84 to 1012 0.0336 Healthy vs. PCa 1497 1007 to 1987 <0.0001 BPH vs. PCa 975.1 485 to 1465 <0.0001 CD41b Healthy vs. BPH 723.7 233.6 to 1214 0.0016 Healthy vs. PCa 1275 784.5 to 1765 <0.0001 BPH vs. PCa 550.9 60.84 to 1041 0.023 CD42a Healthy vs. BPH 1120 630.2 to 1610 <0.0001 Healthy vs. PCa 1300 809.6 to 1790 <0.0001 CD29 Healthy vs. BPH 1073 582.4 to 1563 <0.0001 Healthy vs. PCa 1848 1358 to 2338 <0.0001 BPH vs. PCa 775.7 285.6 to 1266 0.0006 CD31 Healthy vs. PCa 585.4 95.34 to 1075 0.0142
Figure 6
Fig. 6: Range of the mean fluorescence intensity of the 5 significant markers found. Serum EVs from healthy donors in blue; BPH patients in green; PCa patients in red. *: p<0.05; **: p<0.0001
Figure 7
Fig. 7: Heatmap analysis of the mean fluorescence intensity of each serum EVs markers.
4.3.2. Urinary EVs
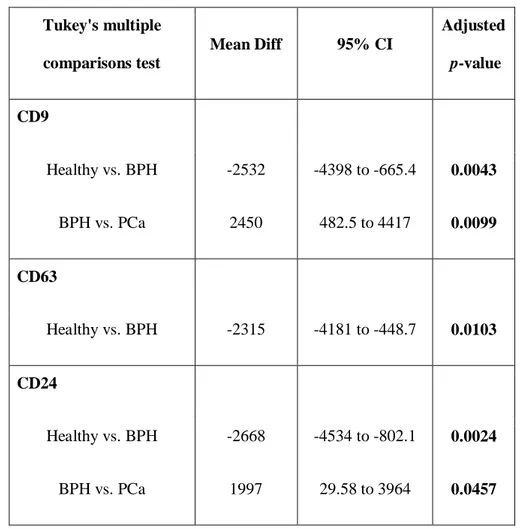
The mean fluorescence intensity of each marker was shown in Fig. 8. Significant differences were shown for 3 markers (CD9, CD63, CD24) (Table 4 and Fig. 9). In particular, CD9 and CD24 seemed to significantly distinguish BPH vs. PCa and H; whereas, CD63 was significantly different between H and BPH. Heatmap analysis confirmed these results (Fig. 10).
Figure 8
Fig. 8: Range to min to max of the mean fluorescence intensity for each urinary supernatant EVs markers.
Table 4: A summary of the statistical results of urinary supernatant EVs using 2-ways ANOVA test. Tukey's multiple comparisons test Mean Diff 95% CI Adjusted p-value CD9 Healthy vs. BPH -2532 -4398 to -665.4 0.0043 BPH vs. PCa 2450 482.5 to 4417 0.0099 CD63 Healthy vs. BPH -2315 -4181 to -448.7 0.0103 CD24 Healthy vs. BPH -2668 -4534 to -802.1 0.0024 BPH vs. PCa 1997 29.58 to 3964 0.0457
Figure 9
Fig. 9: Range of the mean fluorescence intensity of the 3 significant markers found.
Urinary supernatant EVs from healthy donors in blue; BPH patients in green; PCa patients in red. *: p<0.05; **: p<0.0001
Figure 10
4.4. Small-RNA Seq results
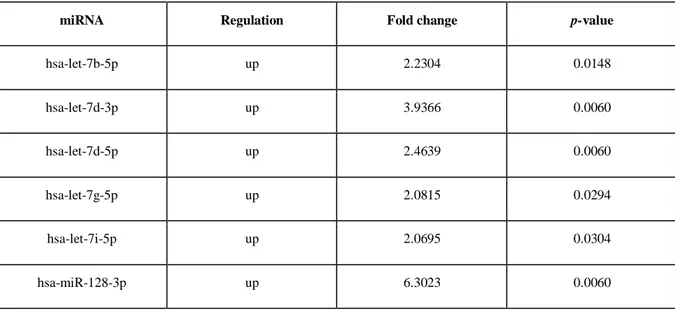
Exosomal miRNA was sufficiently extracted from all samples (total yield from 70 to 420 ng by Nanodrop quantification). All exosomal miRNA volume was processed for TruSeq Small RNA Library Preparation Kits (Illumina). Bioinformatician analysis highlighted some miRNAs without expression level, which were then excluded. The principal component analysis of normalized data showed 3 outliers samples (2 BC patients and 1 healthy donor), which were excluded from the others statistical analyses. After normalization of the expression level, 200 miRNAs with expression > 3, in the least 1 sample, were found. Considering a fold change < -2.0 or > 2.0, 52 miRNAs were significantly differentially expressed among the groups (Table 5).
Moreover, heatmap analysis (Fig. 11) showed 3 main clusters: a) a cluster with just 1 healthy donor; b) a cluster with 9 BC patients and 1 control sample; c) a cluster with 9 healthy donor samples and 1 BC patient. These results suggested the potential role of this specific pattern of 52 exosomal miRNAs as BC-related markers.
Table 5: A summary of the 52 exosomal miRNA statistically significant between breast cancer
patients and healthy donors.
miRNA Regulation Fold change p-value
hsa-let-7b-5p up 2.2304 0.0148 hsa-let-7d-3p up 3.9366 0.0060 hsa-let-7d-5p up 2.4639 0.0060 hsa-let-7g-5p up 2.0815 0.0294 hsa-let-7i-5p up 2.0695 0.0304 hsa-miR-128-3p up 6.3023 0.0060
miRNA Regulation Fold change p-value hsa-miR-1307-3p up 4.6458 0.0079 hsa-miR-1307-5p up 3.5990 0.0255 hsa-miR-144-3p up 2.8387 0.0060 hsa-miR-144-5p up 3.2739 0.0316 hsa-miR-148a-3p up 2.0130 0.0060 hsa-miR-151a-3p up 2.3466 0.0200 hsa-miR-151a-5p up 2.2244 0.0213 hsa-miR-15a-5p up 2.3710 0.0201 hsa-miR-15b-5p up 3.7140 0.0232 hsa-miR-16-5p up 2.4386 0.0060 hsa-miR-17-3p up 3.2713 0.0060 hsa-miR-191-5p up 2.4334 0.0112 hsa-miR-197-3p up 2.3643 0.0354 hsa-miR-199a-5p up 3.2837 0.0379 hsa-miR-19b-3p up 2.8865 0.0325 hsa-miR-21-3p up 2.7587 0.0374 hsa-miR-22-3p up 2.0417 0.0060 hsa-miR-221-3p up 2.6100 0.0290 hsa-miR-222-3p up 2.7015 0.0095 hsa-miR-223-3p up 2.5096 0.0148 hsa-miR-224-5p up 3.6953 0.0434 hsa-miR-25-3p up 2.3035 0.0100 hsa-miR-26b-5p up 2.0013 0.0316
miRNA Regulation Fold change p-value hsa-miR-28-5p up 2.8899 0.0452 hsa-miR-301a-3p up 3.0071 0.0374 hsa-miR-30d-5p up 2.3137 0.0166 hsa-miR-30e-3p up 3.9406 0.0148 hsa-miR-30e-5p up 2.2668 0.0040 hsa-miR-3168 down -4.8262 0.0325 hsa-miR-328-3p up 5.1498 0.0060 hsa-miR-339-3p up 3.4689 0.0101 hsa-miR-340-5p up 2.5630 0.0316 hsa-miR-345-5p up 3.0336 0.0337 hsa-miR-378a-3p up 2.9713 0.0232 hsa-miR-411-5p up 3.8928 0.0380 hsa-miR-423-3p up 3.2633 0.0374 hsa-miR-451a up 2.4960 0.0120 hsa-miR-484 up 3.8940 0.0102 hsa-miR-486-5p up 2.1207 0.0100 hsa-miR-532-3p down -2.0818 0.0118 hsa-miR-574-3p up 2.6397 0.0389 hsa-miR-584-5p up 2.5091 0.0412 hsa-miR-671-3p up 2.7627 0.0325 hsa-miR-744-5p up 2.7950 0.0200 hsa-miR-877-5p up 2.9643 0.0148 hsa-miR-96-5p up 2.4124 0.0316
Figure 11
Fig. 11: Heatmap analysis for the 52 miRNAs statistically significant.
5.
Discussion
EVs are a promising source of biomarkers in the cancer field. The possibility to analyze EVs from several body fluids opens the way to search new markers in an easy and non-invasive manner. The current challenge is still to perform a laboratory workflow to obtain both a great quantity of EVs and a purity of EVs population of interest.
During my PhD work, I focused on the feasibility of several EVs isolation approaches, from serum and urine, which could be useful to set up their characterisation in terms of phenotype, morphology and content.
Serum and urinary supernatant EVs were analyzed aiming at finding putative diagnostic markers able to distinguish PCa patients to BPH or healthy individuals. Different significant expressions of surface exosome-related proteins were found in serum (CD62P, CD41b, CD42a, CD29, CD31) and urinary supernatant (CD9, CD63, CD24) EVs samples. Our results on serum EVs suggest the investigable role of markers correlated to platelet-derived EVs, such as CD31, CD41, CD42a, CD62p. Accordingly, recent studies showed that, in human serum, most EVs are platelet-derived EVs [31-33]. Interestingly, the platelet-derived EVs have a role in several physiological but also pathological conditions such as inflammation [34] and tumor progression [35].
In agreement with our results, an interesting recent study on urinary-derived vesicles, identified exosomes derived from cell-free urine of PCa patients as positive to CD63, CD24 and CD9 [36]. Moreover, we found urinary supernatant EVs positive for CD133 and CD24, as previously reported [37].
Our analysis found no matched markers between serum and urinary supernatant EVs, suggesting the origins of EVs from various cell types. Indeed, serum collects EVs derived from multiple sources and cell types (e.g. cancer cells but also normal cells, such as hematopoietic stem cells, muscle cells, and epithelial cells).
Instead, the urinary supernatant EVs are mainly derived from urinary tract cells, mostly from kidney, prostate and bladder cells.
PCa-associated EVs are still studying and characterising by their specific membrane antigen, such as PSMA, and their cargo containing cancer-related proteins such as CD9, CD81, and TSG101, Annexin A2, Fatty Acid Synthase (FASN) [38, 39]. The challenges in developing accurate early detection markers for PCa are outstanding, and numerous new blood-based and urinary biomarker models are emerging for PCa detection, follow-up and treatment decision-making. Our data, in agreement with literature, suggest that a simultaneous analysis of different biological materials could be more informative and potentially useful towards a diagnostic or prognostic role in PCa [40]. Moreover, the workflow analysis described is fast, easily performable, and quite cost effective, even though offering the detection of several markers. The phenotype analysis of multiple antigens is already widely useful in haematological malignancies and translating this possibility to solid tumor, such as PCa, could be of enormous use.
Our data were obtained using a small pilot case series. Hence, despite a greater case series is needed, our study suggests that EVs, presenting different antigens in serum and urine of the same individual, could be investigated to deepen the role of putative markers in PCa. Moreover, it will be interesting to better characterize the EVs of PCa patients, BPH and healthy individuals also for their content such as nucleic acid and proteins to give a comprehensive informative role and for helping an accurate early diagnosis.
We then analysed the serum EVs from BC patients and healthy women donors in order to find markers associated with MRD detection. Serum EVs were isolated using the SEC method, which permits to obtain a more clean EVs population selection than other approaches. Isolated exosomes were then analyzed for their miRNA cargo by Small RNA Seq analysis, which allows a large amount of output data.
After raw data elaboration and normalization, 52 miRNAs were found to be significantly differentially expressed among the groups, suggesting a putative role of this miRNA pattern as BC-related markers and for detection of MRD. As reported in numerous literature data, most of 52 miRNA have been already shown as correlated with breast cancer but also with other cancer types (i.e. miR-148a-3p, miR-221-3p, miR-16-5p, miR-15a-5p, miR-25-3p). Other miRNAs are involved in pathways, such as Wnt and mTOR/PI3K/Akt, that regulate important cell functions and their disregulations are implicated in tumorigenesis. For example, Wnt pathway regulates proliferation and migration of cells and it is frequently deregulated in BC, becoming an attractive therapeutic target for many clinical trials [41]. The mTOR/PI3K/Akt pathway plays a crucial role in cell growth, survival, and proliferation, and it is involved in development of endocrine resistance in ER+ breast cancer cell growth and survival [42]. Lastly, many significant miRNAs found are involved in cell cycle, TNF, Ras, p53 signalling.
BC-related circulating and exosomal miRNAs are still studying, aiming at finding a role in diagnosis, prognosis and for prediction and monitoring of response to therapy [43-46]. The miRNAs encapsulated in EVs are less prone to degradation [47], leading to consider them as more suitable biomarker candidates. The changes of miRNAs expression level, in body fluids, can also indirectly suggest some chromosomal aberrations of their originating tumor cells, helping to characterise and track the tumor evolution. Moreover, several literature evidences focused on the importance of analysing also other circulating acid nucleics in correlation to MRD detection in BC [48,49].
Our data highlighted a pattern of 52 exosomal miRNAs, which are partially already known for their implications in the cancer field, but not yet in the detection of MRD in breast cancer, which opens the way to a deeper investigation of them for this role. It will be also interesting to confirm these exosomal miRNAs with a second approach, such as real-time or digital PCR.
Finally, it could be also useful to study these miRNAs in serum EVs samples collected in other BC time points (e.g. before surgery or during specific treatment) thus to give the monitoring of the disease evolution.
In conclusion, our results suggest the potential clinical application of EVs analysis in prostate and breast cancer as good non-invasive and informative biomarkers.
References
[1] Battistelli M, Falcieri E. Apoptotic Bodies: Particular Extracellular Vesicles Involved in Intercellular Communication. Biology (Basel). 2020 Jan 20;9(1):21. doi: 10.3390/biology9010021.
[2] Kalra H, Drummen GP, Mathivanan S. Focus on Extracellular Vesicles: Introducing the Next Small Big Thing. Int J Mol Sci. 2016 Feb 6;17(2):170. doi: 10.3390/ijms17020170. [3] Raposo G, Stoorvogel W. Extracellular vesicles: exosomes, microvesicles, and friends. J Cell Biol. 2013 Feb 18;200(4):373-83. doi: 10.1083/jcb.201211138.
[4] Mir B, Goettsch C. Extracellular Vesicles as Delivery Vehicles of Specific Cellular Cargo. Cells. 2020 Jul 2;9(7):1601. doi: 10.3390/cells9071601.
[5] Zaborowski MP, Balaj L, Breakefield XO, Lai CP. Extracellular Vesicles: Composition, Biological Relevance, and Methods of Study. Bioscience. 2015 Aug 1;65(8):783-797. doi: 10.1093/biosci/biv084.
[6] Veziroglu EM, Mias GI. Characterizing Extracellular Vesicles and Their Diverse RNA Contents. Front Genet. 2020 Jul 17;11:700. doi: 10.3389/fgene.2020.00700.
[7] Momen-Heravi F, Getting SJ, Moschos SA. Extracellular vesicles and their nucleic acids for biomarker discovery. Pharmacol Ther. 2018 Dec;192:170-187. doi: 10.1016/j.pharmthera.2018.08.002.
[8] Xu R, Rai A, Chen M, Suwakulsiri W, Greening DW, Simpson RJ. Extracellular vesicles in cancer - implications for future improvements in cancer care. Nat Rev Clin Oncol. 2018 Oct;15(10):617-638. doi: 10.1038/s41571-018-0036-9.
[9] Minciacchi VR, Freeman MR, Di Vizio D. Extracellular vesicles in cancer: exosomes, microvesicles and the emerging role of large oncosomes. Semin Cell Dev Biol. 2015 Apr;40:41-51. doi: 10.1016/j.semcdb.2015.02.010.
[10] Zhou B, Xu K, Zheng X, Chen T, Wang J, Song Y, Shao Y, Zheng S. Application of exosomes as liquid biopsy in clinical diagnosis. Signal Transduct Target Ther. 2020 Aug 3;5(1):144. doi: 10.1038/s41392-020-00258-9.
[11] Pegtel DM, Gould SJ. Exosomes. Annu Rev Biochem. 2019 Jun 20;88:487-514. doi: 10.1146/annurev-biochem-013118-111902.
[12] Kalluri R, LeBleu VS. The biology, function, and biomedical applications of exosomes. Science. 2020 Feb 7;367(6478):eaau6977. doi: 10.1126/science.aau6977.
[13] Clayton A, Court J, Navabi H, et al. Analysis of antigen presenting cell derived exosomes, based on immuno-magnetic isolation and flow cytometry. J Immunol Methods. 2001 Jan 1;247(1-2):163-74. doi: 10.1016/s0022-1759(00)00321-5.
[14] Henne WM, Buchkovich NJ, Emr SD. The ESCRT pathway. Dev Cell. 2011 Jul 19;21(1):77-91. doi: 10.1016/j.devcel.2011.05.015.
[15] Möller A, Lobb RJ. The evolving translational potential of small extracellular vesicles in cancer. Nat Rev Cancer. 2020 Sep 21. doi: 10.1038/s41568-020-00299-w.
[16] Bebelman MP, Smit MJ, Pegtel DM, Baglio SR. Biogenesis and function of extracellular
vesicles in cancer. Pharmacol Ther. 2018 Aug;188:1-11.
doi:10.1016/j.pharmthera.2018.02.013.
[17] Weston WW, Ganey T, Temple HT. The Relationship between Exosomes and Cancer: Implications for Diagnostics and Therapeutics. BioDrugs. 2019 Apr;33(2):137-158. doi: 10.1007/s40259-019-00338-5.
[18] Siegel RL, Miller KD, Jemal A. Cancer statistics, 2020. CA Cancer J Clin. 2020 Jan;70(1):7-30. doi: 10.3322/caac.21590.
[19] Lomas DJ, Ahmed HU. All change in the prostate cancer diagnostic pathway. Nat Rev Clin Oncol. 2020 Jun;17(6):372-381. doi: 10.1038/s41571-020-0332-z.
[20] McNally CJ, Ruddock MW, Moore T, McKenna DJ. Biomarkers That Differentiate Benign Prostatic Hyperplasia from Prostate Cancer: A Literature Review. Cancer Manag Res. 2020 Jul 1;12:5225-5241. doi: 10.2147/CMAR.S250829.
[21] Saber SH, Ali HEA, Gaballa R, Gaballah M, Ali HI, Zerfaoui M, Abd Elmageed ZY. Exosomes are the Driving Force in Preparing the Soil for the Metastatic Seeds: Lessons from the Prostate Cancer. Cells. 2020 Feb 28;9(3):564. doi: 10.3390/cells9030564.
[22] Panigrahi GK, Praharaj PP, Kittaka H, et al. Exosome proteomic analyses identify inflammatory phenotype and novel biomarkers in African American prostate cancer patients. Cancer Med. 2019 Mar;8(3):1110-1123. doi: 10.1002/cam4.1885.
[23] McKiernan J, Donovan MJ, O'Neill V, Bentink S, Noerholm M, Belzer S, Skog J, Kattan MW, Partin A, Andriole G, Brown G, Wei JT, Thompson IM Jr, Carroll P. A Novel Urine Exosome Gene Expression Assay to Predict High-grade Prostate Cancer at Initial Biopsy. JAMA Oncol. 2016 Jul 1;2(7):882-9. doi: 10.1001/jamaoncol.2016.0097.
[24] Junker K, Heinzelmann J, Beckham C, Ochiya T, Jenster G. Extracellular Vesicles and Their Role in Urologic Malignancies. Eur Urol. 2016 Aug;70(2):323-31. doi: 10.1016/j.eururo.2016.02.046.
[25] Bray F, Ferlay J, Soerjomataram I, Siegel RL, Torre LA, Jemal A. Global cancer statistics 2018: GLOBOCAN estimates of incidence and mortality worldwide for 36 cancers in 185 countries. CA Cancer J Clin. 2018 Nov;68(6):394-424. doi: 10.3322/caac.21492.
[26] Allison KH, Fligner CL, Parks WT. Radiographically occult, diffuse intrasinusoidal hepatic metastases from primary breast carcinomas: a clinicopathologic study of 3 autopsy cases. Arch Pathol Lab Med. 2004 Dec;128(12):1418-23. doi: 10.1043/1543-2165(2004)128<1418:RODIHM>2.0.CO;2.
[27] Parsons HA, Rhoades J, Reed SC, et al. Sensitive Detection of Minimal Residual Disease in Patients Treated for Early-Stage Breast Cancer. Clin Cancer Res. 2020 Jun
1;26(11):2556-2564. doi: 10.1158/1078-0432.CCR-19-3005.
[28] Wang M, Ji S, Shao G, et al. Effect of exosome biomarkers for diagnosis and prognosis of breast cancer patients. Clin Transl Oncol. 2018 Jul;20(7):906-911. doi: 10.1007/s12094-017-1805-0.
[29] Greening DW, Gopal SK, Mathias RA, Liu L, Sheng J, Zhu HJ, Simpson RJ. Emerging roles of exosomes during epithelial-mesenchymal transition and cancer progression. Semin Cell Dev Biol. 2015; 40:60–71.
[30] Guescini M, Maggio S, Ceccaroli P, Battistelli M, Annibalini G, Piccoli G, Sestili P, Stocchi V. Extracellular Vesicles Released by Oxidatively Injured or Intact C2C12 Myotubes Promote Distinct Responses Converging toward Myogenesis. Int J Mol Sci. 2017 Nov 22;18(11):2488. doi: 10.3390/ijms18112488.
[31] Krafft C, Wilhelm K, Eremin A, Nestel S, von Bubnoff N, Schultze-Seemann W, Popp J, Nazarenko I. A specific spectral signature of serum and plasma-derived extracellular vesicles for cancer screening. Nanomedicine. 2017 Apr;13(3):835-841. doi: 10.1016/j.nano.2016.11.016.
[32] Brisson AR, Tan S, Linares R, Gounou C, Arraud N. Extracellular vesicles from activated platelets: a semiquantitative cryo-electron microscopy and immuno-gold labeling study. Platelets. 2017 May;28(3):263-271. doi: 10.1080/09537104.2016.1268255.
[33] Antwi-Baffour S, Adjei J, Aryeh C, Kyeremeh R, Kyei F, Seidu MA. Understanding the biosynthesis of platelets-derived extracellular vesicles. Immun Inflamm Dis. 2015 Sep;3(3):133-40. doi: 10.1002/iid3.66.
[34] Cocucci E, Racchetti G, Meldolesi J. Shedding microvesicles: artefacts no more. Trends Cell Biol. 2009 Feb;19(2):43-51. doi: 10.1016/j.tcb.2008.11.003.
[35] Helley D, Banu E, Bouziane A, Banu A, Scotte F, Fischer AM, Oudard S. Platelet microparticles: a potential predictive factor of survival in hormone-refractory prostate cancer
patients treated with docetaxel-based chemotherapy. Eur Urol. 2009 Sep;56(3):479-84. doi: 10.1016/j.eururo.2008.06.038.
[36] Bryzgunova OE, Zaripov MM, Skvortsova TE, Lekchnov EA, Grigor'eva AE, Zaporozhchenko IA, Morozkin ES, Ryabchikova EI, Yurchenko YB, Voitsitskiy VE, Laktionov PP. Comparative Study of Extracellular Vesicles from the Urine of Healthy Individuals and Prostate Cancer Patients. PLoS One. 2016 Jun 15;11(6):e0157566. doi: 10.1371/journal.pone.0157566.
[37] Ranghino A, Dimuccio V, Papadimitriou E, Bussolati B. Extracellular vesicles in the urine: markers and mediators of tissue damage and regeneration. Clin Kidney J. 2015 Feb;8(1):23-30. doi: 10.1093/ckj/sfu136.
[38] Saber SH, Ali HEA, Gaballa R, Gaballah M, Ali HI, Zerfaoui M, Abd Elmageed ZY. Exosomes are the Driving Force in Preparing the Soil for the Metastatic Seeds: Lessons from the Prostate Cancer. Cells. 2020 Feb 28;9(3):564. doi: 10.3390/cells9030564.
[39] Kim D, Woo HK, Lee C, Min Y, Kumar S, Sunkara V, Jo HG, Lee YJ, Kim J, Ha HK, Cho YK. EV-Ident: Identifying Tumor-Specific Extracellular Vesicles by Size Fractionation and Single-Vesicle Analysis. Anal Chem. 2020 Apr 21;92(8):6010-6018. doi: 10.1021/acs.analchem.0c00285.
[40] Kucera R, Pecen L, Topolcan O, Dahal AR, Costigliola V, Giordano FA, Golubnitschaja O. Prostate cancer management: long-term beliefs, epidemic developments in the early twenty-first century and 3PM dimensional solutions. EPMA J. 2020 Jun 26;11(3):399-418. doi: 10.1007/s13167-020-00214-1.
[41] Michelli M, Zougros A, Chatziandreou I, Michalopoulos NV, Lazaris AC, Saetta AA. Concurrent Wnt pathway component expression in breast and colorectal cancer. Pathol Res Pract. 2020 Jul;216(7):153005. doi: 10.1016/j.prp.2020.153005.
Breast Cancer. Drugs. 2020 Nov;80(16):1685-1697. doi: 10.1007/s40265-020-01394-w. [43] Zhang Z, Zhang L, Yu G, Sun Z, Wang T, Tian X, Duan X, Zhang C. Exosomal miR-1246 and miR-155 as predictive and prognostic biomarkers for trastuzumab-based therapy resistance in HER2-positive breast cancer. Cancer Chemother Pharmacol. 2020 Dec;86(6):761-772. doi: 10.1007/s00280-020-04168-z.
[44] Zou X, Xia T, Li M, Wang T, Liu P, Zhou X, Huang Z, Zhu W. MicroRNA profiling in serum: Potential signatures for breast cancer diagnosis. Cancer Biomark. 2020 Aug 21. doi: 10.3233/CBM-201547.
[45] Yang Z, Liu Z. The Emerging Role of MicroRNAs in Breast Cancer. J Oncol. 2020 Jul 3;2020:9160905. doi: 10.1155/2020/9160905.
[46] Jung EJ, Santarpia L, Kim J, Esteva FJ, Moretti E, Buzdar AU, Di Leo A, Le XF, Bast RC Jr, Park ST, Pusztai L, Calin GA. Plasma microRNA 210 levels correlate with sensitivity to trastuzumab and tumor presence in breast cancer patients. Cancer. 2012 May 15;118(10):2603-14. doi: 10.1002/cncr.26565.
[47] Sanz-Rubio D, Martin-Burriel I, Gil A, Cubero P, Forner M, Khalyfa A, Marin JM. Stability of Circulating Exosomal miRNAs in Healthy Subjects. Sci Rep. 2018 Jul 9;8(1):10306. doi: 10.1038/s41598-018-28748-5.
[48] Cirmena G, Garuti A, De Mariano M, Coco S, Ferrando L, Isnaldi E, Barbero V, Fregatti P, Del Mastro L, Ferrando F, Gonella R, Garlaschi A, Friedman D, Ballestrero A, Zoppoli G. Circulating Tumor DNA Using Tagged Targeted Deep Sequencing to Assess Minimal Residual Disease in Breast Cancer Patients Undergoing Neoadjuvant Chemotherapy. J Oncol. 2020 Jan 22;2020:8132507. doi: 10.1155/2020/8132507.
[49] Coakley M, Garcia-Murillas I, Turner NC. Molecular Residual Disease and Adjuvant Trial Design in Solid Tumors. Clin Cancer Res. 2019 Oct 15;25(20):6026-6034. doi: 10.1158/1078-0432.CCR-19-0152.
Appendix: List of scientific publications
1. Salvi S, Casadio V, Martignano F, Gurioli G, Tumedei MM, Calistri D, Gunelli R, Costantini M. Carcinosarcoma of the prostate: case report with molecular and histological characterization. Int J Biol Markers. 2018 Nov;33(4):540-544. doi: 10.1177/1724600818791463.
2. Conteduca V, Caffo O, Galli L, Maugeri A, Scarpi E, Maines F, Chiuri VE, Lolli C, Kinspergher S, Schepisi G, Santoni M, Santini D, Fratino L, Burgio SL, Salvi S, Menna C, De Giorgi U. Association among metabolic syndrome, inflammation, and survival in prostate cancer. Urol Oncol. 2018 May;36(5):240.e1-240.e11. doi: 10.1016/j.urolonc.2018.01.007.
3. Molinari C, Abou Khouzam R, Salvi S, Rossi T, Ranzani GN, Calistri D. Detection of a CDH1 Rare Transcript Variant in Fresh-frozen Gastric Cancer Tissues by Chip-based Digital PCR. J Vis Exp. 2018 Feb 5;(132):57066. doi: 10.3791/57066
4. Gurioli G, Martignano F, Salvi S, Costantini M, Gunelli R, Casadio V. GSTP1 methylation in cancer: a liquid biopsy biomarker? Clin Chem Lab Med. 2018 Apr 25;56(5):702-717. doi: 10.1515/cclm-2017-0703.
5. Vannini I, Wise PM, Challagundla KB, Plousiou M, Raffini M, Bandini E, Fanini F, Paliaga G, Crawford M, Ferracin M, Ivan C, Fabris L, Davuluri RV, Guo Z, Cortez MA, Zhang X, Chen L, Zhang S, Fernandez-Cymering C, Han L, Carloni S, Salvi S, Ling H, Murtadha M, Neviani P, Gitlitz BJ, Laird-Offringa IA, Nana-Sinkam P, Negrini M, Liang H, Amadori D, Cimmino A, Calin GA, Fabbri M. Transcribed ultraconserved region 339 promotes carcinogenesis by modulating tumor suppressor microRNAs. Nat Commun. 2017 Nov 27;8(1):1801. doi: 10.1038/s41467-017-01562-9. Erratum in: Nat Commun. 2018 Jan 8;9(1):160.
6. Salvi S, Conteduca V, Lolli C, Testoni S, Casadio V, Zaccheroni A, Rossi L, Burgio SL, Menna C, Schepisi G, De Giorgi U. AR Copy Number and AR Signaling-directed Therapies in Castration resistant Prostate Cancer. Curr Cancer Drug Targets. 2018;18(9):869-876. doi: 10.2174/1568009617666171122145852.
7. Salvi S, Conteduca V, Martignano F, Gurioli G, Calistri D, Casadio V. Serum and Plasma Copy Number Detection Using Real-time PCR. J Vis Exp. 2017 Dec 15;(130):56502. doi: 10.3791/56502.
8. Conteduca V, Scarpi E, Caroli P, Salvi S, Lolli C, Burgio SL, Menna C, Schepisi G, Testoni S, Gurioli G, Paganelli G, Casadio V, Matteucci F, De Giorgi U. Circulating androgen receptor combined with 18F-fluorocholine PET/CT metabolic activity and outcome to androgen receptor signalling-directed therapies in castration-resistant prostate cancer. Sci Rep. 2017 Nov 14;7(1):15541. doi: 10.1038/s41598-017-15928-y. 9. Conteduca V, Castro E, Wetterskog D, Scarpi E, Jayaram A, Romero-Laorden N,
Olmos D, Gurioli G, Lolli C, Sáez MI, Puente J, Schepisi G, Salvi S, Wingate A, Medina A, Querol-Niñerola R, Marin-Aguilera M, Arranz JA, Fornarini G, Basso U, Mellado B, Gonzalez-Billalabeitia E, Attard G, De Giorgi U. Plasma AR status and cabazitaxel in heavily treated metastatic castration-resistant prostate cancer. Eur J Cancer. 2019 Jul;116:158-168. doi: 10.1016/j.ejca.2019.05.007.
10. Salvi S, Bonafè M, Bravaccini S. Androgen receptor in breast cancer: A wolf in sheep's clothing? A lesson from prostate cancer. Semin Cancer Biol. 2020 Feb;60:132-137. doi: 10.1016/j.semcancer.2019.04.002.
11. Conteduca V, Jayaram A, Romero-Laorden N, Wetterskog D, Salvi S, Gurioli G, Scarpi E, Castro E, Marin-Aguilera M, Lolli C, Schepisi G, Maugeri A, Wingate A, Farolfi A, Casadio V, Medina A, Puente J, Vidal MJM, Morales-Barrera R, Villa-Guzmán JC, Hernando S, Rodriguez-Vida A, González-Del-Alba A, Mellado B, Gonzalez-Billalabeitia E, Olmos D, Attard G, De Giorgi U. Plasma Androgen Receptor and Docetaxel for Metastatic Castration-resistant Prostate Cancer. Eur Urol. 2019 Mar;75(3):368-373. doi: 10.1016/j.eururo.2018.09.049.
12. Casadio V, Salvi S. Urinary Cell-Free DNA: Isolation, Quantification, and Quality Assessment. Methods Mol Biol. 2019;1909:211-221. doi: 10.1007/978-1-4939-8973-7_16.
13. Salvi S, Casadio V. Urinary Cell-Free DNA: Potential and Applications. Methods Mol Biol. 2019;1909:201-209. doi: 10.1007/978-1-4939-8973-7_15.
14. Tebaldi M, Salvi S. From cfDNA to Sequencing: Workflows and Potentials. Methods Mol Biol. 2019;1909:119-125. doi: 10.1007/978-1-4939-8973-7_9.
15. Salvi S, Casadio V. Studying Copy Number Variations in Cell-Free DNA: The Example of AR in Prostate Cancer. Methods Mol Biol. 2019;1909:95-103. doi: 10.1007/978-1-4939-8973-7_7.
16. Fabbri F, Salvi S, Bravaccini S. Know your enemy: Genetics, aging, exposomic and inflammation in the war against triple negative breast cancer. Semin Cancer Biol. 2020 Feb;60:285-293. doi: 10.1016/j.semcancer.2019.10.015.
17. Angeli D, Salvi S, Tedaldi G. Genetic Predisposition to Breast and Ovarian Cancers: How Many and Which Genes to Test? Int J Mol Sci. 2020 Feb 8;21(3):1128. doi: 10.3390/ijms21031128.
18. Wu A, Cremaschi P, Wetterskog D, Conteduca V, Franceschini GM, Kleftogiannis D, Jayaram A, Sandhu S, Wong SQ, Benelli M, Salvi S, Gurioli G, Feber A, Pereira MB, Wingate AM, Gonzalez-Billalebeitia E, De Giorgi U, Demichelis F, Lise S, Attard G. Genome-wide plasma DNA methylation features of metastatic prostate cancer. J Clin Invest. 2020 Apr 1;130(4):1991-2000. doi: 10.1172/JCI130887.
19. Casadio V, Martignano F, Gunelli R, Salvi S. Analysis of copy number variation in urine: c-Myc evaluation using a Real Time PCR approach. Methods Mol Biol. under review
20. Casadio V, Salvi S. Urinary cell-free DNA integrity analysis. Methods Mol Biol. under review
21. Salvi S, Bandini E, Fabbri F. Urinary exosomes in prostate cancer. Methods Mol Biol. under review
Acknowledgements
I really would like to express my special thanks and gratitude to my colleagues in Istituto Scientifico Romagnolo per lo studio e la cura dei tumori IRST IRCCS: Dr. Francesco Fabbri, Dr. Erika Bandini, Dr. Silvia Carloni, Dr. Francesca Fanini, Dr. Michela Tebaldi, Dr. Sara Pignatta, Dr. Valentina Casadio.
I am especially grateful to my supervisors, Professor Elisabetta Falcieri and Professor Michela Battistelli, and to my co-tutor Dr. Sara Salucci for giving me the opportunity to collaborate with their special team.
A special thanks also goes to Professor Massimiliano Bonafè, from AlmaMater Studiorum University of Bologna, and Professor Michele Guescini, from University of Urbino Carlo Bo, for giving me their really precious advice and support me in extracellular vesicles analysis. Finally, a loving thanks goes to my family: to my husband, Matteo, for loving me and support my passion for the research; to my son, Lorenzo, for giving me superpowers and unconditional love; to my parents, my brother and my grandparents for teaching me willpower and the beauty of simple things.