1
MicroRNA miR-29 controls a compensatory
response to limit neuronal iron accumulation
during adult life and aging.
Years: 2011-2015
CANDIDATE: TUTOR:
2
CONTENTS
ABSTRACT
5
1 INTRODUCTION
6
1.1 Systemic iron homeostasis.
6
1.2 Intracellular iron homeostasis.
9
1.3 Age-dependent iron deposition.
16
1.4 Iron toxicity and neurodegenerative disease.
19
1.5 MicroRNA and aging. 21
1.6 MicroRNA and iron
26
1.7 MicroRNA mir-29 family.
27
1.8 Nothobranchius furzer.i
29
2 AIMS
31
3 RESULTS
32
3.1 Iron accumulates in Nothobranchius furzeri brain. 32
3.2 MiR-29 is up-regulated with age in neurons and is negatively-correlated
with expression of its targets. 34
3.3 mir-29 family targets IREB2 mRNA. 37
3.4 Iron overload induces miR-29 in neurons. 39
3
3.6 MiR-29 deficiency induces iron imbalance during adult life. 44
3.7 MiR-29 antagonism exacerbates aging phenotypes in N. furzeri brain. 47
4 DISCUSSION
53
4.1 Iron imbalance during normal aging. 53
4.2 mir-29 acts independently to FBXL5 in regulating IRP2 and intracellular
iron availability during adult life and aging in killifish. 54
4.3 mir-29 loss of function accelerates the aging process. 56
5 CONCLUSIONS
59
6 MATERIALS AND METHODS
60
6.1 Fish maintenance.
60
6.2 Vectors design and generation of transgenic lines.
60
6.3 IREB2 3’UTR vectors assembly and mir-29 targeting validation.
61
6.4 In vitro RNA and DIG-labeled probes synthesis .
63
6.5 Total RNA extraction and RT-qPCR.
63
6.6 Histology and histochemistry.
64
6.7 Iron staining (Perls staining).
65
6.8 Non heme iron quantification.
65
6.9 Iron and drugs delivery.
66
4
6.11 Cell culture and iron exposure.
67
6.12 RNA-sequencing and analysis.
67
6.13 Annotation of small RNAs .
67
6.14 Enrichment analysis of miR-29 binding sites.
68
5
Abstract
Iron is an essential metal cofactor for enzymes involved in many cellular functions, such as energy generation and cell proliferation. However, excessive iron concentration leads to increased oxidative stress and toxicity. As such, iron homeostasis is strictly controlled by two RNA binding proteins known as Iron Regulatory Proteins (IRPs) that regulate the expression of iron management genes at post-transcriptional level. Despite this fine regulation, an impairment of iron homeostasis occurs during aging: iron progressively accumulates in several organs and, in turn, it exacerbates cellular vulnerability and tissue damage. Moreover, excessive iron accumulation within the CNS is observed in many neurodegenerative diseases. I investigated the age-dependent changes of iron homeostasis using the short lived fish Nothobranchius furzeri. Here, I show that: i) both iron content and expression of microRNA family miR-29 increase during adult life and aging in the N. furzeri brain; ii) iron up-regulates miR-29 expression in fish brain and murine neurons, while, in turn, miR-29 targets the 3’-UTR of IREB2 mRNA, reducing iron intake; iii) Transgenic fish with knock-down of miR-29 show significant adult-onset up-regulation of IRP2 and its target TFR1 in neurons and display enhanced age-dependent accumulation of brain iron; iv) miR-29 triggers a global gene expression response that partially overlaps with that induced by aging. My studies indicate that miR-29 modulates intracellular iron homeostasis and is up-regulated as an adaptive response to limit excessive iron accumulation and to contrast aging-induced processes.
6
1.0 INTRODUCTION
1.1 Systemic iron homeostasis
Iron is an indispensable element for all living organisms. Healthy adults contain 4–5 g of iron, about 65% of which is contained in hemoglobin where it participates in oxygen transport, 30–35% is stored in liver, primarily in the storage protein, ferritin, and 1–2% is found in the form of iron–sulfur clusters or heme in the catalytic centers of numerous essential enzymes and multi-protein complexes such as the mitochondrial respiratory chain complexes, which contain twelve iron–sulfur clusters and seven hemes (Rouault, 2013). Due to the essential role of iron in vivo, tissues have developed sophisticated mechanisms to maintain appropriate iron concentrations through the entire organism (Figure 1.1). Inorganic iron is absorbed at duodenal tract by enterocytes via the divalent metal transporter 1 (DMT1/SLC11A2, solute carrier family 11, member 2) (Gunshin et al., 1997). Given that iron is largely in the oxidized state, it must first be reduced by the membrane-associated ferrireductase DcytB (Cybrd1). Cytosolic iron can then be exported into the circulation by the basolateral iron exporter ferroportin (McKie et al., 2000; Donovan et al., 2000). Enterocytic iron export through ferroportin requires hephaestin, a multi-copper oxidase homologous to ceruloplasmin, which oxidases Fe(II) to Fe(III) for loading onto transferrin (TF-Fe2). Since iron cannot be excreted from the organism in an
active way, iron absorption is the only critically controlled process. Iron absorption can be enhanced when the demand increases (for example, because of increased erythropoiesis or during pregnancy) and suppressed in conditions of iron overload. Hepcidin (encoded by the HAMP gene) has emerged as the central regulatory molecule of systemic iron homeostasis, its function is to regulate iron entry into the circulation. Hepcidin is mainly produced and secreted from hepatocytes and circulates in plasma bound to α2-macroglobulin (Peslova et al., 2009). Hepcidin is a negative regulator of ferroportin
7
activity, indeed, it binds to ferroportin and induces its internalization, ubiquitination, and subsequent lysosomal degradation (Nemeth et al., 2004). By inhibiting ferroportin serum iron falls due to iron trapping within macrophages and liver cells and decreased gut iron absorption. In this way, iron overload (when the iron amount is higher that serum transferrin binding capacity) is prevented. Hepcidin is regulated at transcriptional level and it is positively regulated when bloodstream iron concentration increases. Two different factors regulate HAMP expression: the human hemochromatosis protein (HFE) and the BMP signaling pathway. HFE has been suggested to act as a bimodal switch between two sensors of the concentration of Tf-Fe2, TfR1, and TfR2, on the plasma
membrane of hepatocytes (Goswamiand Andrews, 2006). This model is supported by the following findings: HFE binds the ubiquitously expressed TfR1 on the same site of transferrin binding domain, and Tf-Fe2 thus competes with HFE binding to TfR1. By
contrast, TfR2 can bind both HFE and Tf-Fe2 simultaneously (Gao et al., 2009). Engineered
mouse mutants carrying tfR1 with increased HFE binding show low hepcidin expression suggesting that TfR1 sequesters HFE to prevent its participation in hepcidin activation. Conversely, mutations that abolish the HFE-TfR1 interaction or mice with increased HFE levels display elevated hepcidin expression and succumb to iron deficiency (Schmidt et al., 2008). Although HFE system contributes to regulate hepcidin expression, BMP signaling pathway is the most critical regulator. BMP6 mRNA expression is activated by increased iron levels and repressed by iron deficiency. Bmp6 knockout mice show hepcidin deficiency and tissue iron overload (Andriopouloset al., 2009; Meynard et al., 2009). BMP6 is thought to act in an autocrine manner and binds the co-factor HJV that adapts BMP receptors for iron regulation (Babitt et al., 2006). The BMP/HJV complex joins the type I (Alk2 and Alk3) and the type II (ACTRIIA) BMP receptors to induce phosphorylation of receptor activated SMAD (R-SMAD) proteins and subsequent formation of active transcriptional complexes involving the co-SMAD factor, SMAD4 (Wang et al., 2005). Two sequence motifs (the proximal RE1 and the distal BMP-RE2) of the hepcidin promoter are critical for transcription via HJV, BMP6, and SMAD4 (Casanovas et al., 2009). Different evidence highlight the importance of HJV/BMP/SMAD
8
signaling for hepcidin activation: (1) mice lacking HJV show attenuated R-SMAD phosphorylation in the liver (Babitt et al., 2006), (2) administration of BMP2 and BMP6 to mice induces hepcidin mRNA and decreases serum iron levels, (3) BMP antagonists (such as dorsomorphin) inhibit hepcidin mRNA expression and increase serum iron levels (Yu et al., 2008), (4) liver-specific disruption of the co-SMAD4 causes severe iron overload with diminished hepcidin transcription (Wang et al., 2005), and (5) the inhibitory iSMAD7 potently suppresses hepcidin transcription in cellular models (Mleczko-Sanecka et al., 2010).
9
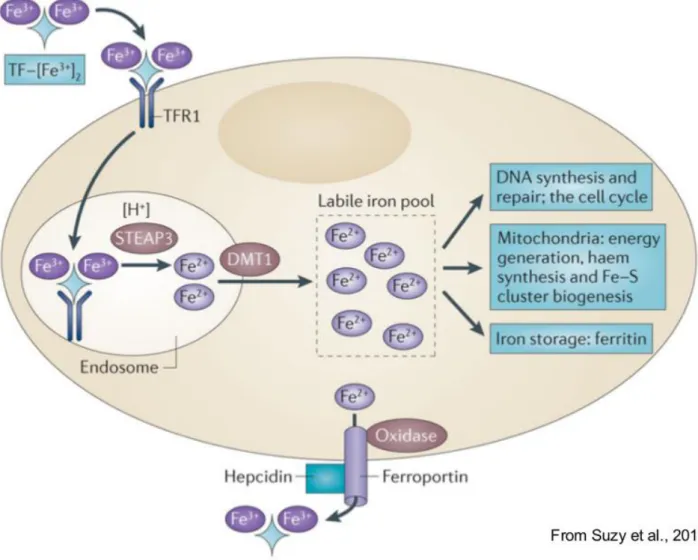
Figure 1.1: Systemic iron homeostasis. Dietary iron (predominantly in the form of ferric iron (Fe3+)) is absorbed in the duodenum through the concerted action of a reductase, such as duodenal cytochrome b (DCYTB), which produces ferrous iron (Fe2+), and divalent metal transporter 1 (DMT1). Iron exits the basolateral surface of the enterocyte through the iron efflux pump ferroportin, which functions together with the oxidase hephaestin to oxidize ferrous iron to form ferric iron, which is loaded onto transferrin (TF). The diferric iron transferrin complex (TF–[Fe3+]2) circulates through the bloodstream to deliver iron to sites of utilization. Principal among these sites is the bone marrow, where iron is used in the synthesis of haemoglobin and red blood cells (RBCs). RBCs circulate for approximately 90 days before they are catabolized by macrophages of the reticuloendothelial (RE) system. Iron is released from catabolized haem and effluxed out of the macrophage through the action of ferroportin, where it is loaded onto TF in the bloodstream, in a process termed iron recycling. TF–[Fe3+]2 is also delivered to peripheral tissues and the liver, which is the primary organ for the storage of excess iron. Since there is no excretory pathway for iron, so levels of iron in the body are primarily regulated at the absorption step. Excess iron induces the synthesis of the peptide hormone hepcidin (HP), which serves as a master regulator of systemic iron homeostasis. HP binds to ferroportin and triggers its degradation, inhibiting both delivery of dietary iron through the enterocyte and iron recycling through the macrophage.
1.3 Intracellular iron homeostasis
The maintenance of iron homeostasis by cells requires processes that are very similar to those observed at the systemic level: coordination of iron uptake, utilization, and storage to assure the availability of appropriate supplies and to prevent toxicity (Figure 1.2). However the machinery and the mechanisms are entirely different. In contrast to systemic iron metabolism, cellular iron traffic also involves regulated iron excretion. The Tf-Fe2/TfR1 complex is internalized by clathrin-dependent endocytosis. Subsequent
acidification of early endosomes triggers conformational changes in both transferrin and its receptor that promote the release of iron as Fe(III) (Dautry-Varsat et al., 1983). Iron is then reduced to Fe(II) by members of the STEAP familly of metalloreductases (Ohgami et al., 2005, 2006) for transport into the cytosol via DMT1. Transferrin and TfR1 are then largely recycled to the cell surface. Once into the cyctosol, iron forms the labile iron pool (LIP), a loosely bound and redox-active iron. High levels of LIP trigger oxydative stress, damage and cell death, for this reason, iron is rapidly bound by different protein factors in the cytosol in order to neutralize its toxicity and use it for metallation reactions.
“Not-10
utilized” iron is stored in ferritin heteropolymers made of 24 subunits of heavy (FtH1) and light (FtL) chains. Ferritin provides cells with a mechanism to sequester excess iron in a redox inactive form to prevent iron-mediated cell and tissue damage; it also constitutes an iron store and its mobilization involves both proteasomal and lysosomal ferritin degradation. Ferritin is essential, as shown by the early embryonic lethality of FTH1 knockout mice (Ferreira et al., 2000). Homopolymers of a nuclearly-encoded H-type ferritin are present also in mitochondria (Arosio and Levi, 2010). Iron export occurs from many cells, including neuronal and erythroid cells, but it is particularly important in cells that maintain plasma iron levels. Such cells include macrophages and duodenal enterocytes. These cells express relatively high levels of ferroportin (SLC40A1) and the effects of targeted disruption of the Slc40a1locus in the mouse reflects the unique, non-redundant functions of ferroportin in iron release from these cell types (Donovan et al., 2005). As mentioned above, ferroportin transports Fe(II) and acts along with the ferroxidases hephaestin (HEPH, enterocytes) or ceruloplasmin (CP, other cell types) that facilitate iron extraction from the ferroportin channel and subsequent loading onto plasma transferrin (De Domenico et al., 2007).
11
Figure 1.2: Intracellular iron metabolism.Iron circulates in the bloodstream bound to transferrin (TF), which binds two ferric iron atoms (Fe3+). TF-bound iron binds to transferrin receptor 1 (TFR1) exposed on cell surface. All the complex is endocytosed and in the acidic environment of the endosome ferric iron is released from TF and reduced to ferrous iron (Fe2+) by the activity of ferrireductase STEAP3. The TF-TFR1 complex then recycles back to the cell surface. Fe2+ is transported out of the endosome into the cytosol by the carrier DMT1 and enters the metabolically active pool of iron (labile iron pool). Here iron can undergoes toward multiple destinations: a) transported into the mitochondria for haem and iron-sulfur clusters synthesis, b) stored in ferritin, c) leaves cells through the activity of the ferroportin, an iron efflux pump and be oxidized to ferric iron by ceruloplasmin or hephaestrin to enable the loading onto TF.
12
While key aspects of systemic iron metabolism are regulated transcriptionally (hepcidin expression) and posttranslationally (ferroportin function by hepcidin), cellular iron homeostasis is coordinately regulated post-transcriptionally by two iron regulatory proteins (IRP1 and IRP2), encoded by the genes ACO1 and IREB2, respectively. The two RNA-binding proteins interact with conserved cis-regulatory hairpin structures known as IREs, which are present in the 5′ or 3′ untranslated regions (UTRs) of target mRNAs. Either of the two IRPs inhibits translation initiation when bound to the single 5′ UTR IREs of ferritin H- or L-chain (iron storage), ferroportin (export) or hypoxia-inducible factor 2α (HIF2α/EPAS1) mRNAs, whereas their binding to the multiple IRE motifs within the 3′ UTR of TFR1 (uptake) mRNA prevents its endonucleolytic cleavage and subsequent degradation (Muckenthaler et al., 2008; Recalcatti et al., 2010). The IRPs also appear to positively regulate DMT1 (uptake) mRNA expression via a single 3′ UTR IRE motif, but the molecular mechanism is not known. Single IRE like structures with restricted phylogenetic conservation have been identified in the 3′ UTR of the CDC14A (cell division cycle 14 homolog A), HAO1 (hydroxyacid oxidase 1), and CDC42BPA (CDC42 binding protein kinase α), NDUFS1, and in the 5’UTR of SCNA and APP mRNAs, but their functional roles are not yet clear (Lin, Graziano, & Freyer, 2001; Recalcati, Tacchini, Alberghini, Conte, & Cairo, 2003; Sanchez et al., 2006; Duce et al., 2010; Febbraro et al., 2012; Friedlich et al., 2012). IRP-binding to IREs responds to cellular iron levels. In iron-replete cells, IRP2 interacts with the FBXL5 (F-box and leucine-rich repeat protein 5) adaptor protein that recruits a SCF (SKP1-CUL1-F-box) E3 ligase complex, promoting IRP ubiquitination and subsequent degradation by the proteasome (Figure 1.3A). In iron-repleted conditions, FBLX5 is stabilized by iron and starts to accumulate and interacts with IRP2 mediating its ubiquitination and degradation (Salahudeen et al., 2009, Vashisht et al., 2009). Instead, in iron-deficient conditions, the FBXL5-dependent degradation of IRPs decreases. IRP1, unlikely IRP2 degraded in iron-replete conditions, ligates a cubane 4Fe-4S cluster that precludes IRE binding (Walden et al., 2006; Muckenthaler et al., 2008). Once IRP1 binds 4Fe-4S cluster functions as a cytosolic aconitase. On the contrary, in iron-deficient conditions, IRP1 loses its Fe/S cluster and aconitase activity and adopts its IRE-binding
13
conformation (Figure 1.3B). The molecular details of this iron-regulated Fe/S cluster assembly/disassembly are not yet known, but disruption of critical components of Fe/S cluster biogenesis stimulate the IRE-binding activity of IRP1 (Sheftel & Lill, 2009). It is thus possible that the ratio between the two conformation of IRP1 depends primarily on mitochondrial iron availability and Fe/S cluster synthesis, whereas cytosolic iron sensing may primarily involve IRP2. Genetic ablation of both IRPs in the mouse causes embryonic lethality (Smith et al., 2006, Galy et al., 2008). By contrast, animals lacking either protein are viable and fertile. IRP2 knockout mice show a mild microcytic anemia, a tendency toward increased neurodegeneration, and abnormal body iron distribution (Cooperman et al., 2005, Galy et al., 2005). IRP1 knockout mice are asymptomatic under laboratory conditions, demonstrating that the cytosolic aconitase activity is not essential (Meyron-Holtz et al., 2004a). Taken together, IRP expression is essential, but the two proteins are largely redundant. Experiments with animals and cultured cells show that the two IRPs respond differentially to non-iron signals. For example, hypoxic conditions inactivate IRP1 by favoring its aconitase activity (Meyron-Holtz et al., 2004b) while stabilizing IRP2 as a result of the oxygen requirement for iron-mediated FBXL5 degradation. Furthermore, reactive oxygen species selectively activate IRP1 by causing disassembly of Fe/S clusters (Pantopoulos and Hentze, 1998). Phosphorylation of IRP1 and IRP2 by specific kinases can also regulate their activity although the exact physiology remains to be determined, it could in principle allow cells to finely control iron metabolism over a wide range of conditions and to alter the set points of the two regulatory proteins independently from iron control.
14
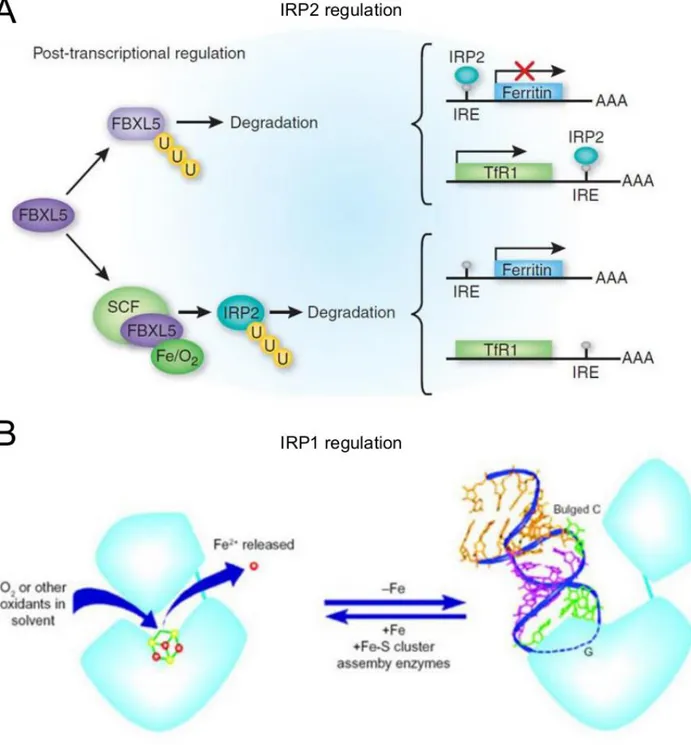
Figure 1.3: IRPs proteins regulation. A) IRP2 is ubiquitinated by the SKP1-CUL1-FBXL5 E3 ubiquitin ligase complex in an iron-dependent manner and degraded. Under low iron conditions, IRP2 binds to specific sequences in the untranslated regions of mRNA that encode proteins involved in iron acquisition and storage. Binding of IRP to a 5′-IRE inhibits mRNA translation, and binding to a 3′-IRE increases mRNA stability. In the presence of iron, there is an increase in the stability and thus concentration of the FBXL5-containing E3 SCF ubiquitin ligase. This E3 ligase ubiquitinates IRP2, leading to its degradation by the proteasome. The loss of IRP2 allows translation of 5′-IRE–containing mRNA and degradation of 3′-IRE–
15 containing mRNA. B) IRP1 is a bifunctional protein that can exist as a functional cytosolic aconitase when it binds an iron-sulfur cluster, interconverting citrate and isocitrate, or can bind IRE to regulate the expression of iron genes. The active site cleft that is responsible for aconitase activity overlaps with the region that binds to IRE, and binding of the sulfur cluster prevents the binding with IRE. In iron-replete conditions, IRP1 will have an iron-sulfur cluster and will not bind IRE.
Although the model described above holds true also for the CNS, it should be noted that iron metabolism probably differs between neurons, astrocytes, oligodendrocytes and microglia, as each of these cell types has distinct metabolic requirements and morphological features. In fact, it has been shown that the amount of each iron-management protein varies greatly depending on the cell type and its iron status. In the brain, oligodendrocytes stain strongly for transferrin (TF), whereas microglia and astrocytes stain most strongly for ferritin (FTH, FTL), and neurons stain strongly for transferrin receptor (TFRC). CP is mostly expressed by astrocytes and exposed on the membrane surface or released in the cerebrospinal fluid (CSF) (Rouault T, 2013). Although both IRP proteins are expressed in all cells types, IRP2 result much more expressed in the CNS (Meyron-Holtz et al., 2004). Thus, it appears likely that each resident CNS cell type regulates its own iron homeostasis, distributing and storing iron according to the particular needs and functions of each cell type. Nevertheless, there is some specialization of iron metabolism within the brain: astrocytes express CP, instead transferrin is synthesized and secreted into CSF mainly by oligodendrocytes. The secreted transferrin binds iron that has been imported into the CNS and newly constituted holo‑ transferrin redistributes iron to cells exposed to CSF and interstitial fluid (Rouault T, 2013).
16
1.4 Age-dependent iron deposition
Age-dependent iron accumulation has been described so far in different model organisms such us: C. elegans (Klang et al., 2014), D melanogaster (Massie et al., 1984), M. musculus (Massie et al., 1983) and H. sapiens (Acosta-Cabronero et al., 2016) (figure 1.4). In the human brain, iron accumulates especially in areas primarily associated with motor activity, including the globus pallidus, red nucleus, dentate nucleus and substantia nigra, but the factors that induce regional iron accumulation remain unknown. In the 1950, Hallgren and Sourander (1958) reported non-heme iron accumulation in several regions of the aged human brain such as putamen, motor cortex, prefrontal cortex, sensory cortex and thalamus (Hallgren and Sourander 1958). In 1983, Massie HR reported age-dependent iron accumulation in different rodent organs (brain, liver, kidney, heart) (Massie HR et al., 1983). In addition to these observations, studies in post-mortem brains showed an age-dependent accumulation of ferritin, indicative of increased storage iron in different brain regions (Thomas et al. 1993; Connor et al. 1995; Zecca et al. 2001). Recent studies using high-field magnetic resonance imaging and quantitative susceptibility mapping (QSM) (a new post-processed MRI contrast mechanism) confirmed increased iron levels in several deep brain nuclei and across motor, premotor, posterior insular, superior prefrontal, and cerebellar cortices, suggesting that iron accumulation with age predominantly affects brain regions involved in motor/output functions (Pfefferbaum et al. 2009; Aquino et al. 2009; Peran et al. 2009; Cherubini et al. 2009; Acosta-Cabronero et al., 2016). Age-dependent enhanced iron deposition was described also in microglia, in older individuals (60–90 years of age) compared with younger subjects (28–49 years), intense iron staining is observed in the microglia and astrocytes of the cortex, cerebellum, hippocampus, basal ganglia and amygdala, and ferritin immunoreactivity is also stronger in these cells (Zecca et al., 2004). Oligodendrocytes contain the largest amount of iron, ferritin and Tf, but this content remains constant during ageing suggesting the presence of a tight control and buffering mechanisms (Connors JR et al., 1990). Moreover, it has been showed that iron deposition occurs also in extracellular spaces as direct
17
consequence of micro-hemorrhages. Brain micro-bleeds and superficial siderosis are two conditions commonly observed in older patiens. Brain micro-bleeds, tiny deposits of blood degradation products contained within macrophages, are in close spatial relationship with structurally abnormal vessels (Martinez- Ramirez et al. 2014). Superficial siderosis manifests in the sub-pial layers of the brain as hemosiderin accumulation, due to recurrent and persistent bleeding into the subarachnoid space (Kumar 2009). Even if it is still matter of debate, the prevailing opinion is that iron imbalance, in particular the age-dependent iron deposition, may play a central role in the aging process due to its ability to produce oxygen reactive species, which over time causes extensive mitochondrial and cellular dysfunction. For instance, dietary iron supplementation has been shown to reduce lifespan both in nematodes (Klang et al., 2014), especially in C. elegans, iron addition accelerates the aging process and promotes protein aggregation especially of ribosome and mitochondria key proteins (Klang et al., 2014). Instead, increase in longevity can be induced by applying caloric intake restriction (Lee CK et al., 1999; Mair W et al., 2008; Piper DWM et al., 2011) as it appears to reduce both the production of ROS (Lee CK et al., 1999; Masoro EJ, 2000), as well as decrease iron deposition both in old mice and monkeys (Kastman EK et al., 2010; Wei S et al., 2014). Promoting antioxidants or using iron chelant therapy has been shown to increase longevity in animal models such as Caenorhabditis elegans, Drosophila melongaster and yeast (Massie HR et al, 1993; Melov S et al, 2000; Bonilla E et al., 2002; Gakh O et al., 2006). Strikingly, a recent work lead by Schiavi A and collegues argued that mitochondria iron starvation extends lifespan in C. elegans throught the activation of mitophagy (Schiavi A et al., 2015).
18
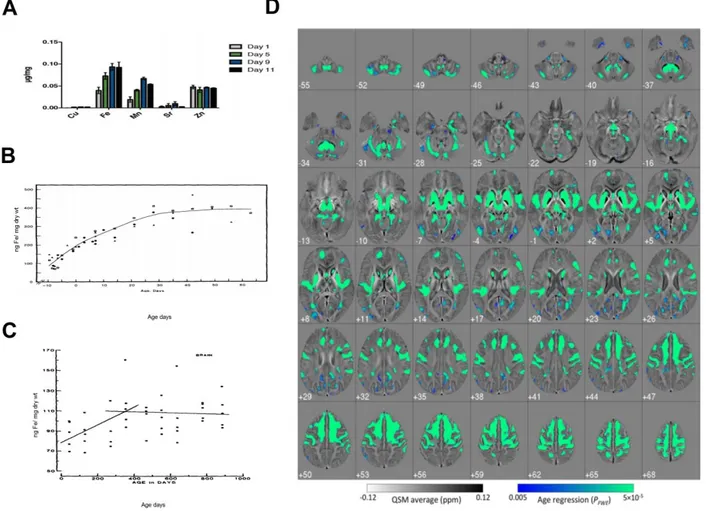
Figura 1.4. Age dependent iron accumulation. A) Alteration of the metal profile with age in C. elegans (Klang et al., 2014). B) Whole-body iron concentration versus age in days for male Oregon R Drosophila melanogaster for both developmental and adult stages at 25°C (Massie et al., 1984). C) Iron content versus age for brain from C57BL/6J male mice for ages 45-355 days (Massie et al., 1983). D) whole-brain imaging approach known as quantitative susceptibility mapping (QSM) provides insights into iron accumulation in the brain across the adult lifespan. Correlation between QSM and age in 116 healthy subjects (20 –79 years old). Iron deposition due to aging is spatially selective. Strong positive correlations, markedly bilateral and confluent, were identified in several cortical and subcortical regions. In deep gray matter, this included the striatum (putamen and caudate nucleus), mesencephalic structures (substantia nigra and red nucleus), diencephalic structures (subthalamic nucleus, mammillary bodies, parts of medial, and posterior thalamic subnuclei groups), and the cerebellar dentate nucleus. QSM co-varied with age in the sensory-motor cortex; this was extensive and confluent in superior premotor cortex, prefrontal, insular areas, and dorsomedial frontal cortices down to the cingulate sulcus and cerebellar cortex; and in supra-marginal and posterior para-hippocampal gray matter and was minor in the posterior cingulate and precuneus cortical regions. White matter QSM relationships, conversely, were overall weaker (Acosta-Cabronero et al., 2016).
19
1.5 Iron toxicity and neurodegenerative disease
Excessive brain iron accumulation results in a large increase in the chelatable free iron pool that exceeds the sequestering capability of ferritin within cells (Breuer, Greenberg, & Cabantchik, 1997). Studies in hepatocytes treated with FeSO4 showed significant
cellular damage with a large increase in cellular iron, but without a significant increase in the total amount of ferritin. These findings further suggest that iron-induced cellular damage is dependent on ferritin iron incorporation (Cable, Connor, & Isom, 1998). Moreover, it has been suggested that iron accumulation may induce neuronal damage even after it has become bound to ferritin because iron can be released in its ferrous form under acidic conditions (Bishop, & Robinson, 2001) and through interaction with components such as excess superoxide radicals (Siesjö, Agardh, & Bengtsson, 1989). Conditions such as intracerebral hemorrhage or hypoxia-ischemia further aggravate the potential for iron release from transferrin or ferritin due to a decrease in pH (Ying, Han, Miller, & Swanson, 1999). Iron toxicity is largely based on Fenton chemistry, iron reacts with reactive oxygen intermediates, including hydrogen peroxide (H2O2) and the
superoxide anion (O2-) both byproducts of aerobic metabolism and produces highly reactive free radical species such as the hydroxyl radical (OH.).
Fe2+ + H2O2 → Fe3+ + OH. + OH
-Reduction of the oxidized form of iron by ascorbate or other cellular reductants regenerates the Fenton active form of iron (Fe3+ + O-2 → Fe2+ + O2) which re-enters the
oxidation-reduction cycle, a process called redox cycling. Thus, a continuous production of free radicals perpetuates under these conditions. Ferrous iron is a 5-fold greater pro-oxidant as compared to ferric iron (Rauhala & Chiueh, 2000) and if sufficient iron is present, free radical production will overcome the cellular antioxidant mechanisms and cause massive production of free radicals. As a consequence, ROS damage DNA and mtDNA, oxidise proteins and lipids. Peroxidation of polyunsaturated fatty acids in membrane lipids can generate highly reactive aldehydes, such as 4-hydroxynonenal,
20
which irreversibly modify proteins by carbonylation. ROS can induce the release of iron from mitochondrial iron–sulphur cluster proteins of the respiratory chain and other iron storage proteins, which will lead to further ROS production via Fenton’s reaction (Dixon & Stockwell, 2014; Melis, van Steeg, & Luijten, 2013). Cathecolamines, such as dopamine, might be oxidized to highly reactive or toxic quinones either via the reduction of ferric iron or enzymatically (Paris et al., 2005). The aggregation of proteins involved in neurodegenerative disorders (APP, α-synuclein and hyper-phosphorylated tau protein) has been shown to be triggered in vitro by elevated ferric iron concentrations (Mantyh et al., 1993; Li, Jiang, Song, & Xie, 2010; Yamamoto et al., 2002). The proteolytic activation of the inactive forms of α secretase and β secretase is modulated by furin. Excessive amounts of total iron will decrease furin activity since transcription of furin is modulated by cellular concentrations of iron, leading to decreased furin protein concentrations which thereby favours β-secretase activity and enhances the amyloidogenic pathway. By contrast, iron deficiency will increase furin activity, thereby enhancing α secretase and stimulating the non-amyloidogenic pathway (Wichaiyo et al., 2015). Iron modulates APP processing through the interaction of IRPs with a putative IRE in the 5’-untranslated region of its mRNA. APP translation therefore is up-regulated in conditions of iron excess, increasing the amount of APP available to enter the amyloidgenic pathway, which is favoured by decreased furin activity (Rogers et al., 2002). Moreover, APP was suggested to have ferroxidase activity and to physically interact with the carrier protein ferroportin improving its ability to export iron across membrane (Duce et al., 2010). Microtubule-associated protein tau (MAPT) deficiency induces intracellular iron accumulation, which causes degeneration of dopaminergic neurons, leading to parkinsonism with dementia in mice (Lei et al., 2012). Tau deficiency impairs ferroportin iron export by retaining APP in the endoplasmic reticulum so that it can no longer be trafficked to the neuronal surface, where it can couple its ferroxidase activity to ferroportin. In Parkinson’s disease spectroscopic methods measured total iron concentrations in specific brain regions, such as substantia nigra pars compacta and reticulate and revealed that iron concentrations in these regions increase with disease severity (Dexter et al., 1989). Ferric iron can, in vitro,
21
catalyse the conversion of α-synuclein from the α-helix to the β-sheet conformation that is present in Lewy bodies (Uversky, Li, & Fink, 2001). A contributing factor to the increased iron accumulation in Parkinson’s disease might be increased DMT1 activity or decreased ferroxidase activity of ceruloplasmin, both of which would increase total intracellular iron, as reported in an animal model of Parkinson’s disease (Salazar et al., 2008; Olivieri et al., 2011).
1.6 MicroRNA and aging
MicroRNAs (miRNAs) are abundant non-coding RNAs around 20–22 nucleotides in length, which are emerging as important key players in the regulation of gene expression. MiRNAs are transcribed by RNA Polymerase II (i.e., the same Polymerase which transcribes protein-coding RNAs) as long transcripts called primary transcripts (pri-microRNAs) and undergo a complex processing before being included in a ribonucleic complex. Pri-miRNAs contain one or more miRNAs within hairpins. These hairpins are cleaved from the pri-miRNA transcript in the nucleus by the Microprocessor complex, which consists of the RNA-binding protein (RBP) DGCR8 and the RNA endonuclease Drosha. The resulting pre-miRNA hairpins are transported to the cytoplasm where they are further processed into approximately 21‑nucleotide-long double stranded RNAs (dsRNAs) by the endonuclease Dicer. Several miRNAs can be grouped in a genomic cluster and co-transcribed, and may be hosted within an intron of a protein-coding gene. MiRNAs bind, due to sequence complementarity, to specific sites in the 3′ untranslated region of their target mRNAs, thereby silencing expression of the gene product via translational repression and/or mRNA degradation. Indeed, they represent a new level of gene regulation acting at the post-transcriptional level. Up to now, several thousands of miRNAs have been predicted and identified in animals, plants and viruses (http://www.mirbase.org). A feature of miRNAs is their combinatorial regulation: a given miRNA can target a multitude of different mRNAs and a given target might similarly be
22
targeted by multiple miRNAs; for this reason, they frequently represent the central nodes of several regulatory networks and may act as rheostat to provide stability and fine-tuning to gene expression networks (Osella et al., 2011; Siciliano et al., 2013). Moreover, they are promising candidates for functional studies by genome-wide transcriptional analysis, thanks to some specific features: (i) miRNAs are highly conserved in vertebrates (cases of 100% identity between fish and mammals are not uncommon) and are thought to be an evolutionarily ancient component of genetic regulation; (ii) in a single tissue, relatively few miRNAs are expressed (hundreds vs. tenths of thousands mRNAs); (iii) they represent in their context the biologically active molecule, since they directly bind and control the target mRNAs: measurements of miRNA concentrations allow a more direct inference of a biological function. The ability to regulate multiple targets simultaneously makes miRNA a crucial regulator in many physiological conditions, including aging, which is a complex process involving multiple interconnected signaling pathways. An emerging concept is that microRNAs are crucial to restore homeostasis upon transient environmental changes, or, if these changes are prolonged, enforce a new gene expression program so cells can tolerate the new environment. This concept is based on the observation that cells or intact organisms with deficiency of a single microRNA very often are apparently unaffected, but exhibit a phenotypic crisis under stress condition (X. Li, Cassidy, Reinke, Fischboeck, & Carthew, 2009). If aging is considered as a long-term exposure to a broad type of stressors that tend to change tissue homeostasis, the buffering activity operated by microRNAs on the global gene expression could be of fundamental importance. The role of specific miRNAs in regulating the aging processes was established only recently. Only about ten years ago, it was observed for the first time that overexpression of a microRNA (lin-4) increases lifespan of C. elegans (Boehm & Slack, 2005). To date, numerous miRNAs were reported to be significantly up- or down-regulated with aging, both in invertebrate and vertebrate species (Somel et al., 2010; Ibáñez-Ventoso et al., 2006). In C. elegans, more than 50 of the ~200 known miRNAs are differentially expressed during aging (de Lencastre et al., 2010; Ibanez-Ventoso et al., 2006; Kato et al., 2011). Remarkably, although some key miRNAs, such as miR-34 and
23
miR-71, are upregulated during aging, the vast majority of C. elegans miRNAs that are differentially expressed during aging are downregulated (de Lencastre et al., 2010; Ibanez-Ventoso et al., 2006), while in mammals have been reported a general up-regulation of tissue specific microRNAs was reported (Maes et al., 2008; Li et al., 2009) This suggests the existence of possibly important differences between global and tissue-specific miRNA expression, or between the role of microRNAs in the biology of aging of worms and mice aging biology (Li et al., 2011a; Maes et al., 2008). MiR-34 and miR-71, are upregulated microRNAs during aging in C. elegans and were shown to affect aging phenotypes and modulate longevity. Loss of function of mir-34 results in extended lifespan and increased resistance to heat and oxidative stress (Yang et al., 2013). MiR-71 targets the PI3K AGE-1 and PDK-1 components of the IIS pathway, is upregulated during the starvation-induced diapause state known as the dauer and during the post-dauer recovery stage (Karp et al., 2011), suggesting that this miRNA functions in the cellular response to environmental stress. Indeed deletion of miR-71 impairs survival during dauer and shortens lifespan while overexpression of miR-71 extends lifespan (Boulias & Horvitz, 2012). Overexpression of miR‑246 or deletion of mir‑239 also have been reported to extended C. elegans lifespan (Boulias & Horvitz, 2012; De Lencastre et al., 2010; Yang et al., 2013). While miR-71, miR-246 and miR-239 are not evolutionary conserved, miR-34 is present in flies and vertebrates. In D. melanogaster, miR‑34 expression increases during ageing and deletion of mir‑34 accelerates brain degeneration and shortens lifespan. Elevated expression of miR‑34 increases median lifespan and mitigates neurodegeneration induced by human pathogenic polyglutamine disease protein (Liu et al., 2012). In mammals also, miR‑34 exhibits up-regulation during aging in different tissues (heart, brain). In contrast to the protective roles of D. melanogaster miR ‑34 but similarly to C. elegans, high level of miR‑34a in murine models contribute to the age-related decline of cardiac functions. Indeed, genetic deletion or antagomir-mediated silencing of mir‑34a improved the performance of aged heart, suggesting that mouse miR ‑34a could be a driving factor during heart ageing (R. a Boon et al., 2013). To date, the
24
demonstration that miRNAs regulate pathways that eventually lead to modulations of lifespan, as described above, exist only for invertebrates, whereas studies in vertebrate species (mainly mouse and human) focused to investigate miRNAs roles in regulating tissue- and cell-type-specific aging phenotypes. In fact, in vertebrates, although some microRNAs such as: mir-29, mir-34 or mir-17-92 are found commonly up- or downregulated among different tissues during aging, the available evidence indicates that each tissue/organ age in a different way exhibiting a specific age-dependent gene and microRNA expression profile. For instance mouse miR-22, miR-101a, miR-720 and miR-721 are specifically up-regulated in brain but not in other organs (Li et al., 2013), instead mir-93, mir-214, mir-669c and mir-700 are up-regulated specifically in liver and mir-7, mir-468, mir-542, mir-698 are up-regulated in muscle (Smith-Vikos & Slack, 2012). Due to this diversity in tissue -specific microRNA expression profile, the effects are also quite different among tissues. For instance, the age-dependent regulation of some microRNA seems to have a detrimental effect exacerbating age-associated dysfunctions in some organs and to protect from age-associated dysfunctions in other organs triggering an adaptive response to damage. In the liver, miR-93, miR-214 and miR-669c all target glutathione-S-transferases, which are crucial for oxidative defense, and cytochrome c complex (UQCRC1), important for mitochondrial function or maintenance, indicating that these microRNAs operates repressing factors that normally maintain an healty liver (Maes, An, Sarojini, & Wang, 2008) and might be considered pro-aging microRNAs. Another example of pro-aging microRNA, as described above, is the age-dependent mir-34 upregulation that is associated with decreased heart performance in mouse. Mir-34 inhibition reduces cell death and fibrosis following acute myocardial infarction and improves recovery of myocardial function through the upregulation of the protein PNUTS that reduces telomere shortening, DNA damage responses and cardiomyocyte apoptosis (R. a Boon et al., 2013). Brain upregulation of mir-101a, mir-22, mir-720 (and other microRNA) seems to play a crucial role repressing genes involved in the oxidative phosphorylation, decreasing the respiration rate in age-dependent manner (N. Li, Bates, An, Terry, & Wang, 2011). Since reduction in oxidative phosphorylation
25
correlates with longer lifespan (Dillin et al., 2002; Copeland et al., 2009; Baumgart et al., 2016), these microRNA might be considered to have an anti-aging effect. On the contrary, let‑7b expression in the nervous system increases with age and contributes to the decline of the self-renewal capacity of neural stem cells by targeting the chromatin factor HMGA2 (Nishino, Kim, Chada, & Morrison, 2008). One of the most relevant aging-related phenotype is cellular replicative senescence, i.e. the irreversible exit from the cell cycle of mitotically-competent cells. In recent years, it was reported that cellular senescence occurs in vivo and significantly contributes to aging-related dysfunctions. Mice selectively depleted of senescent cells exhibit an attenuated progression of age-related disorders like cataract, sarcopenia and spinal cord curvature (Baker et al., 2011). To date, many senescence-associated microRNAs were identified. For instance, in endothelial progenitor cells P53 upregulates mir-34 that in turn repress SIRT1 and activates FOXO1-mediated senescence (Zhao et al., 2010). In mammals, miR‑29 family miRNAs are upregulated in multiple tissues with increasing age, as well as in a mouse model of progeria syndrome. Induction of miR‑29 is associated with DNA damage responses and depends on the activation of the tumor suppressor p53 (Ugalde et al., 2011). The 29 along with miR-30 families are upregulated during cellular senescence as well, and their upregulation requires activation of the Rb pathway (Martinez et al., 2011). The miR-17-92 cluster represent another microRNA family with strong implication in the aging phenotype, along with its paralogous clusters miR-106a-363 and miR-106b-25, it has been shown to sustains cell cycle progression and survival, repressing numerous target genes such us: p21, p27, p57, PTEN, RB1 (Grillari, Hackl, & Grillari-Voglauer, 2010). However miR-17-92 has been shown also to be oncogenic and to promote tumorigenesis (Olive et al., 2009). Expression of these clusters are downregulated during aging in multiple cells types (Hackl et al., 2010; Baumgart et al., 2012, Terzibasi Tozzini et al., 2015). Mir-17-92 age-dependent downregulation is associated with increased expression of PTEN, that acts as a negative regulator of the m-TOR pathway (Olive et al., 2009) and regulates via this pathway neurogenesis and neurite outgrowth (Zhang et al., 2013; Bian et al., 2013). In
26
conclusion, the age-dependent downregulation of mir-17-92 on one hand reduces the cell cycle progression reducing the cancerous event and on the other hands it has been suggested to reduce activity of the mTOR pathway, whose negative modulation is associated with a delay of the aging phenotype and extended lifespan. These studies suggest that microRNAs can have context-dependent functions during ageing and that they can regulate diverse aspects of ageing at the level of the organism as well as of individual organs.
1.7 MicroRNA and iron homeostasis
Iron appears to play a critical role in miRNA processing via its physiological role as the functional component in heme. This potential role for iron to participate in miRNA biogenesis was first demonstrated when DGCR8 was identified as a heme-binding protein (Faller, Matsunaga, Yin, Loo, & Guo, 2007). Heme binds to DGCR8 via its Fe (III) iron co-factor and greatly increases pri-miRNA processing, instead impaired ability to synthesize heme, as a result of inadequate iron, consistently decreases pri-miRNA processing (Faller et al., 2007). Heme excess also produces changes in miRNA profiles, suggesting that it strongly influences the modulation of targeted mRNA expressions (Bonkovsky et al., 2013). Recently, it has been reported that cytosolic iron, but not heme-bound iron, regulates the activity of the miRNA pathway through poly(C)-binding protein 2 (PCBP2). PCBP2 is associated with Dicer and promotes the processing of miRNA precursors (Höck et al., 2007). Given that iron affects microRNA processing, there are many example of how microRNAs influence iron homeostasis as well. Systemic iron homeostasis is likely influenced by miRNA expression via the liver-specific miR-122. Inhibition of miR-122 by locked nucleic acid (LNA) modified oligonucleotides is associated with an increased expression of hemochromatosis gene (HFE), hemojuvelin (HJV or HFE2), bone morphogenetic protein receptor type 1a (BMPR1A), and hepcidin (HAMP) mRNA, all contributing to a reduction in both plasma and liver iron compromising hematopoiesis
27
(Castoldi et al., 2011). Moreover, it has been suggested that microRNAs might integrate the IRE-IRPs system. In fact, many of the genes regulated by IRP proteins, also generate spicing variants that lack the 5’ or 3’ IRE sequence and were shown to be regulated exclusively by iron-responsive microRNAs. In duodenal and erythroid precursor cells, was reported that the most abundant splice variant of the Ferroportin (FPN) mRNA lacks the IRE sequence within the 5’UTR (Zhang, Hughes, Ollivierre-Wilson, Ghosh, & Rouault, 2009) and it is targeted by iron-responsive mir-485 which is induced during iron deficiency and represses FPN expression by directly targeting the FPN 3'UTR (Sangokoya, Doss, & Chi, 2013). In hematopoietic precursor cells, divalent metal transporter 1 (DMT1), exhibits alternative splicing at 3' UTR, differing by the inclusion of a specific sequence either containing or lacking an IRE element (+IRE and -IRE, respectively). DMT1-IRE expression is under the regulation of miR-Let-7d and it is necessary for the erythroid differentiation (Andolfo et al., 2010).
1.8 microRNA mir-29 family in the CNS
MiR-29 family members (miR-29a, miR-29b and miR-29c) are absent in invertebrates but are extremely conserved among vertebrate species. In mammals, they are produced from two intergenic loci and are one among the most expressed microRNA families (Landgraf et al., 2007). They are enriched in the CNS (Nolan et al., 2014), are expressed both in neuronal and glial cells and their binding sites are highly overrepresented in brain mRNAs co-immunoprecipitated with argonaute complex (Boudreau et al., 2014). During brain development of rodents and primates, miR-29 is expressed at low levels and its expression dramatically increases during late post-natal development and continues to increase during entire adult life and aging in humans and non-human primates (Somel et al., 2010; Podolska et al., 2011; Fenn et al., 2013). In addition, age-dependent up-regulation of miR-29 was observed also in other organs such us heart, lung, liver, kidney of mice, and aorta of both mice and humans (R. A. Boon et al., 2011; Takahashi, Eda,
28
Fukushima, & Hohjoh, 2012; Ugalde et al., 2011). Therefore, up-regulation of miR-29 seems to be a conserved hallmark of aging. Although the molecular mechanism that induces mir-29 up-regulation is unknown, the magnitude of the increase in its expression during post-natal development observed in the CNS tissues, along with defects observed in the knock-out mice models, suggest that mir-29 might promote neuron maturation and survival in the CNS.Mice lacking only the 29b/a-1 locus (therefore with residual miR-29 activity) reach adulthood, display an ataxic phenotype and a mild loss of Purkinje cells in the cerebellum and die around 9 months of age (Papadopoulou et al., 2015). A similar cerebellar phenotype is induced acutely by injections of miR-29 antagomiR (Roshan et al., 2014). Remarkably, mice with a targeted deletion of both miR-29 loci, although born without evident abnormalities, rapidly accumulate defects during post-natal development and die within the age of 6 weeks (Cushing et al., 2015), suggesting that this microRNA family has a pivotal role during post-natal development and adult life. Interestingly, Siegel and colleagues identified miR-29a as one of the most enriched microRNA in rat forebrain synaptosomes (Siegel et al., 2009). After that, it has been observed that fear conditioning and glutamate receptors activation increase the endogenous level of miR-29a in hippocampus and in primary neurons respectively indicating that neural activity may modulate the expression of miR-29a (Lippi et al., 2011; H. Li et al., 2014). At molecular level, miR-29 reduces the expression of doublecortin (DCX) and actin-related protein 2/3 complex subunit 3 (ARPC3) enhancing the axon branching and reducing mushroom-shaped dendritic spines on hippocampal neurons respectively (Lippi et al., 2011; H. Li et al., 2014). In addition, up-regulation of miR-29 protects neurons against apoptosis during neuronal maturation, forebrain cerebral ischemia and stroke by targeting pro-apoptotic members of the BCL-2 family (Kole AJ et al., 2011; Ouyang YB et al., 2013; Khanna S et al., 2013). Interestingly, this microRNA family was found to target Beta-Site APP-Cleaving Enzyme (BACE1) mRNA and to be downregulated in sporadic Alzheimer’s disease (Hébert et al., 2008). Overall, these data strongly suggest a conserved key role for miR-29 family in protecting neurons from different kind of damage and possibly against aging.
29
1.9 Nothobranchius furzeri
Aging process consists in broad changes that occur at molecular, cellular and integrated level and include systemic factors. Due to its complexity, the use of an in vivo approach is the only possible approach to shed light on the organismal and systemic mechanisms underlying the aging process. Several species have been used to study ageing and age-related diseases so far, the selection being partially based on practical and economic considerations. C. elegans and D. melanogaster have been widely used in aging research due to their small size and short lifespan. It is possible to rapidly generate mutant strains and perform high throughput screening. Despite of these advantages, invertebrate models show several morphological, histological and physiological differences to the vertebrates, making difficult the translation of these findings to humans. For instance, at anatomical level, they lack of bone, adaptive immune system and a centralized nervous system. Most importantly, vertebrate-specific pathways cannot be studied in these models. The mouse is the most widely used model system to investigate the biology of aging. However, it shows some practical disadvantages: the lifespan is relatively long (about 2-3 years) making life-long investigations impractical and it is economically much more expensive as compared to the other organism mentioned above. Therefore, it has been suggested that fish may represent a compromise between invertebrates and mammals. If zebrafish or medaka are considered, they are small in size, easy to keep and very prolific, allowing a large number of individuals to be maintained in small rooms with less expediture of time and financial resources. Aging pathways are conserved between fish and mammals (Van Houcke, Groef, Dekeyster, & Moons, 2015). Nothobranchius furzeri, the turquoise killifish, is an aquarium fish from Mozambique and in recent years became a promising model organism to study the biology of vertebrate aging. This fish is small in size (about 4-5 cm long), relatively easy to keep and maintain in captivity due to a rapid growth and high fecundity. The lifespan is exceptionally short as compared to other vertebrate species (figure 1.5A), although there are different strains with different life expectancy depending on the different permanence and duration of the rainy season in
30
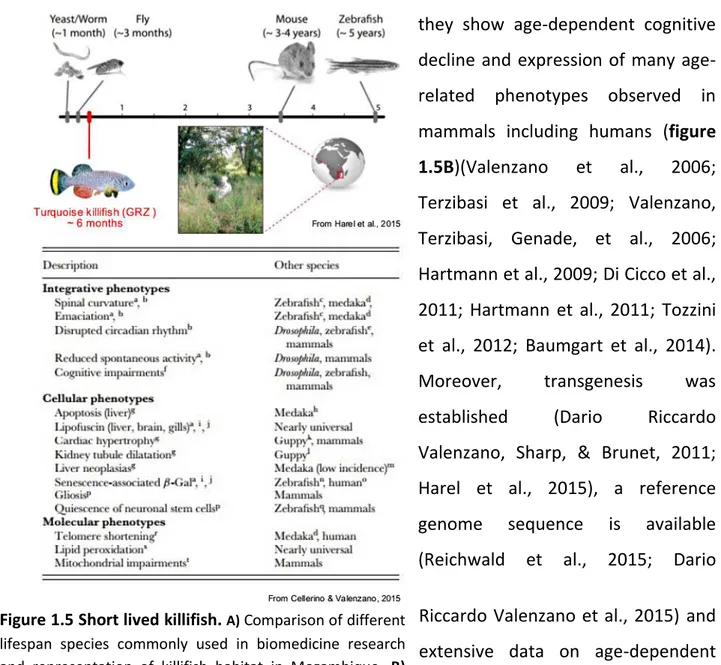
each habitat (Terzibasi et al., 2008; Polačik, Donner, & Reichard, 2011; Tozzini et al., 2013), all of them exhibit a maximum captive lifespan generally lower than one year (Valdesalici & Cellerino, 2003). Of particular interest is the GRZ strain, that exhibits the shortest recorded lifespan among all the different killifish strains, with a maximum captive lifespan of only 5-6 months (figure 1.5A) (Terzibasi et al., 2008; Kirschner et al., 2012). Despite this short lifespan, they show age-dependent cognitive decline and expression of many age-related phenotypes observed in mammals including humans (figure 1.5B)(Valenzano et al., 2006; Terzibasi et al., 2009; Valenzano, Terzibasi, Genade, et al., 2006; Hartmann et al., 2009; Di Cicco et al., 2011; Hartmann et al., 2011; Tozzini et al., 2012; Baumgart et al., 2014).
Moreover, transgenesis was
established (Dario Riccardo
Valenzano, Sharp, & Brunet, 2011; Harel et al., 2015), a reference genome sequence is available (Reichwald et al., 2015; Dario Riccardo Valenzano et al., 2015) and extensive data on age-dependent gene regulation are available (Baumgart et al., 2014). Therefore N. furzeri represents a novel model organism to investigate the genetic control of aging.
Figure 1.5 Short lived killifish. A) Comparison of different lifespan species commonly used in biomedicine research and representation of killifish habitat in Mozambique. B) Table reassuming different aging traits observed in N.furzeri and in other species.
31
2 AIM OF THE PROJECT
Recently, Baumgart et al, has shown a consistent age-dependent mir-29 up-regulation in Nothobranchius furzeri brain, liver, skin and heart. Mir-29 resulted one of the few microRNA (along with mir-27) to be coherently up-regulated during aging in all tissues analyzed. These data, obtained in killifish, are in complete agreement with data previously reported in mammals (mouse and humans), indicating that different vertebrates species share an evolutionary conserved mir-29 age-dependent regulation. In vitro and in vivo evidence suggested a general protective role of mir-29 against different stress or insults (e.g: apoptosis, ischemia, cancer progression). Mir-29 knockout mouse model revealed that the CNS is one of the most affected tissues by mir-29 absence, moreover mir-29 reduction has been described during sporadic form of Alzheimer disease, one of the most relevant age-associated diseases.
Although all these data suggests a relevance for mir-29 in the regulation of aging process, little is known about its function during adult life and aging, especially in the CNS.
Here, I evaluated the biological activity of mir-29 during the adult stages of life in the killifish brain. In particular, I investigated whether neuronal-specific mir-29 loss of function could have a detrimental effect and affect the aging process in killifish brain.
32
3 RESULTS
3.1 Iron accumulates in Nothobranchius furzeri brain.
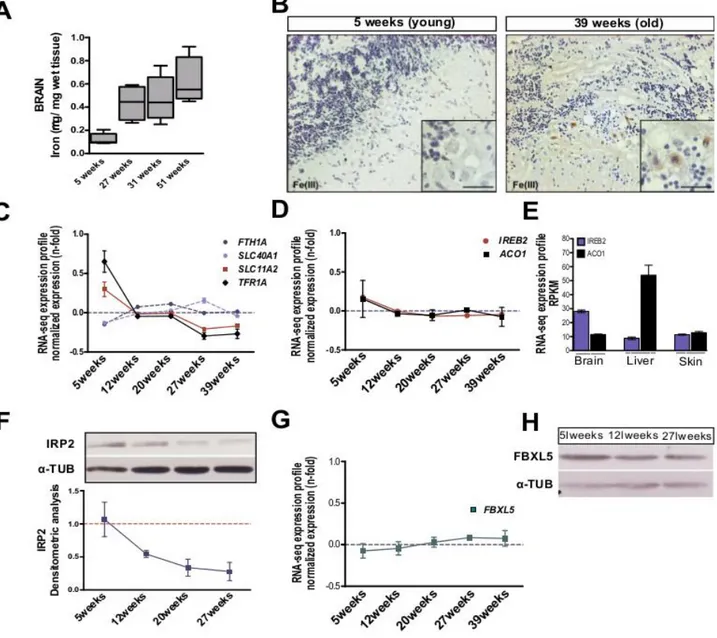
I investigated age-dependent brain iron accumulation in N. furzeri MZM 04/10pl, a strain with a median lifespan of ~ 30 weeks (Terzibasi et al., 2008, 2009; Baumgart et al., 2014). Brain non-heme iron concentration was quantified using a colorimetric assay (Rebouche et al., 2003) in fish of five age groups: 5, 27, 31, 51 weeks. These age steps correspond to sexual maturity (5 weeks), median lifespan (27 weeks), old and very old stages (31 and 51 weeks). I found that iron content increases over time as previously described in mammals (Hallgren et al., 1958; Bartzokis et al., 1997). From 5 to 51 weeks of age, iron amount increases almost 6-fold in animals (fig. 2.0 A). This datum was corroborated by histochemical Pearl’s staining with DAB intensification on brain sections. Increased labelling was apparent in the brains of older fish, particularly in Purkinje cell layer of the cerebellum (Fig. 2.0 B). I also investigated the expression of genes coding for key proteins of iron metabolism by interrogating a public dataset of genome-wide age-dependent transcript regulation in the N. furzeri brain at the same five age steps analyzed here (Baumgart et al., 2014). I observed that expression of the transferrin receptor (TFR1A) gene and the solute carrier transporter 11a2 (SLC11A2) gene, directly involved in intracellular iron delivery, significantly declines as a function of age (Fig. 2.0 C), with the largest difference observed between 5 weeks and 12 weeks of age. On the other hand, expression of the genes coding for ferritin heavy chain (FTH1A) and Ferroportin (SLC40A1), required for iron storage and discharge, are stable (Fig. 2.0 C). Since all of these genes are controlled by the IRE-IRPS system, I investigated whether expression of IREB2 and ACO1 mRNAs is age-dependent and did not detect significant regulation during aging (Fig. 2.0 D). IREB2 mRNA is higher-expressed in brain as compared to ACO1 mRNA, while the opposite is observed in the liver (fig. 2.0 E). These same differences in the relative expression levels of IREB2 and ACO1 between brain and liver were previously
33
observed in the mouse (Meyron-Holtz et al., 2004) and suggest that IREB2 is the principal regulator of iron homeostasis in the brain. In mammals, iron regulates IREB2 expression mainly at the post-translational level by iron-dependent proteasomal degradation of IRP2. As expected, Western blot analysis revealed that IRP2 decreases with age (fig. 2.0 F). Since IRP2 is negatively regulated by FBXL5, I evaluated also its expression at mRNA and protein level but in both cases no significant modulation over time was detected (fig. 2.0 G-H). These data suggest that iron progressively accumulates over time and age-dependent downregulation of IRP2 is not mediated by FBXL5.
Figure 2.0. Age dependent brain iron accumulation in Nothobranchius furzeri. A) Brain non-heme iron
34 and no differences were observed between the sexes (data not shown). B) DAB-enhanced Perl’s staining of the cerebellum of young and old fish. The black arrows point to labelled Purkinje cells. The inset in the bottom right corner of each picture shows a magnification of the Purkinje cells bodies. C-D) Age-dependent regulation of the transcripts coding for key genes of iron metabolism, from Baumgart et al., (2014). Expression values (in RPMKs) for each age were centered and scaled to the mean. E) Tissue specific expression of IREB2 and ACO1 mRNAs in N. furzeri brain, liver and skin, data from Baumgart et al., (2014). F) Representative Western blot of IRP2 in brain extracts and relative densitometric analysis at different ages. α-TUBULIN was used as loading control and values are normalized to the mean of 5 weeks values, n=3 biological replicates were used for each time point. G) Age-dependent expression of FBXL5 mRNA, from Baumgart et al., (2014). ANOVA for linear trend: R=0.1922, P=0.0688. Expression values (in RPMKs) for each age was centered and scaled to the mean, n= 5 animals for age point. H) Western blot of FBXL5 in brain lisates at three age point (5, 12 and 27 weeks). α-TUB was used as loading control. For C, D, E, G mean ± standard errors of means is reported and the significance of age-dependent modulation was assessed using 1 way ANOVA with post-test for trend.
3.2 MiR-29 is up-regulated with age in neurons and is
negatively-correlated with expression of its targets.
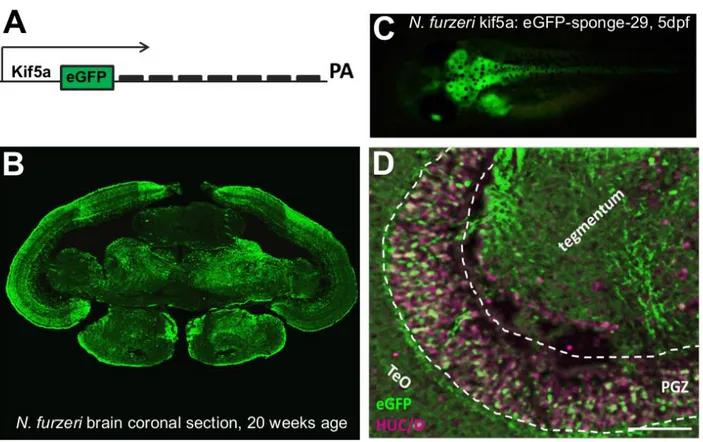
MicroRNA-29 is up-regulated with age in multiple tissues of N. furzeri including brain (Baumgart et al., 2012). To assess the effect of miR-29 on global age-dependent gene expression, I took advantage of RNA-seq data from N. furzeri brain at five ages (Baumgart et al., 2014) and performed microRNA-seq on the same samples. I confirm a monotonous increase of miR-29 expression with age (fig. 2.1 A). Further, I analyzed protein-coding genes with rapid age-dependent decay in expression (for details see Baumgart et al., 2014). This gene set was enriched for genes containing a miR-29 binding site as predicted by MiRanda (FDR <0.05, Fisher’s exact test). In addition, miR-29 targets showed an excess of negative correlation with miR-29 expression as opposed to non-targets (fig. 2.1 B). These data suggest that miR-29 is a regulator of age-dependent gene expression, as previously reported in primates using similar methods (Somel et al., 2010). I then investigated the transcriptional control of miR-29. The N. furzeri genome contains three loci for miR-29 family members but one is expressed at much higher levels. Transcription of the major miR-29 locus is up-regulated more than 15 times with age (fig. 2.1 C). I further used in situ hybridization to define miR-29 expression domains in the adult N.
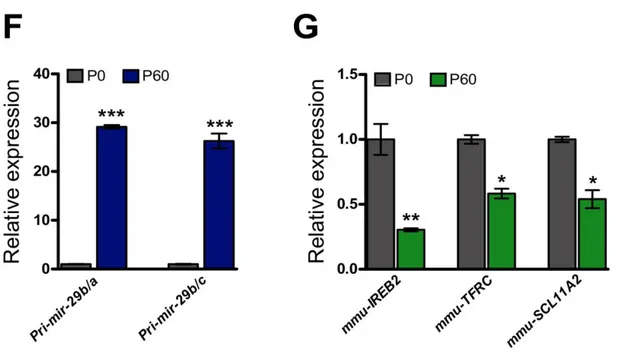
35 furzeri brain. I found this primary transcript intensely expressed in the periventricular gray zone (PGZ) of the optic tectum (fig. 2.1 D), and in the granular cell layer (GCL) of cerebellum (fig. 2.1 E), where it is co-localized with the neuronal marker HuC/D, thereby confirming neuronal expression of miR-29 originally reported in the mouse (Hébert et al., 2008). In addition, I investigated transcriptional control of miR-29 in the mouse brain since it was already shown that mature miR-29 dramatically increases during the first two months of postnatal life (Hebert S et al., 2008; Li H et al., 2013). Using RT-qPCR, I quantified the expression of both miR-29 primary transcripts in postnatal day 0 (P0) and P60 mouse cerebral cortex. As expected, both increased more than 30 times (fig. 2.1 F).
36
Figure 2.1. Regulation of miR-29 expression A) Expression profile for mir-29a according to NGS data of
Nothobranchius furzeri brain. Column height corresponds to the mean and error bars to the standard deviation (FDR < 0.05, Spearman’s rank correlation ρ=0.86). B) Correlation of mir-29 and its targets. Blue bars show the distribution of Pearson’s correlation between mir-29a and its predicted target. Light-blue bars show the distribution of values extracted from a bootstrap (p=10-14, Kolmogorov-Smirnoff). C) Age-dependent expression of miR-29 primary transcripts (Pri-miR-29-1, 2, 3) in the brain of N. furzeri. The relative expression was evaluated by RT-qPCR, data were normalized on TATA binding protein (TBP), pri-miR-29-2 results much more expressed than the other clusters and shows a clear age-dependent up-regulation (1 way ANOVA with post-test for trend: R= 0,5285 P<0,0001, n=4 animals for age group). D-E) Pri-miR-29-2 expression pattern in N. furzeri brain. (D) shows pri-miR-29-2 signal (red) and HuC/D expression (green) in the optic tectum (TeO). Pri-miR-29-2 shows a nuclear staining and a co-localization with neuronal marker HuC/D in all periventricular gray zone (PGZ), white arrows show neurons in the optic tectum (TeO) negative for pri-miR-29-2. Scale bar 50µm. Cerebellum overview picture (F) shows a clear and strong expression of pri-miR-29-2 just in the granular cell layer (GCL), it is instead is absent in the Purkinje cell (white arrow) and molecular layer (ML). Scale bar 100µm.
F) Quantification of pri-miR-29 cluster (pri-miR-29b-a; pri-miR-29b-c) in post-natal day 0 and 60 mouse
brain. Both primary transcript dramatically increase during post-natal development (P<0,001 and P<0,001 respectively). G) Relative expression of iron management genes IREB2 (P<0,01) TFRC (P<0,05), SLC11A2 (P<0,05) in post-natal day 0 and 60 mouse brain. Both for F and G statistical significance was calculated by Mann-Whitney’s U-test, n=6 (P0 brain) and n=7 (P60 brain) biological replicates.
37
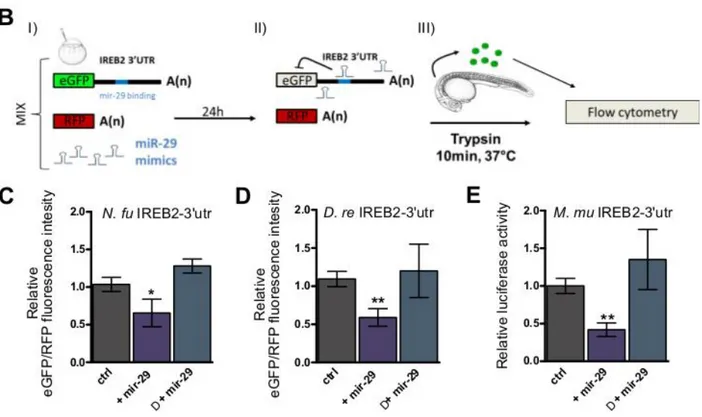
3.3 mir-29 family targets IREB2 mRNA
I noticed the presence of an 8 nt seed sequence in the 3’UTR of IREB2 mRNA that is evolutionary conserved in vertebrates (fig. 2.2 A) and both miRanda (Betel D et al., 2010) and TargetScan (Agarwal et al., 2015) retrieved IREB2 mRNA as a target for miR-29 in both fishes and mammals. In addition, StarBase provides support for a physical interaction of miR-29 and IREB2 3’-UTR in human and mouse (Li J et al., 2014). I assessed the regulation in expression of iron management genes such as IREB2, TFRC, and DMT1 in the mouse brain between P0 and P60: all were found to be significantly downregulated (fig. 2.1 G). It also relevant to note that mice lacking one locus for miR-29 show up-regulation of IREB2 (Papadopulous et al., 2015). These data suggest that both in fish and mouse miR-29 is involved in the age-dependent down-regulation of IRP2. To demonstrate a direct interaction between miR-29 family members and IREB2 mRNA in fish, I isolated the 3’UTRs of IREB2 from zebrafish and N. furzeri cDNA and fused them with the eGFP coding sequence to generate a reporter construct. 100pg of each reporter mRNA were co-injected in fertilized zebrafish embryos with the same amount of control mRNA encoding for the red fluorescence protein (RFP) and 100pg of 29a or dre-miR-29b mimic. Control embryos were injected with the same mixture with omission of the miRNA mimics. At 24hpf, 30-40 injected embryos were digested (according to Gallardo & Behra, 2012) and cells fluorescence was analyzed by cytofluorimetry to assess the relative eGFP/RFP fluorescence ratio (fig. 2.2 B). For both 3’UTRs, the normalized eGFP fluorescence was significantly reduced in presence of miR-29 mimics (fig. 2.2 C-D). For both constructs, a mutation of 3 nucleotides in the putative target sequence of the 3’-UTRs abolished repression (fig. 2.2 C-D). In addition, I performed luciferase assay in HEK293T cells to demonstrate direct targeting of IREB2 3’UTR by miR-29 in mammals. MiR-29 decreased luciferase activity of a reporter containing mouse IREB2 3’UTR and repression was abrogated by mutation of 3 nucleotides in the putative binding site (fig. 2.2 E).