R E S E A R C H
Open Access
Community analysis of the abundance and
diversity of mosquito species (Diptera:
Culicidae) in three European countries at
different latitudes
Tim W. R. Möhlmann
1,2*, Uno Wennergren
2, Malin Tälle
2, Guido Favia
3, Claudia Damiani
3, Luca Bracchetti
3and Constantianus J. M. Koenraadt
1Abstract
Background: Studies on mosquito species diversity in Europe often focus on a specific habitat, region or country. Moreover, different trap types are used for these sampling studies, making it difficult to compare and validate results across Europe. To facilitate comparisons of trapping sites and community analysis, the present study used two trap types for monitoring mosquito species diversity in three habitat types for three different countries in Europe.
Methods: Mosquitoes were trapped using Biogents Sentinel (BGS), and Mosquito Magnet Liberty Plus (MMLP) traps at a total of 27 locations in Sweden, the Netherlands and Italy, comprising farm, peri-urban and wetland habitats. From July 2014 to June 2015 all locations were sampled monthly, except for the winter months. Indices of species richness, evenness and diversity were calculated, and community analyses were carried out with non-metric multidimensional scaling (NMDS) techniques.
Results: A total of 11,745 female mosquitoes were trapped during 887 collections. More than 90% of the mosquitoes belonged to the genera Culex and Aedes, with Culex pipiens being the most abundant species. The highest mosquito diversity was found in Sweden. Within Sweden, species diversity was highest in wetland habitats, whereas in the Netherlands and Italy this was highest at farms. The NMDS analyses showed clear differences in mosquito communities among countries, but not among habitat types. The MMLP trapped a higher diversity of mosquito species than the BGS traps. Also, MMLP traps trapped higher numbers of mosquitoes, except for the genera Culex and Culiseta in Italy.
Conclusions: A core mosquito community could be identified for the three countries, with Culex pipiens as the most abundant species. Differences in mosquito species communities were more defined by the three countries included in the study than by the three habitat types. Differences in mosquito community composition across countries may have implications for disease emergence and further spread throughout Europe. Future research should, therefore, focus on how field data of vector communities can be incorporated into models, to better assess the risk of mosquito-borne disease outbreaks.
Keywords: Disease vectors, Community composition, Non-metric multidimensional scaling, Host-seeking behaviour, Vector surveillance
* Correspondence:[email protected]
1Laboratory of Entomology, Wageningen University and Research Centre,
P.O. Box 16, 6700, AA, Wageningen, The Netherlands
2IFM Theory and Modelling, Linköping University, 581 83 Linköping, Sweden
Full list of author information is available at the end of the article
© The Author(s). 2017 Open Access This article is distributed under the terms of the Creative Commons Attribution 4.0 International License (http://creativecommons.org/licenses/by/4.0/), which permits unrestricted use, distribution, and reproduction in any medium, provided you give appropriate credit to the original author(s) and the source, provide a link to the Creative Commons license, and indicate if changes were made. The Creative Commons Public Domain Dedication waiver (http://creativecommons.org/publicdomain/zero/1.0/) applies to the data made available in this article, unless otherwise stated.
Background
Intensified movement of humans, animals, and goods on a global scale in combination with climate change cre-ates opportunities for invasive and often exotic Culicidae vector species to establish in Europe [1]. Even without the arrival of exotic mosquitoes, suitable vector species are already present and may facilitate the successful spread of pathogens [2–7]. The introduction of West Nile virus (WNV) in the USA is probably the most striking example of a pathogen that was rapidly spread by the local vector community throughout the entire country [8]. Moreover, outbreaks of WNV caused by mosquito vectors in Romania (1996) and Russia (1999) resulted in hundreds of human cases, although rapid spread throughout Europe was not observed [9].
Mild winters in combination with humid and hot sum-mers allow vector populations to proliferate rapidly, resulting in increased mosquito nuisance and vectorial capacity [10]. Human cases of WNV in Europe were re-ported during 2016 for Spain, Italy, Austria, Romania, Hungary, Serbia and Ukraine [11]. The continued emer-gence of arboviruses in southern, eastern, and central Europe justifies the demand for detailed knowledge about the vectors that could transmit pathogens [3, 9, 12]. For example, a theoretical modelling study by Roche et al. [13] suggested that higher vector species richness can in-crease pathogen transmission. In contrast, a study by Chaves et al. [14] suggested that higher diversity in vector communities decreases the risk of amplification and spread of disease. To better understand the role of vector communities in disease spread, knowledge about vector species distribution, abundance, and richness is therefore essential.
In Europe, several mosquito species, including the Culex pipiens complex, Cx. modestus (Ficalbi, 1889), the Anopheles maculipennis complex, Aedes vexans (Meigen, 1830) and Ae. albopictus (Skuse, 1895), can act as vectors of parasites or viruses like malaria, Zika virus, West Nile virus, or Rift Valley fever virus [2, 4, 7, 15]. Thus far, ecological studies on vector species diversity often focused on one specific country [16–18], region within a country [4, 19], or even on a single habitat [14, 20–23]. In addition, mosquito species diversity has mostly been studied with one, rather than with a se-lection of different surveillance trap types. The use of different trap types in each study makes it difficult to make direct comparisons between them. Given the lack of standardized, cross-European studies, this study aimed to sample and assess mosquito species diversity simultaneously. This was done by using two mosquito trap types, in three representative countries at different latitudes across Europe, and for three different habitat types. With this setup, the differences in species rich-ness, diversity, and community composition in different
habitats across different countries in Europe could be identified. In addition, the relative efficiency of two trap types could be compared.
Methods
Mosquito sampling
Adult mosquitoes were sampled with two trap types: the Biogents Sentinel (BGS) trap (BioGents GmbH, Germany, http://www.biogents.com/) and the Mosquito Magnet Liberty Plus (MMLP) trap (Woodstream Corp., USA, http://www.mosquitomagnet.com/). For the pro-duction of CO2in the BGS trap, a mixture of 17.5 g dry
instant yeast (Bruggeman, the Netherlands), 250 g white granulated sugar and 2 l of tap water in a 5 l plastic bot-tle was used [24]. For the MMLP trap, combustion of propane provided CO2.
Sampling locations
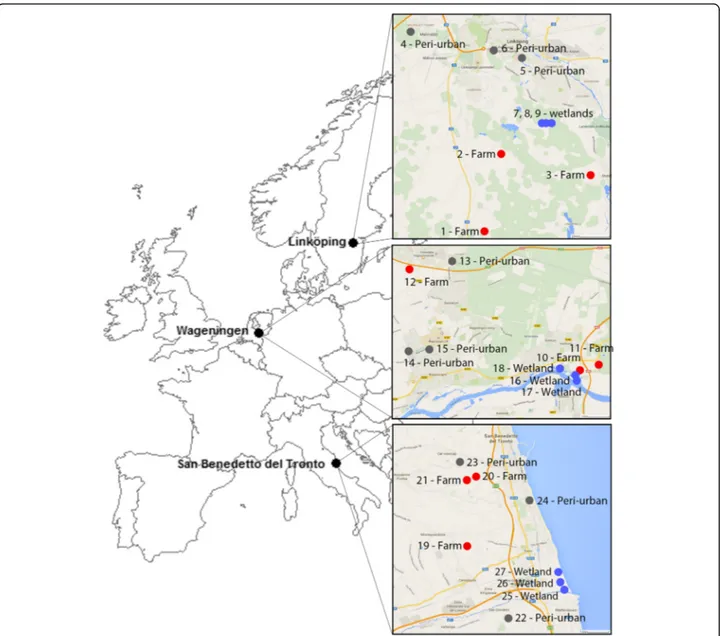
The traps were placed in three countries at different lati-tudes across Europe: southern Sweden (surroundings of Linköping 58.410808 N, 15.621532E, 45 m elevation), the central part of the Netherlands (surroundings of Wageningen 51.964795N, 5.662898E, 9 m elevation), and central Italy (surroundings of San Benedetto del Tronto 42.949483N, 13.878503E, 4 m elevation). In each country, three habitat types were sampled: (i) wetlands, (ii) farms, and (iii) peri-urban areas (Fig. 1). Wetlands are often considered as primary spots for transmission of vector-borne diseases as both reservoirs (birds), suscep-tible hosts (large grazers), and vectors (mosquitoes) can be present at a single location [23, 25, 26]. Farms were sam-pled because vector-borne diseases can have a large im-pact on livestock welfare, associated with high economic loss. Peri-urban areas are hypothesized to have a higher likelihood of human infection with a zoonosis, because of their location at the periphery of urban areas and proxim-ity to farmland areas [27]. Each habitat type was repre-sented by three unique sampling locations (Fig. 1), each separated by at least 100 m. At these locations, traps were placed at a minimum distance of 1 m from any walls or fences and were sheltered from the wind, rainfall, and dir-ect sunlight as much as possible.
Trap locations in wetlands had a minimum of 50% marshy or standing water within a 100 m radius of the traps. The farms selected for sampling had at least 100 dairy cows, except for locations 10, 20 and 21 [28], which had a minimum of ten dairy cows. Traps were placed within 50 m of an open livestock stable present at the farm. Peri-urban locations were at the periphery of a city (inhabitants < 150,000). Within a 50 m radius of the trap, at least two occupied residential properties were present. Gardens were open, except for two locations (13 and 14 in the Netherlands) that were bordered on least at three sides of the garden with fences of 2 m height.
Habitat types matched the classification of the CORINE European Land cover database [29], although habitats classified as wetlands for the present study were on some occasions classified as ‘agricultural’ or ‘natural forest area’. One of the peri-urban sites in Italy was clas-sified as ‘agricultural area’ instead of ‘artificial surfaces’ within the CORINE database, most likely because it was situated at the very edge of the city.
Sampling procedures
Collections were performed monthly during six consecu-tive days in each country. Within each month, the exact timing of the sampling period varied for the three
countries. Traps were active for 24 h and were emptied and rotated among the sampling locations (three trap-ping locations, in three different habitat types, and three countries) between sunrise and sunset of the next day. Sampling took place from July 2014 to June 2015, except for the winter months December, January and February (and March for Sweden). Mosquitoes were stored at -20 °C in Eppendorf tubes containing small silica beads covered with cotton wool.
Sample identification
All female mosquitoes were identified to species level using the key of Becker et al. [30]. Morphologically
Fig. 1 Overview of selected study sites. Overview of selected sites (1 to 27, see Vogels et al. [28] for more details about the locations) within each of the three countries in Europe: Linköping, Sweden (58.410808N, 15.621532E); Wageningen, the Netherlands (51.964795N, 5.662898E); San Benedetto del Tronto, Italy (42.949483N, 13.878503E). Farm habitats are indicated with a red dot (1–3, 10–12, 19–21), peri-urban habitats with a grey dot (4–6, 13–15, 22–24), and wetland habitats with a blue dot (7–9, 16–18, 25–27)
similar species were recorded as belonging to a complex of one of the following species: An. claviger, An. maculi-pennis, Ae. cantans, Ae. caspius, Ae. cinereus, Ae. de-tritusand Cx. pipiens. These names are used throughout the remainder of the manuscript as a representative for all species in each complex. For the taxonomy of Aedini species, the classification of Becker et al. [30] and Wilkerson et al. [31] was used.
Statistical analyses
Species diversity and evenness were calculated for the three countries and the farm, peri-urban, and wetland habitats. In addition, diversity indices were calculated for the two trap types (BGS and MMLP). Simpson’s Index of Diversity was calculated; 1−D ¼ 1−
P
niðni−1Þ
N N−1ð Þ , where ni
is the number of the ithspecies and N is the total num-ber of specimens in the studied country or habitat. Simpson’s Index of Diversity reflects the probability that two individuals taken at random from the dataset are not the same species. Values for Simpson’s Index of Diversity range between 0 and 1, with larger values representing greater diversity. The Shannon-Wiener’s Diversity Index was also used as a diversity index and calculated as H′¼ −PRi¼1piln pð Þ , where pi i¼ni
N . The
Shannon-Wiener’s Diversity Index is based on the un-certainty that an individual taken at random from the dataset is predicted correctly as a certain species. Larger values represent larger uncertainty, thus greater diver-sity. This method is sensitive to sample size, whereas the Simpson’s Index puts more weight on dominant species and is hardly influenced by a few rare species. In addition, the Shannon-Wiener’s evenness was calculated as E¼ ln SHð Þ′ , where S is the total number of species for the country or habitat. Values range between 0 and 1, where 1 is complete evenness, i.e. all species being equally abundant.
The effect of trap type on the number of mosqui-toes per genera was analysed using a Mann-Whitney-Wilcoxon test, as these data were not normally dis-tributed and variance was unequal. To better under-stand whether sufficient trapping efforts have been made for a reasonable estimate of species diversity, a rarefaction curve of the species and the number of collected mosquitoes were created with the rarecurve function within the VEGAN version 2.9.2. package [32] in R version 3.2.3 [33].
To examine the combined effect of country, habitat, and diversity on the mosquito community composition, non-metric multidimensional scaling (NMDS) analyses were performed. This method of data analysis creates a spatial ordination based on proximities between the elements of interest (habitat type, country, mosquito
species, and mosquito abundance in this case) [34]. The degree of stress for each NMDS plot was calculated, which indicates the reliability of the outcome, i.e. lower stress corresponds with a higher reliability. The ordin-ation of elements is considered arbitrary with stress values of 0.3 or above. The dissimilarity matrices are based on abundances for each species within the com-munity. Distances between points were determined with the metaMDS function using the Bray-Curtis dissimilar-ity metric. All data were analysed in the statistical soft-ware package R version 3.2.3 [33].
Results
A total of 887 trap collections were performed in Sweden, the Netherlands and Italy. In 617 (70%) of these collections, one or more mosquitoes were trapped. The BGS trap and MMLP trap ran effectively on 457 and 430 occasions, respectively.
A total of 11,745 mosquitoes were trapped during this study. Of these, 10,191 (87%) female mosquitoes could be identified to species level. Other individuals were ei-ther males (1376; 11.7%) or damaged (178; 1.5%) to the extent that they could not be identified morphologically. Over the three countries, a total of 40 mosquito species were found, comprising six genera. The rarefaction plots for each of the three countries are beyond their expo-nential growth curve, and level off (Additional file 1: Figure S1). This shows that our sampling effort was suf-ficient for obtaining a representative number of species for our locations in the three countries. The total num-ber of female mosquitoes trapped during the field study in the three countries combined was highest for the genus Culex (61.6%), followed by Aedes (29.4%), Culiseta (4.7%), Anopheles (3.2%), Coquillettidia (1.0%) and Ura-notaenia (0.2%). The most abundant species was Culex pipienswith a total of 5202 (51%) out of all identified fe-male mosquitoes (n = 10,191) from the three countries.
Overall, the MMLP trapped the largest numbers of mosquitoes in Sweden and Italy, while the BGS trapped most mosquitoes in the Netherlands. In all countries, the MMLP trapped most species and had the highest di-versity in the collections trapped (Table 1). Of all 40 mosquito species trapped, 95% were found in the MMLP traps, whereas only 55% were found in the BGS traps.
As the study design was the same for all habitats and countries, we can compare mosquito abundances tween the two trap types. From the comparisons be-tween the two traps, the MMLP collected significantly more mosquitoes per 24 h in six out of twelve compari-sons: Aedes mosquitoes in Sweden and Italy, Anopheles mosquitoes in Sweden, the Netherlands and Italy, and Culiseta mosquitoes in the Netherlands. The BGS trapped significantly more for two out of twelve com-parisons: Culex and Culiseta mosquitoes in Italy
(Additional file 2: Figure S2). In the remaining four comparisons, both traps collected equal numbers of mosquitoes.
Although the number of samples taken, and specimens trapped in Sweden was the lowest, the highest species diversity, richness, and evenness were found here com-pared to the other two countries. The lowest values for diversity were found in the Netherlands (Table 2). The species richness and diversity of the habitats differed among countries. In Sweden, most species were trapped in the peri-urban habitat, while most species were trapped at farms in the Netherlands, and wetlands in Italy. Farms had the lowest species richness both in Italy and Sweden, while peri-urban habitats had the lowest species richness in the Netherlands (Table 2). Species diversity was highest in Swedish wetlands, whereas it was highest at farms within the Netherlands. In Italy di-versity was comparable among habitats (Table 2).
From the 1298 mosquitoes trapped in Sweden, 29 spe-cies were identified. Of these mosquitoes, Ae. pullatus (Coquillett, 1904) (18%), An. maculipennis (16%), Cx. pipiens (16%), Ae. detritus (11%) and Coquillettidia richiardii (Ficalbi, 1889) (8%), were the most common species (Table 3). The 827 mosquitoes trapped from wet-lands in Sweden were dominated by Aedes species, most notably Ae. pullatus (28%), Ae. detritus (16%) and Ae.
cinereus (Meigen, 1818) (15%). For the 258 mosquitoes trapped on farms, the dominating species were An. maculipennis (44%), Cx. pipiens (19%), and An. claviger (14%), whereas the 213 mosquitoes trapped in peri-urban habitats were dominated by Cx. pipiens (46%), Cq. richiardii (11%), and Culiseta annulata (Schrank, 1776) (9%).
The Netherlands had the lowest species richness, with 14 species identified in the 3296 mosquitoes trapped during the study period. The most common species found were Cx. pipiens (88%) and Cs. annulata (9%) (Table 3). Both in the wetland (1164 mosquitoes) and peri-urban (1541 mosquitoes) habitats Cx. pipiens was the dominating species with 92% and 98% of the trapped mosquitoes, respectively. From the 591 mosquitoes trapped at farms Cx. pipiens (53%) and Cs. annulata (44%) were trapped in almost equal number.
A total of 26 species was identified from the 5597 mosquitoes trapped in Italy, of which Culex pipiens (37%), Ae. caspius (30%), and Cx. martinii (Medschid, 1930) (16%) were the most dominant (Table 3). Wetland habitats (4831 mosquitoes) were mostly populated by these three species. The 265 mosquitoes trapped at Italian farms were dominated by Cx. pipiens (56%), Ae. albopictus(14%) and Cs. longiareolata (Marcquart, 1838) (13%), whereas in peri-urban habitats Ae. albopictus was
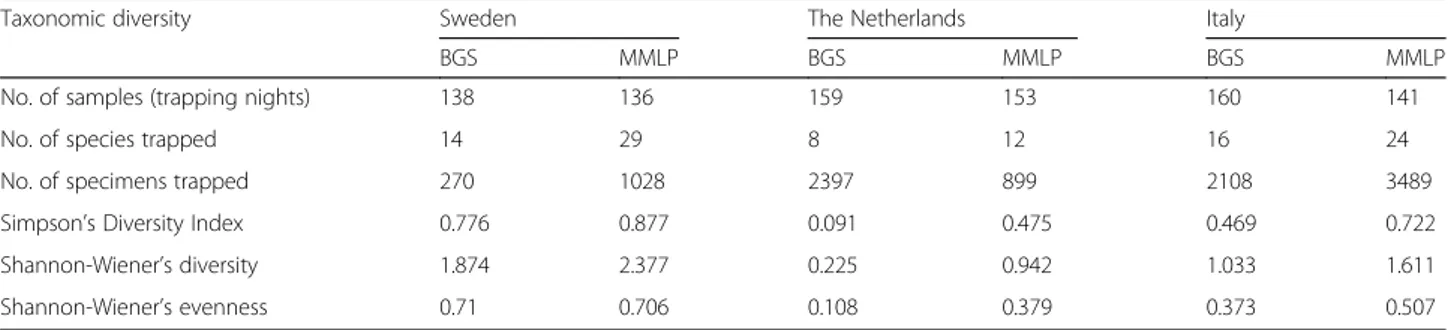
Table 1 Species diversity indices by trap type. Values for Simpson’s Index of diversity, Wiener’s diversity and Shannon-Wiener’s evenness for two trap types in three countries, Sweden, the Netherlands and Italy
Taxonomic diversity Sweden The Netherlands Italy
BGS MMLP BGS MMLP BGS MMLP
No. of samples (trapping nights) 138 136 159 153 160 141
No. of species trapped 14 29 8 12 16 24
No. of specimens trapped 270 1028 2397 899 2108 3489
Simpson’s Diversity Index 0.776 0.877 0.091 0.475 0.469 0.722
Shannon-Wiener’s diversity 1.874 2.377 0.225 0.942 1.033 1.611
Shannon-Wiener’s evenness 0.71 0.706 0.108 0.379 0.373 0.507
Abbreviations: BGS Biogents Sentinel trap, MMLP Mosquito Magnet Liberty Plus trap
Table 2 Mosquito species diversity by country and habitat. Estimators of taxonomic diversity with values for Simpson’s Index of diversity, Shannon-Wiener’s diversity and Shannon-Wiener’s evenness for three habitats (farms, peri-urban and wetlands) in three countries (Sweden, the Netherlands and Italy)
Species Sweden The Netherlands Italy Total
Farms Peri-urban Wetlands Total Farms Peri-urban Wetlands Total Farms Peri-urban Wetlands Total
No. of specimens trapped 258 213 827 1298 591 1541 1164 3296 265 501 4831 5597 10,191
No. of samples 91 91 92 274 99 105 108 312 98 101 102 301 887
No. of species trapped 13 24 19 29 11 5 10 14 13 14 21 26 40
Simpson’s Index of Diversity 0.739 0.753 0.849 0.885 0.524 0.035 0.153 0.217 0.646 0.611 0.706 0.737 0.699
Shannon-Wiener’s diversity 1.667 2.062 2.153 2.425 0.857 0.096 0.395 0.482 1.502 1.259 1.439 1.62 1.803
Table 3 Mosquito species abundance by country and habitat. List of mosquito species with number of specimens for each country (Sweden, the Netherlands and Italy) and habitat type (farms, peri-urban and wetlands)
Species Sweden The Netherlands Italy Total
Farms Peri-urban Wetlands Total Farms Peri-urban Wetlands Total Farms Peri-urban Wetlands Total
Aedes albopictus 0 0 0 0 0 0 0 0 37 272 4 313 313 Aedes behningi 0 2 13 15 0 0 0 0 0 0 1 1 16 Aedes berlandi 0 0 0 0 0 0 0 0 0 1 0 1 1 Aedes cantans 0 4 3 7 0 0 0 0 0 0 0 0 7 Aedes caspius 0 1 0 1 0 0 0 0 5 9 1664 1678 1679 Aedes cataphylla 0 8 0 8 0 0 0 0 0 0 0 0 8 Aedes cinereus 0 3 120 123 0 0 50 50 0 0 4 4 177 Aedes communis 0 0 0 0 0 0 2 2 0 0 0 0 2 Aedes detritus 1 7 131 139 1 0 0 1 12 41 282 335 475 Aedes geniculatus 0 1 0 1 0 0 0 0 0 1 2 3 4 Aedes hexodontus 1 0 0 1 0 0 0 0 0 0 0 0 1 Aedes impiger 0 0 0 0 0 0 0 0 0 1 0 1 1 Aedes intrudens 1 1 0 2 0 0 0 0 0 0 4 4 6 Aedes leucomelas 0 0 2 2 0 0 0 0 0 0 0 0 2 Aedes mercurator 0 0 33 33 0 0 0 0 0 0 0 0 33 Aedes pullatus 0 4 228 232 0 0 0 0 0 0 0 0 232 Aedes riparius 0 0 2 2 0 0 0 0 0 0 0 0 2 Aedes rossicus 0 0 1 1 0 0 0 0 0 0 0 0 1 Aedes vexans 1 5 6 12 1 0 13 14 0 0 7 7 33 Anopheles algeriensis 0 1 0 1 0 0 0 0 0 0 0 0 1 Anopheles claviger 35 8 6 49 2 0 1 3 0 1 3 4 56 Anopheles maculipennis 114 2 96 212 3 1 6 10 7 2 3 12 234 Anopheles plumbeus 16 3 0 19 4 0 1 5 0 11 0 11 35 Anopheles sacharovi 0 0 0 0 0 0 0 0 1 0 1 2 2 Coquillettidia richiardii 4 23 76 103 1 0 2 3 0 0 1 1 107 Culex laticintus 0 0 0 0 0 0 0 0 4 0 27 31 31 Culex martinii 0 0 0 0 0 0 0 0 9 4 878 891 891 Culex mimeticus 0 1 6 7 0 0 0 0 0 0 0 0 7 Culex modestus 5 13 2 20 0 1 1 2 0 1 58 59 81 Culex pipiens 48 100 57 205 316 1514 1070 2900 149 148 1800 2097 5202 Culex pusillus 0 0 0 0 1 0 0 1 0 0 16 16 17 Culex theileri 0 2 0 2 0 0 0 0 2 0 41 43 45 Culiseta alaskaensis 1 1 0 2 0 0 0 0 0 0 0 0 2 Culiseta annulata 27 20 16 63 258 24 18 300 3 3 2 8 371 Culiseta bergrothi 4 1 0 5 3 0 0 3 0 0 0 0 8 Culiseta longiarealata 0 0 0 0 0 0 0 0 34 6 17 57 57 Culiseta morsitans 0 1 28 29 0 0 0 0 1 0 0 1 30 Culiseta ochroptera 0 1 1 2 0 0 0 0 0 0 0 0 2 Culiseta subochrea 0 0 0 0 1 1 0 2 1 0 0 1 3 Uranotaenia unguiculata 0 0 0 0 0 0 0 0 0 0 16 16 16
the most abundant species with 54% of the 501 mosqui-toes trapped, followed by Cx. pipiens (30%) and Ae. de-tritus(8%).
Most mosquito species (29/40, 73%) were found in at least two habitats. Five species occurred exclusively at farms, four species exclusively in peri-urban and two species exclusively in wetland habitats (Fig. 2). All these 11 species were found in one country only, indicating that they are unique trappings (Fig. 3). Furthermore, more than half of the 40 species were trapped in only one of the countries (21/40, 53%), while 25% (10/40) of the species were trapped in all countries (Fig. 3). The lat-ter group included the most abundant species from the three countries: An. maculipennis, Cx. pipiens, Ae. de-tritus, Cq. richiardii and Cs. annulata. The most abun-dant mosquito in Sweden, Ae. pullatus only occurred in Swedish farm and wetland habitats. The second and third most abundant species from Italy (Ae. caspius and Cx. martinii) were trapped in all three habitats, but not in all countries (Figs. 2, 3).
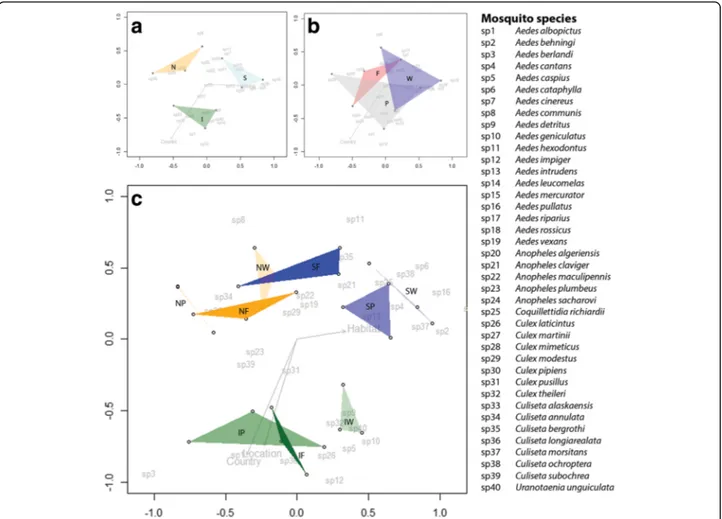
Dissimilarity matrices resulting from NMDS analyses reveal clear differences in mosquito community compos-ition among countries (stress value = 0.119, P = 0.029) (Fig. 4a). No significant habitat differences among com-munities were found (stress value = 0.119, P = 0.537) (Fig. 4b). However, differences in mosquito communities
among habitats within each country were found for some of the habitats (Fig. 4c). Habitat communities dif-fered from each other in Sweden (stress value = 0.121, P= 0.03) and Italy (stress value = 0.088, P = 0.033), but were not significantly different from each other in the Netherlands (stress value = 0.041, P = 0.173).
Discussion
To assess mosquito community diversity at a European scale, the present study used a standardized trapping protocol to sample mosquitoes in three countries at differ-ent latitudes across Europe. The highest mosquito diver-sity was found when trapping with the MMLP trap compared to the BGS trap. Although the BGS was initially developed for trapping host-seeking Aedes spp. [35], in the present study it did not trap large numbers of Aedes mosquitoes compared to the MMLP trap. On the other hand, it did trap significantly more Culex and Culiseta mosquitoes in Italy (Additional file 2: Figure S2). These re-sults differ from the findings of a study in which four trap types in Germany were compared, and where the BGS was the most efficient trap [36]. However, that study used different attractive blends for each of their traps, possibly explaining the disparity with our results.
Although the CO2 used in the present study (via
propane combustion or sugar fermentation) attracts
Fig. 2 Venn diagram of habitats. Diagram shows the absolute presence of mosquito species found in farm (red), peri-urban (grey), and wetland (blue) habitats
mosquitoes [37], more specimens may be trapped if a lure or attractive blend is added to the traps [38, 39]. However, it is not clear whether there is a selective effect of specific blends on the attraction of different mosquito species. As CO2is a general host-seeking cue for
blood-feeding arthropods, only CO2was chosen as an
attract-ant for this study. Larval sampling could further comple-ment adult female trapping to study mosquito diversity [17, 40, 41]. Furthermore, the number of trapped species and specimens can fluctuate substantially depending on the year [19]. Our data were collected for one year only, and do therefore not take into account annual variation in mosquito population dynamics.
Mosquito community composition differed among countries. This is illustrated by the diversity indices cal-culated (Table 2), which was highest in Sweden, followed by Italy and the Netherlands. Also, the Venn-diagram (Fig. 3) shows that 25% of the trapped mosquito species were found in all three countries. Finally, the dissimilar-ity matrix (Fig. 4a) distinguishes different mosquito com-munities among countries. However, a core community seemed to be present in all countries (Fig. 3). This core community includes the five most abundant species from the three countries: An. maculipennis, Cx. pipiens, Ae. detritus, Cq. richiardii and Cs. annulata. Although
this core community occurs throughout the sampled countries, it cannot be assumed that their contribution to disease spread is similar in all countries. Species or biotypes within the An. maculipennis or Cx. pipiens complexes can, for example, differ in their feeding be-haviour or vector competence [30, 42, 43] and thus play different roles in pathogen transmission.
In total, 29 of 49 mosquito species officially recorded for Sweden [17], 14 of 35 species for the Netherlands [18], and 26 of 54 species for Italy [44] were trapped during this study. Although our sampling effort was comprehensive, as can be seen in the rarefaction plot (Additional file 1: Figure S1), it should be mentioned that mosquito diversity in our collections is not repre-sentative for the countries as a whole. Results can be compared among the three countries in this study be-cause of the consistent study design. However, sampling was done in a small representative area that cannot be extrapolated to the country level. Complete mosquito di-versity for a country is better estimated with studies sampling throughout a country with many traps for a longer period, as can be illustrated by the fact that diver-sity indices found by Ibanez-Justicia et al. [18] are higher for the Netherlands than those in the current study (Table 2). Combining both setups for multiple countries
Fig. 3 Venn diagram of countries. Diagram shows the absolute presence of mosquito species found in Sweden (blue), the Netherlands (orange), and Italy (green)
and multiple years would be the ideal study design, but this is not logistically feasible. Mosquito species that were not trapped in this study most likely occur in very low densities or use different habitats than sampled in this study, thereby making them less relevant from the perspective of disease spread.
While community composition differed among coun-tries, they overlapped among habitat types (Fig. 4b). However, when differentiating habitats within countries, there was marked habitat effects on community compos-ition (Fig. 4c). Communities among habitats differed within Sweden and Italy, while communities in the Netherlands were more similar to each other for all hab-itats. This might be explained by the relatively high level of habitat fragmentation in the Netherlands [18]. As a result of high habitat diversity in the landscape on a small spatial scale, species may be more easily collected from nearby habitats.
Although diversity indices did not show a clear pattern for habitats (Table 2), species diversity was always higher in (semi-) natural areas (farms and wetlands) when com-pared to peri-urban habitats in all countries. This corre-sponds with other studies that found higher diversity in wet, inundated or heterogenic natural areas with a high vegetation index [14, 16, 21, 23, 41, 44, 45]. This prob-ably reflects the fact that natural areas offer more diver-sity in breeding habitats, resting places, and available hosts for mosquitoes.
Although the fewest specimens were trapped in Sweden, the highest diversity was recorded here. It is accepted that species diversity in general, and also for mosquitoes, de-clines towards the pole regions [20, 45, 46]. However, if natural areas do indeed accommodate more mosquito di-versity, this could explain the higher species diversity in Sweden. Also, high species richness in Sweden could be caused by the relatively high number of Aedes species
Fig. 4 Results of NMDS analyses. a Mosquito community compositions for the three countries. Abbreviations: S, Sweden; N, the Netherlands; I, Italy. b NMDS analysis for the farm (F), peri-urban (P) and, wetland (W) habitats based on the number of mosquitoes trapped per species in each habitat and country. c NMDS analysis based on the number of mosquitoes trapped per species at each location in each country and habitat (Sweden in blue: SF, SP, and SW, the Netherlands in orange: NF, NP, and NW, Italy in green: IF, IP, and IW). The Bray-Curtis dissimilarity index was used for determination of dissimilarities among mosquito community compositions. Stress value = 0.119 for panels A and B, which indicates a good fit of the model. Stress value = 0.197 for panel C, which indicates a reasonable fit of the model
trapped, as the tribe Aedini consists of more mosquito species than any of the other tribes in the Palaearctic [40].
An earlier study in Italian wetlands found 22 species, of which 14 overlapped with what we found in our Italian wetland site. However, their samples from the same location (Sentina wetlands, 42.901956N, 13.905395E) only comprised six out of the 21 species trapped within the present study [47]. The greater number of species trapped during our study compared to collections by Toma et al. [47], may be the result of the use of different trap types, and the further development and succession within the Sentina wetland natural area that was restored in 2004, as natural wetlands harbour more mosquito species than constructed wetlands [21].
From the European core mosquito community, sev-eral can be identified as (potential) vectors of patho-gens. Species from the genera Culex and Aedes are known to transmit pathogens [30]. Culex pipiens was trapped in large numbers in all three countries and most of the habitats. Other studies in Europe also found Cx. pipiens to be one of the most dominant species [16, 23, 41, 44, 48, 49]. Culex pipiens is a known vector for WNV, which already circulates in some parts of Europe [2, 50]. It is still unclear why WNV does not spread to more northern countries in Europe [3, 9, 12], but the temperature seems to be one of the main driving factors [43, 51].
Aedes albopictus is a known vector of approximately 22 arboviruses, including WNV, dengue, chikungunya, and possibly Zika [15, 52–54]. In our study, they were mainly trapped from peri-urban sites in Italy where they even outnumbered Cx. pipiens (Table 3), but they were not found in Sweden or the Netherlands. However, Ae. albopictus is known to be repeatedly introduced into the Netherlands with the import of tires and lucky bam-boo plants [55, 56]. It is expected that Ae. albopictus is unable to survive in Sweden, but that it can establish in the Netherlands [57]. The introduction and establish-ment of an efficient vector such as Ae. albopictus will significantly increase the risk of pathogen transmission, as was shown in Italy for outbreaks of chikungunya [58]. This stresses the need for appropriate monitoring and control strategies against this species.
Other Aedes species, such as Ae. caspius, Ae. pullatus, Ae. detritus and Ae. cinereus, were mainly trapped in Italian and Swedish wetlands. Aedes caspius is consid-ered a potential vector for WNV and tularemia [30]. The high numbers of Ae. caspius mosquitoes trapped in Italian wetlands correspond to its association with brackish water in coastal wetlands [19, 23, 44, 49]. The Ae. cinereusmosquitoes, mainly trapped in Swedish wet-lands, are considered an important bridge vector for both tularemia bacteria, and the Sindbis virus that is re-emerging in humans every seventh year in
northern-European countries [17, 59]. Mosquitoes from the spe-cies responsible for maintaining the enzootic cycle of the Sindbis virus among birds, Cx. torrentium were only found in small numbers in our earlier study [28].
Besides the presence of specific vector species in the European mosquito core community, it is also important to take the diversity of communities associated with these dominant vectors into account [13, 14]. Mosquito community composition differed among countries and for some habitats within countries. Chaves et al. [14] suggest that higher diversity in vector communities is expected to decrease the risk of amplification and spread of a vector-borne disease because higher vector species diversity is thought to be correlated with lower mosquito abundance. In contrast, a theoretical study by Roche et al. [13] suggests that greater species richness can amplify disease transmission. Specific vector species could play an important role in these complex commu-nity dynamics. Given the fact that many vector-borne diseases require multiple species that together influence the rate of transmission, understanding the ecology of vector networks is becoming increasingly important.
Conclusion
Within our study in three countries across Europe, a core mosquito community could be identified, with Culex pipiens as the most abundant species. Differ-ences in mosquito community composition were more defined by countries than habitats, although some habitats do accommodate distinct communities in specific countries. Differences in vector community composition across countries may have implications for disease emergence and further spread throughout Europe. Both the role of these complex communities as well as the role of specific vector species within these communities should be further determined. To better understand patterns of disease emergence and outbreaks, differences in vector communities should, therefore, be incorporated in mathematical and statis-tical models.
Additional files
Additional file 1: Figure S1. Rarefaction plot of sampling effort. The plot shows the number of species expected to be found for the number of individuals sampled for Sweden (blue), Italy (green) and the Netherlands (orange). (PNG 6 kb)
Additional file 2: Figure S2. Frequency distribution for the number of trap nights that a specific number of female mosquitoes was trapped. Shown are the results for three countries (Sweden, the Netherlands and Italy), two trap types (MMLP, Mosquito Magnet Liberty Plus trap; BGS, Biogents Sentinel trap), and the four most common genera (Aedes, Anopheles, Culex and Culiseta). Comparisons between the two trap types were made for the four most common mosquito genera in each country, using the Mann-Whitney-Wilcoxon test. Significance is displayed for each comparison, with *P < 0.05 and ***P < 0.001. (PNG 10822 kb)
Acknowledgements
We would like to thank the students that helped to collect the field data: Rickard Pettersson from Sweden and Mahmod Hamdan from Italy. We thank Frans Jacobs and Marian Dik for support with mosquito identification. Farmers, nature area managers and homeowners in Sweden, the Netherlands and Italy that provided us with the essential locations needed for this research are acknowledged for their support. We also thank Marcel Dicke for providing comments on a previous version of this manuscript.
Funding
This study was part of the ANIHWA-EraNet (Animal Health and Welfare) program (LIVEepi) funded by the Ministry of Economic Affairs (project number 1300018161), the Netherlands, and the Swedish Research Council (FORMAS), Sweden. In Italy, the work was supported by grants from the Italian Ministry of Education, University and Research (MIUR) (Prin 2012 protocol 2012T85B3R). The funders had no role in study design, data collection and analysis, decision to publish, or preparation of the manuscript.
Availability of data and materials
The datasets supporting the conclusions of this article are included within the article and its additional files.
Authors’ contributions
TWRM, UW, GF and CJMK designed the study; TWRM, MT, CD and LC collected data; UW, GF and CJMK provided funding and support for fieldwork; TWRM and CD made morphological identifications; TWRM analysed data and wrote the manuscript. UW, MT, GF, CD, LB and CJMK contributed to the writing of the manuscript. All authors read and approved the final manuscript.
Ethics approval and consent to participate Not applicable.
Consent for publications Not applicable.
Competing interests
The authors declare that they have no competing interests.
Publisher’s Note
Springer Nature remains neutral with regard to jurisdictional claims in published maps and institutional affiliations.
Author details
1Laboratory of Entomology, Wageningen University and Research Centre,
P.O. Box 16, 6700, AA, Wageningen, The Netherlands.2IFM Theory and
Modelling, Linköping University, 581 83 Linköping, Sweden.3Scuola di
Bioscienze e Medicina Veterinaria, Università degli Studi di Camerino, 62032 Camerino, Italy.
Received: 26 April 2017 Accepted: 13 October 2017
References
1. Schaffner F, Kaufmann C, Hegglin D, Mathis A. The invasive mosquito Aedes japonicus in Central Europe. Med Vet Entomol. 2009;23(4):448–51. 2. Han LL, Popovici F, Alexander JP, Laurentia V, Tengelsen LA, Cernescu C,
et al. Risk factors for West Nile virus infection and meningoencephalitis, Romania, 1996. J Infect Dis. 1999;179(1):230–3.
3. Hubálek Z, Halouzka J. West Nile fever - a reemerging mosquito-borne viral disease in Europe. Emerg Infect Dis. 1999;5(5):643.
4. Balenghien T, Fouque F, Sabatier P, Bicout DJ. Horse-, bird-, and human-seeking behaviour and seasonal abundance of mosquitoes in a West Nile virus focus of southern France. J Med Entomol. 2006;43(5):936–46. 5. Vogels CB, van de Peppel LJ, van Vliet AJ, Westenberg M, Ibanez-Justicia A,
Stroo A, et al. Winter activity and aboveground hybridization between the two biotypes of the West Nile virus vector Culex pipiens. Vector Borne Zoonotic Dis. 2015;15(10):619–26.
6. Higgs S, Snow K, Gould EA. The potential for West Nile virus to establish outside of its natural range: a consideration of potential mosquito vectors in the United Kingdom. Trans R Soc Trop Med Hyg. 2004;98(2):82–7.
7. Chevalier V, Pépin M, Plée L, Lancelot R. Rift Valley fever - a threat for Europe? Euro Surveill. 2010;15(10):19506–19506.
8. Snapinn KW, Holmes EC, Young DS, Bernard KA, Kramer LD, Ebel GD. Declining growth rate of West Nile virus in North America. J Virol. 2007;81(5):2531–4. 9. Sambri V, Capobianchi M, Charrel R, Fyodorova M, Gaibani P, Gould E, et al.
West Nile virus in Europe: emergence, epidemiology, diagnosis, treatment, and prevention. Clin Microbiol Infect. 2013;19(8):699–704.
10. Semenza JC, Menne B. Climate change and infectious diseases in Europe. Lancet Infect Dis. 2009;9(6):365–75.
11. ECDC. West Nile fever maps. 2017. [http://ecdc.europa.eu/en/healthtopics/ west_nile_fever/West-Nile-fever-maps/pages/index.aspx].
12. Calistri P, Giovannini A, Hubalek Z, Ionescu A, Monaco F, Savini G, et al. Epidemiology of West Nile in Europe and in the Mediterranean basin. Open Virol J. 2010;4:29.
13. Roche B, Rohani P, Dobson AP, Guégan J-F. The impact of community organization on vector-borne pathogens. Am Nat. 2013;181(1):1–11. 14. Chaves LF, Hamer GL, Walker ED, Brown WM, Ruiz MO, Kitron UD. Climatic
variability and landscape heterogeneity impact urban mosquito diversity and vector abundance and infection. Ecosphere. 2011;2(6):art70. 15. Aliota MT, Peinado SA, Osorio JE, Bartholomay LC. Culex pipiens and
Aedes triseriatus Mosquito susceptibility to Zika virus. Emerg Infect Dis. 2016;22(10):1857.
16. Versteirt V, Boyer S, Damiens D, De Clercq E, Dekoninck W, Ducheyne E, et al. Nationwide inventory of mosquito biodiversity (Diptera: Culicidae) in Belgium, Europe. Bull Entomol Res. 2013;103(02):193–203.
17. Lundström JO, Schäfer ML, Hesson JC, Blomgren E, Lindström A, Wahlqvist P, et al. The geographic distribution of mosquito species in Sweden. J Euro Mosq Control Assoc. 2013;31:21–35.
18. Ibanez-Justicia A, Stroo A, Dik M, Beeuwkes J, Scholte EJ. National mosquito (Diptera: Culicidae) survey in the Netherlands 2010–2013. J Med Entomol. 2015;52(2):185–98.
19. Osório HC, Amaro F, Zé-Zé L, Moita S, Labuda M, Alves MJ. Species composition and dynamics of adult mosquitoes of southern Portugal. Eur Mosq Bull. 2008;25:12–23.
20. Schäfer M, Lundström JO. Comparison of mosquito (Diptera: Culicidae) fauna characteristics of forested wetlands in Sweden. Ann Entomol Soc Am. 2001;94(4):576–82.
21. Schäfer ML, Lundström JO, Pfeffer M, Lundkvist E, Landin J. Biological diversity versus risk for mosquito nuisance and disease transmission in constructed wetlands in southern Sweden. Med Vet Entomol. 2004;18(3):256–67.
22. Rettich F, Imrichova K,Šebesta O. Seasonal comparisons of the mosquito fauna in the flood plains of Bohemia and Moravia, Czech Republic. Euro Mosq Bull. 2007;23:10–6.
23. Roiz D, Ruiz S, Soriguer R, Figuerola J. Landscape effects on the presence, abundance and diversity of mosquitoes in Mediterranean wetlands. PLoS One. 2015;10(6):e0128112.
24. Smallegange RC, Schmied WH, van Roey KJ, Verhulst NO, Spitzen J, Mukabana WR, et al. Sugar-fermenting yeast as an organic source of carbon dioxide to attract the malaria mosquito Anopheles gambiae. Malar J. 2010;9:292.
25. Ezenwa VO, Milheim LE, Coffey MF, Godsey MS, King RJ, Guptill SC. Land cover variation and West Nile virus prevalence: patterns, processes, and implications for disease control. Vector Borne Zoonotic Dis. 2007;7(2):173–80. 26. Reusken C, De Vries A, Den Hartog W, Braks M, Scholte E-J. A study of the circulation of West Nile virus in mosquitoes in a potential high-risk area for arbovirus circulation in the Netherlands,“De Oostvaardersplassen”. Euro Mosq Bull. 2010;28:69–83.
27. Maassen C, De Jong A, Stenvers O, Valkenburgh S, Friesema I, Heimeriks K, et al. Staat van zoönosen 2011. RIVM Rapport. 2012;330291008
28. Vogels CBF, Möhlmann TWR, Melsen D, Favia G, Wennergren U, Koenraadt CJM. Latitudinal diversity of Culex pipiens biotypes and hybrids in farm, peri-urban, and wetland habitats in Europe. PLoS One. 2016;11(11):e0166959.
29. Corine Land Cover EEA. Off pub euro Comm. In: Copenhagen; 2000. 30. Becker N, Petrić D, Boase C, Lane J, Zgomba M, Dahl C, et al. Mosquitoes
and their control. Springer; 2010.
31. Wilkerson RC, Linton Y-M, Fonseca DM, Schultz TR, Price DC, Strickman DA. Making mosquito taxonomy useful: a stable classification of tribe Aedini that balances utility with current knowledge of evolutionary relationships. PLoS One. 2015;10(7):e0133602.
32. Oksanen J, Kindt R, Legendre P, O’Hara B, Simpson G, Stevens M, et al. Vegan: community ecology package. R package version 2.9.2. 2009. URL http://CRAN.R-project.org/package=vegan
33. Team RCR. A language and environment for statistical computing. Vienna, Austria: R Foundation for Statistical Computing; 2015. URL http://www.R-project.org/ 34. Young M, Scannell J, O'Neill M, Hilgetag C, Burns G, Blakemore C.
Non-metric multidimensional scaling in the analysis of neuroanatomical connection data and the organization of the primate cortical visual system. Philos Trans R Soc Lond Ser B Biol Sci. 1995;348(1325):281–308.
35. Biogents IM. Instruction manual for the Biogents sentinel. 2015. 36. Luhken R, Pfitzner WP, Borstler J, Garms R, Huber K, Schork N, et al. Field
evaluation of four widely used mosquito traps in Central Europe. Parasit Vectors. 2014;7:268.
37. Guerenstein PG, Hildebrand JG. Roles and effects of environmental carbon dioxide in insect life. Annu Rev Entomol. 2008;53:161–78.
38. van Loon JJ, Smallegange RC, Bukovinszkiné-Kiss G, Jacobs F, De Rijk M, Mukabana WR, et al. Mosquito attraction: crucial role of carbon dioxide in formulation of a five-component blend of human-derived volatiles. J Chem Ecol. 2015;41(6):567–73. 39. Roiz D, Roussel M, Muñoz J, Ruiz S, Soriguer R, Figuerola J. Efficacy of
mosquito traps for collecting potential West Nile mosquito vectors in a natural Mediterranean wetland. Am J Trop Med Hyg. 2012;86(4):642–8. 40. Rueda LM. Global diversity of mosquitoes (Insecta: Diptera: Culicidae) in
freshwater. Hydrobiologia. 2008;595(1):477–87.
41. Schaffner F, Mathis A. Spatio-temporal diversity of the mosquito fauna (Diptera: Culicidae) in Switzerland. Swiss Nat Cen Vector Entomol. 2013. https://www. researchgate.net/profile/Francis_Schaffner/publication/281755970_Spatio-temporal_diversity_of_the_mosquito_fauna_Diptera_Culicidae_in_ Switzerland/links/5611825d08ae4833751ba499/Spatio-temporal-diversity-of-the-mosquito-fauna-Diptera-Culicidae-in-Switzerland.pdf.
42. Gomes B, Sousa CA, Vicente JL, Pinho L, Calderón I, Arez E, et al. Feeding patterns of molestus and pipiens forms of Culex pipiens (Diptera: Culicidae) in a region of high hybridization. Parasit Vectors. 2013;6(1):1.
43. Vogels CB, Fros JJ, Göertz GP, Pijlman GP, Koenraadt CJ. Vector competence of northern European Culex pipiens biotypes and hybrids for West Nile virus is differentially affected by temperature. Parasit Vectors. 2016;9(1):1. 44. Marí RB, Jiménez-Peydró R. Differences in mosquito (Diptera: Culicidae)
biodiversity across varying climates and land-use categories in eastern Spain. Entomol Fenn. 2011;22(3):190–8.
45. Foley DH, Rueda LM, Wilkerson RC. Insight into global mosquito biogeography from country species records. J Med Entomol. 2007;44(4):554–67.
46. Rosenzweig ML. Species diversity in space and time. Cambridge: Cambridge University Press; 1995.
47. Toma L, Cipriani M, Goffredo M, Romi R, Lelli R. First report on entomological field activities for the surveillance of West Nile disease in Italy. Vet Ital. 2008;44:499–512. 48. Boukraa S, Maria A, Bawin T, Raharimalala FN, Zimmer J-Y, Haubruge E, et al.
Diversity and ecology survey of mosquitoes potential vectors in Belgian equestrian farms: a threat prevention of mosquito-borne equine arboviruses. Prev Vet Med. 2016;124:58–68.
49. Aranda C, Sánchez-Seco M, Cáceres F, Escosa R, Gálvez J, Masià M, et al. Detection and monitoring of mosquito flaviviruses in Spain between 2001 and 2005. Vector Borne Zoonotic Dis. 2009;9(2):171–8.
50. Turell MJ, Dohm DJ, Sardelis MR, O’guinn ML, Andreadis TG, Blow JA. An update on the potential of North American mosquitoes (Diptera: Culicidae) to transmit West Nile virus. J Med Entomol. 2005;42(1):57–62.
51. Fros JJ, Geertsema C, Vogels CB, Roosjen PP, Failloux A-B, Vlak JM, et al. West Nile virus: high transmission rate in north-western European mosquitoes indicates its epidemic potential and warrants increased surveillance. PLoS Neg Trop Dis. 2015;9(7):e0003956.
52. Petrić D, Bellini R, Scholte E-J, Rakotoarivony LM, Schaffner F. Monitoring population and environmental parameters of invasive mosquito species in Europe. Parasit Vectors. 2014;7:187.
53. Gratz N. Critical review of the vector status of Aedes albopictus. Med Vet Entomol. 2004;18(3):215–27.
54. Chouin-Carneiro T, Vega-Rua A, Vazeille M, Yebakima A, Girod R, Goindin D, et al. Differential susceptibilities of Aedes aegypti and Aedes albopictus from the Americas to Zika virus. PLoS Neg Trop Dis. 2016;10(3):e0004543. 55. Reiter P. Aedes albopictus and the world trade in used tires, 1988–1995: the
shape of things to come? J Am Mosq Control Assoc. 1998;14(1):83–94. 56. Scholte E-J, Jacobs F, Linton Y-M, Dijkstra E, Fransen J, Takken W. First
record of Aedes (Stegomyia) albopictus in the Netherlands. Eur Mosq Bull. 2007;22:5–9.
57. Benedict MQ, Levine RS, Hawley WA, Lounibos LP. Spread of the tiger: global risk of invasion by the mosquito Aedes albopictus. Vector Borne Zoonotic Dis. 2007;7(1):76–85.
58. Rezza G, Nicoletti L, Angelini R, Romi R, Finarelli A, Panning M, et al. Infection with chikungunya virus in Italy: an outbreak in a temperate region. Lancet. 2007;370(9602):1840–6.
59. Kurkela S. Sindbis virus infection in resident birds, migratory birds, and humans, Finland. Emerg Infect Dis. 2008;14(1):41–7.
• We accept pre-submission inquiries
• Our selector tool helps you to find the most relevant journal • We provide round the clock customer support
• Convenient online submission • Thorough peer review
• Inclusion in PubMed and all major indexing services • Maximum visibility for your research
Submit your manuscript at www.biomedcentral.com/submit