doi: 10.3389/fgene.2019.00523
Edited by: Manlio Vinciguerra, International Clinical Research Center (FNUSA-ICRC), Czechia Reviewed by: Joseph Tam, The Hebrew University of Jerusalem, Israel Patricia Rivera, Hospital Infantil Universitario Niño Jesús, Spain *Correspondence: Carlo Cifani [email protected] Claudio D’Addario [email protected]
†These authors have contributed
equally to this work
‡These authors have contributed
equally to this work as senior authors
Specialty section: This article was submitted to Nutrigenomics, a section of the journal Frontiers in Genetics Received: 15 February 2019 Accepted: 13 May 2019 Published: 14 June 2019 Citation: Pucci M, Micioni Di Bonaventura MV, Vezzoli V, Zaplatic E, Massimini M, Mai S, Sartorio A, Scacchi M, Persani L, Maccarrone M, Cifani C and D’Addario C (2019) Preclinical and Clinical Evidence for a Distinct Regulation of Mu Opioid and Type 1 Cannabinoid Receptor Genes Expression in Obesity. Front. Genet. 10:523. doi: 10.3389/fgene.2019.00523
Preclinical and Clinical Evidence for
a Distinct Regulation of Mu Opioid
and Type 1 Cannabinoid Receptor
Genes Expression in Obesity
Mariangela Pucci1†, Maria Vittoria Micioni Di Bonaventura2†, Valeria Vezzoli3,
Elizabeta Zaplatic1, Marcella Massimini1, Stefania Mai3, Alessandro Sartorio3,
Massimo Scacchi3, Luca Persani3,4, Mauro Maccarrone5‡, Carlo Cifani2*‡and
Claudio D’Addario1,6*‡
1Faculty of Bioscience and Technology for Food, Agriculture and Environment, University of Teramo, Teramo, Italy, 2Pharmacology Unit, School of Pharmacy, University of Camerino, Camerino, Italy,3Lab of Endocrine and Metabolic Research, Istituto Auxologico Italiano IRCCS, Milan, Italy,4Department of Clinical Sciences and Community Health, University of Milan, Milan, Italy,5Department of Medicine, Campus Bio-Medico University of Rome, Rome, Italy, 6Department of Clinical Neuroscience, Karolinska Institutet, Stockholm, Sweden
Among endogenous signaling networks involved in both rewarding and homeostatic mechanisms of obesity, a relevant role is played by the endocannabinoid (ECS) and the opioid (EOS) systems. We here studied the transcriptional regulation of ECS and EOS genes in the hypothalamus of Diet-induced obesity rats, a preclinical model of obesity, as well as in humans with obesity and healthy controls. A significant and selective increase in type 1 cannabinoid receptor gene (Cnr1) expression was observed at the beginning of obesity development (5 weeks on high fat diet) as well as after 21 weeks of high diet exposure. After 5 weeks on high fat diet, selective up-regulation of mu opioid receptor gene (Oprm1) expression was also observed. Consistently, epigenetic studies showed a selective and significant decrease in DNA methylation at specific CpG sites at both gene promoters in overweight rats, but only after 5 weeks on high fat diet. Moreover, significantly lower levels of DNA methylation were observed at selected CpG sites of both receptor gene promoters, analyzed in peripheral blood mononuclear cells from younger (<30 years old) humans with obesity, as well as in those with shorter time length from disease onset. Taken together, we here provide evidence of selective, synergistic and time-dependent transcriptional regulation of CNR1 and OPRM1 genes in overweight rats, as well as in human subjects. These alterations in genes regulation could contribute to the development of the obese phenotype, and we thus suggest CNR1 and OPRM1 epigenetic modulation as possible biomarkers of obesity development. Due to the reversible nature of the epigenetic hallmark, our data might also open new avenue to early environmental strategies of intervention.
fgene-10-00523 June 14, 2019 Time: 16:53 # 2
Pucci et al. OPRM1 and CNR1 Genes in Obesity
INTRODUCTION
Obesity is a growing public health threat, potentially affecting emotional, and physical health with a relevant mortality rate and a high burden of disease for Western societies. Core symptoms of this disease are disturbance of eating habits and inability to control body weight, thus leading to an imbalance between energy intake and expenditure. In recent years several approaches have been used to treat obesity, yet the efficacy of the few medications proven useful remains a matter of debate. Thus,
effective and safe treatments are urgently needed (Patel and
Stanford, 2018). Efforts should be made to disclose the causes that make individuals more vulnerable to the development of obesity, in order to gain useful information for alleviating or even preventing occurrence of this condition. Genetic predisposition has been implicated in disease susceptibility (Stice, 2002; Striegel-Moore and Bulik, 2007), however, differences in phenotype heterogeneity point also to the relevant role of the environment and lifestyle (Hill et al., 2003). Molecular research has formed the basis to understand how environmental factors (i.e., dieting) may facilitate disease progression by engaging epigenetic mechanisms (van Dijk et al., 2015), helping also to understand the increasing epidemic of the disease in the last years within the same genome. It is in fact well known that the latter mechanisms can evoke transient changes (although how long they actually last is unclear) in gene expression, involving chemical modifications of DNA that do not affect the actual DNA sequence of the organism. The understanding of how transcriptional regulation might affect individual risk of developing obesity represents a major challenge in research and may provide invaluable help for the development of preventive strategies, or of more effective therapeutics. Central regulation of food intake is rather complex, and thus different endogenous key players should be considered. For instance, it is clear that rewarding properties of food, possibly leading
to drug-like food addiction (D’Addario et al., 2014; Mancino
et al., 2015), are responsible for disease development and share neuronal pathways that seem to overlap with drug addiction (Volkow and Wise, 2005). These neural circuitries, driving eating behaviors in the brain to ensure food-intake and to regulate caloric balance, are thus controlled not only by homeostatic mechanisms but also by reward systems to promote motivational,
hedonically driven feeding (Coccurello and Maccarrone, 2018).
Among the endogenous systems involved in both rewarding and homeostatic mechanisms, a relevant role is played by both the
endocannabinoid (ECS) and the opioid (EOS) systems (Cota
et al., 2003a; Tanda and Goldberg, 2003), which functionally interact with each other in mediating neurological functions (Manzanares et al., 1999;Tanda and Goldberg, 2003). In feeding regulation, both ECS and EOS seem to contribute to the reward aspect of eating (Saper et al., 2002;Yeomans and Gray, 2002;
Cota et al., 2003b). Of note, several preclinical studies reported that both opioid and cannabinoid receptor agonists stimulate food intake (Reid, 1985;Foltin et al., 1988;Williams et al., 1998;
Glass et al., 1999;Williams and Kirkham, 1999), that is instead
reduced by antagonists (Recant et al., 1980; Marks-Kaufman
et al., 1984;Colombo et al., 1998;Di Marzo et al., 2001;Glass et al., 2002;Hildebrandt et al., 2003;Ravinet Trillou et al., 2003;
Statnick et al., 2003;Vickers et al., 2003) with suppression of body weight gain in rodents. It has been also observed in human trials that opioid antagonists (naloxone, naltrexone, or nalmefene) may be helpful in the short term to suppress appetite, even though caution should be taken for possible long term use because of side effects and limited weight loss (Nathan and Bullmore, 2009). In this context, it should be recalled that rimonabant, a selective type 1 cannabinoid receptor (CB1) antagonist able to reduce body
weight (Rinaldi-Carmona et al., 1995; Di Marzo and Despres,
2009), was an approved drug on the European market, but was
withdrawn because of an increased risk of psychiatric disorders (Johansson et al., 2009).
Moreover, combination therapies [i.e., Contrave (Apovian
et al., 2013) andQysmia (Gadde et al., 2011)] also held promise for obesity treatment, and preclinical studies performed using a combination of opioid and cannabinoid antagonists (naloxone and nor-BNI with rimonabant) demonstrated enhanced feeding reduction when compared to that evoked by rimonabant alone (Lockie et al., 2011, 2015).
Against this background, the aim of this study was to advance our knowledge about the molecular mechanisms engaging ECS and EOS in the development of obesity, in order to identify disease biomarkers and disclose new molecular clues to be targeted by innovative strategies of pharmacological intervention. By using a well-established rat model of Diet-Induced Obesity (DIO), we first investigated regulation of ECS and EOS genes expression during disease progression in the hypothalamus,
a brain region involved in appetite regulation (Bazhan and
Zelena, 2013), where the role of ECS (Berthoud, 2012;Zeltser et al., 2012;Ramírez-López et al., 2015) and EOC (Dum et al., 1983; Nogueiras et al., 2012; Romero-Picó et al., 2018) in feeding response modulation has been deeply investigated and already reported. We followed gene expression regulation at the beginning of obesity development (i.e., after 5 weeks on high fat diet), as well as when the phenotype was well-established (i.e., after 21 weeks on high fat diet). Among the epigenetic mechanisms possibly responsible for altered gene expression, we focused on DNA methylation, that consists of a methyl group transfer to the position 5 of the cytosine pyrimidine ring in a cytosine guanine dinucleotide (CpG), which ultimately blocks the binding of transcription factors thus causing chromatin
compaction and gene silencing (Zhu et al., 2016). Of note, by
using the same DIO animal model considered here, we already showed the epigenetic regulation of other obesity genes in the progression of the disorder (Cifani et al., 2015).
In addition, in this work, we also analyzed the DNA methylation status of key ECS and EOS genes in peripheral blood mononuclear cells (PBMCs) from a subset of humans with obesity. It is important to recall that PBMCs contain the complete epigenetic machinery present in neurons (Arosio et al., 2014), and are considered a convenient substitute for cerebral markers (Woelk et al., 2011) that are readily accessible and reflects the molecular processes occurring in the central nervous system (Gladkevich et al., 2004). PBMCs have been already proposed in obesity studies as a valuable tool to monitor metabolic recovery in weight loss strategies (Reynés et al., 2015), and thus their study in this disorder is of clear relevance to detect altered pathways
(metabolic or signaling) that could be transferred to the brain. Moreover, it has been well-documented since many years the activation of the ECS in human obese subjects and the regulation of EOS components in obesity and related eating disorders in the periphery (Jimerson and Wolfe, 2004).
MATERIALS AND METHODS
Animals and Diet Composition
Male Sprague Dawley rats (Charles River; totaln = 38; 225–250 g, 7 weeks old at the beginning of the experiments) were used. Rats were housed in individual cage sunder 12:12 h light/dark cycle (lights on at 9:00 a.m.) with access to food and waterad libitum for 2 weeks before the experiments. They were kept in a room
at constant temperature (20–22◦
C) and humidity (45–55%). All procedures involving rats were carried out in accordance with the Institutional Guidelines and complied with the Italian Ministry of Health and associated guidelines from European Communities Council Directive. Rats were randomly divided into two groups with comparable mean body weight (no significant difference). The first group (n = 16) was the control group and was fed with
standard laboratory chowad libitum (4RF18, Mucedola, Settimo
Milanese, Italy; 2.6 kcal/g); the second group (n = 22), was fed with high energy diet (45% fat, 35% Carbohydrate, 20% Protein) ad libitum (D12451, Research Diets, Inc., New Brunswick, NJ, United States; 5.24 kcal/g). After 5 weeks, 6 of the 22 rats fed with high fat diet did not significantly increase body weight in comparison to rats fed with chow. These resistant rats were excluded from the study (Cifani et al., 2015) because they did not develop obese phenotype. At the end of the 5 weeks, eight Chow and eight DIO rats were sacrificed by decapitation. The remaining animals (additional eight Chow and eight DIO rats) were maintained on their respective diets for 21 weeks, and then were sacrificed. Brains were quickly removed and the whole hypothalamus was manually dissected (from Bregma level −0.26 to Bregma level −4.20) (Paxinos and Watson, 1998). The tissues were collected and stored at −80◦
C until further analysis. Body weight and food intake were daily recorded (Figure 1).
Human Subjects
Patients and Methods
Editorial policies and ethical considerations
The study, accomplishing the Declaration of Helsinki, was approved by the Ethic Committee of IRCCS – Istituto Auxologico Italiano (RBFR12DELS_004/05C302_2013), and all patients or their tutors gave a written informed consent.
Study population
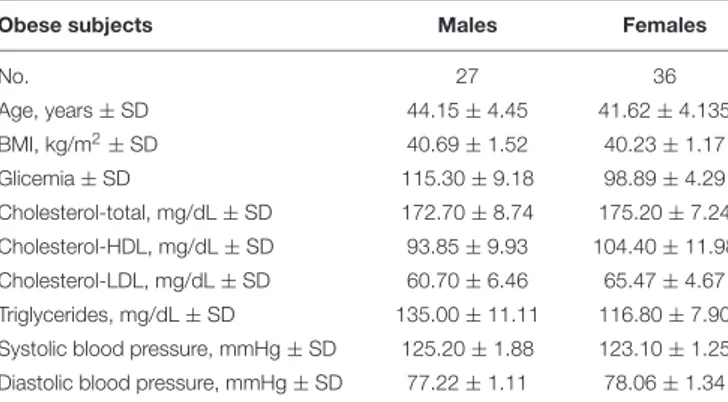
The entire cohort consists of 63 humans with obesity recruited from the San Giuseppe Hospital’s and San Luca Hospital’s (Istituto Auxologico Italiano) since 2012. Clinical characteristics of our cohort are reported in Table 1. Anonymous patient data, referred to the time of diagnosis, were collected either prospectively or retrospectively and a clinical database was created. We performed the same epigenetic analysis in 58
non-obese blood donors matching for age and sex (Males: No. = 32, age = 42.27 ± 2.97; Females: No. = 26, age 40.87 ± 4.12).
Data collection
In this study all humans with obesity had physical examination and biochemistry analyses. To perform the body weight and height measurements, subjects were dressed in light clothing without socks and shoes. Weight was measured (in kg to two decimal places) with a digital balance scale. Height was mea-sured with a wall-mounted stadiometer (to the nearest milli-meter) using the stretch technique. Body mass index (BMI) was calculated using the Quetelet’s formula as weight (in kg) divided
by height (in m2). Systolic (SBP) and diastolic (DBP) blood
pressure were measured in the seated position with a Tema Certus sphygmomanometer and an appropriately sized cuff on the right arm. These values were obtained as the average of three measurements. Blood samples were separated by centrifugation after clotting, and aliquots of serum or plasma supernatants were
processed for routine measurements and stored at −80◦
C until assay. Routine laboratory data included levels of glucose, total cho-lesterol, high-density (HDL) and low-density lipoprotein (LDL) cholesterol, triglycerides (TG) determined by enzymatic assays (Roche Diagnostics GmbH, Mannheim, Germany). Anthropo-metrical and biochemical measurements were made once for each participant. According to the World Health Organization guidelines, obesity was defined as BMI ≥ 30 kg/m2(WHO, 2000). Non-obese blood donors were selected in accordance with National mandatory standards for blood donor selection. They were known to be free from chronic disease (including diabetes, hypertension, dyslipidemia, and cardiovascular disease), not taking any drugs and with BMI< 29.9 kg/m2.
Molecular Biology Studies
Real-Time Quantitative PCR
Total RNA was isolated using TRIzol reagent (Thermo Fisher Scientific) according to the specifications of the instructions, from rat dissected Hypothalamus and from PBMCs, separated by density gradient using the Lympholyte-H kit (Cedarlane
Laboratories, Canada). Each 0.5 µg of total RNA was
reverse-transcribed into complementary DNA using a RevertAid RT Reverse Transcription Kit (Thermo Scientific). Random hexamers and oligo-dT primers were used in the RT reaction in an unbiased manner Quantitative PCR was performed using an Applied Biosystems 7500 Real-time PCR system (Thermo Fisher Scientific) with SensiFAST SYBR Low-ROX kit
(Bioline) in a total reaction volume of 10 µl according to the
manufacturer’s instructions. The thermal cycles were as follows: initial denaturation at 95◦
C for 2 min; 45 cycles of denaturation at 95◦
C for 15 s; annealing and extension at 60◦
C for 15 s. Relative mRNA expression levels were calculated using the
2−DDCtmethod and normalized to two internal control,β-actin
and GAPDH. The primers used for the amplification of ECS and EOS genes are reported in Supplementary Table S1.
DNA Methylation Analysis by Pyrosequencing
Genomic DNA was extracted from hypothalamic region and PBMC by using TRIzol Reagent (Life Technologies)
fgene-10-00523 June 14, 2019 Time: 16:53 # 4
Pucci et al. OPRM1 and CNR1 Genes in Obesity
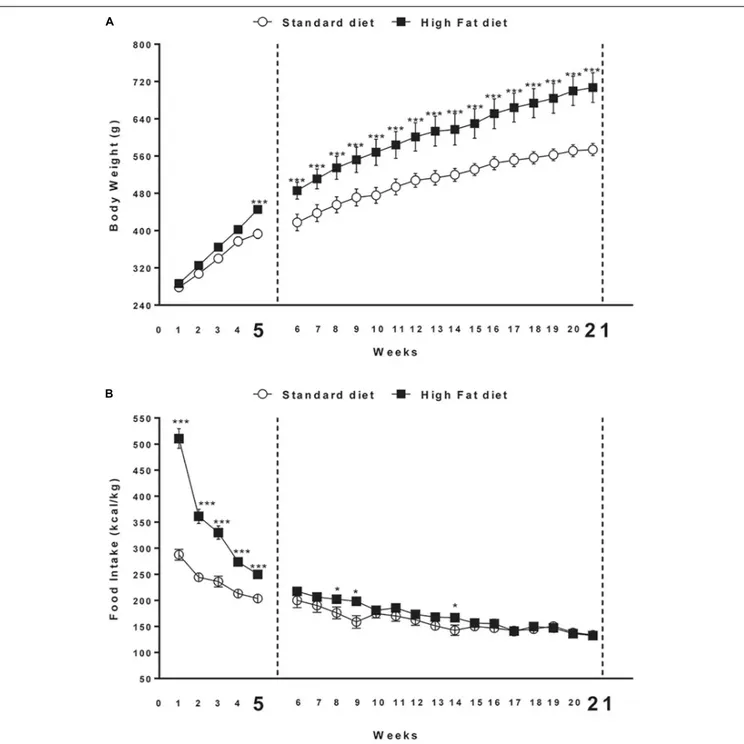
FIGURE 1 | (A) Body weight and (B) cumulative food intake (kcal) measured weekly in rats exposed for 5 and 21 weeks to high fat (HFD) or standard diet (STD). Significant differences are indicated:∗ ∗ ∗
P< 0.001,∗
P< 0.05 vs. STD.
with the concentration and purity detected by NanoDrop spectrophotometer (NanoDrop Technologies, United States). DNA was subjected to bisulfite modification by means of a commercially available modification kit (Zymo Research). Pyrosequencing was used to quantify the methylation levels of individual CpG sites. The sequencing was performed for all the study samples on a PyroMark Q24 ID using Pyro Mark Gold
reagents (Qiagen). Primers for rat and humanCNR1, the gene
coding for the cannabinoid receptor type 1 (CB1) (targeting in
rats eight CpG sites and in humans five CpGs) andOPRM1, the
gene coding for mu opioid receptor (MOP) (targeting in rats four CpG sites and in humans five CpGs), were generated according to Pyro Mark Assay Design software version 2.0 (Qiagen). The
schematic representation of CpG island atCNR1 and OPRM1
promoter regions and the details of the pyrosequencing assay are illustrated in Figure 2 and Supplementary Table S2. Bisulfite treated DNA was amplified by PyroMark PCR Kit (Qiagen) according to the manufacturer’s protocol. Polymerase chain
TABLE 1 | Clinical characteristics and biochemical parameters of subjects enrolled for the DNA methylation study.
Obese subjects Males Females
No. 27 36 Age, years ± SD 44.15 ± 4.45 41.62 ± 4.135 BMI, kg/m2±SD 40.69 ± 1.52 40.23 ± 1.17 Glicemia ± SD 115.30 ± 9.18 98.89 ± 4.29 Cholesterol-total, mg/dL ± SD 172.70 ± 8.74 175.20 ± 7.24 Cholesterol-HDL, mg/dL ± SD 93.85 ± 9.93 104.40 ± 11.98 Cholesterol-LDL, mg/dL ± SD 60.70 ± 6.46 65.47 ± 4.67 Triglycerides, mg/dL ± SD 135.00 ± 11.11 116.80 ± 7.90 Systolic blood pressure, mmHg ± SD 125.20 ± 1.88 123.10 ± 1.25 Diastolic blood pressure, mmHg ± SD 77.22 ± 1.11 78.06 ± 1.34
reaction conditions were as follows: 95◦
C for 15 min, followed by 45 cycles of 94◦
C for 30 s, 56◦
C for 30 s, 72◦
C for 30 s, and finally, 72◦
C for 10 min. Polymerase chain reaction products were verified by agarose electrophoresis. Pyromark Q24 ID version 1.0.9 software, which generates and automatically analyzes the resulting pyrograms, was used to calculate the methylation per-centage mC/(mC + C) (where mC is methylated cytosine and C is unmethylated cytosine), for each CpG site, allowing quantitative comparisons. Quantitative methylation results were considered both as a percentage of individual CpG sites and as an average of the methylation percentage of the all the investigated CpGs.
Statistical Analysis
All results are expressed as mean ± SEM. Statistical differences of genes expression and DNA methylation changes at gene promoters in both human and animal samples were determined using Prism version 6 (Graph-Pad Software, San Diego, CA, United States). In behavioral experiments, data were analyzed
by two-way ANOVA with the animal group as the between-subject variable and time as the within-between-subject variable followed
by post hoc comparison carried out by the Bonferroni test.
In molecular biology studies, data were analyzed by two-way ANOVA with the animal group as the between-subject variable and CpG sites as the within-subject variable. Significant differences induced by diet were analyzed using the Mann–
WhitneyU test. DNA methylation at each CpG site was analyzed
using the Mann–Whitney test and Sidak–Bonferroni correction was used for the multiple comparisons. TheP-values< 0.05 were considered to be statistically significant.
RESULTS
High Fat Diet Effect on Body
Weight and Food Intake
At the beginning of the study, body weight of rats in the high fat diet group (278.3 ± 7.0 g) did not differ significantly from that of the rats in the control group (286.2 ± 6.3 g) [F(1,30) = 0.7;
P > 0.05]. At the end of the fifth week, two-way ANOVA
showed a significant difference in body weight between the groups (Diet: [F(1,30) = 7.2;P < 0.05]; Time: [F(4,120) = 297.5; P < 0.01]; Interaction: [F(4,120) = 6.7;P < 0.01]). At the fifth
week time point,post hoc test showed that body weight of DIO
rats began to be significantly higher compared to that of control group (P< 0.05).
At the end of the 21st week, two-way ANOVA showed a significant difference in body weight between the groups (Diet: [F(1,14) = 10.0;P< 0.01]; Time: [F(20,280)= 230.2;P< 0.001]; Interaction: [F(20,280) = 5.3; P < 0.001]). At the same time point (21st week) of free access to high fat diet, post hoc test
FIGURE 2 | Schematic representation of rat and human Cnr1 and Oprm1 genes. Position of transcription start site (TSS), translation start code (ATG), exons and introns, CpG island are depicted. Details of the sequences under study for DNA methylation are shown in Supplementary Table S2.
fgene-10-00523 June 14, 2019 Time: 16:53 # 6
Pucci et al. OPRM1 and CNR1 Genes in Obesity
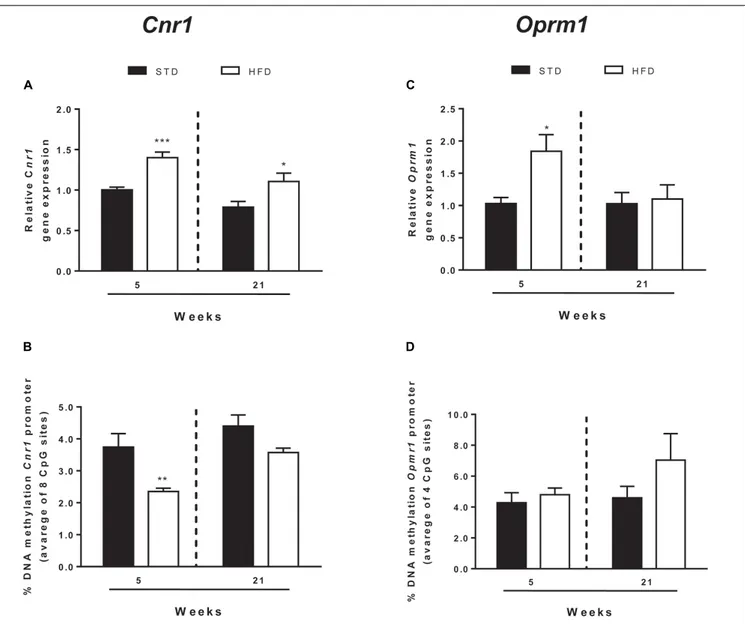
FIGURE 3 | Cnr1 and Oprm1 transcriptional regulation. Cnr1 relative gene expression (A) and DNA methylation at gene promoter (B) and Oprm1 relative gene expression (C), and DNA methylation at gene promoter (D) analyzed in the hypothalamus of rats exposed for 5 and 21 HFD and/or STD Gene expression data are reported as 2-DDCtvalues calculated by Delta–Delta Ct (DDCt) method vs. STD (5 weeks) posed equal to 1. DNA methylation data are presented as the mean of the
methylation % values of individual CpG sites under study as well as of the average (Ave) of the eight CpG sites ± SEM.∗ ∗ ∗
P< 0.001,∗ ∗
P< 0.01,∗
P< 0.05 vs. STD.
showed that body weight of DIO rats was significantly higher in comparison to body weight of rats fed with standard diet (591.0 ± 2.2 g) (P< 0.001; Figure 1A).
Overall ANOVA showed a significant difference in energy intake (kcal/kg) between the groups in the first 5 weeks (Diet: [F(1,30) = 110.9;P< 0.001]; Time: [F(4,120)= 117.7;P< 0.001]; Interaction: [F(4,120)= 29.8;P< 0.001]). At the end of the 21st week, two-way ANOVA showed a significant interaction between diet and time [F(4,120)= 29.9;P< 0.001]. Significant differences at each time point are shown in Figure 1B. Open field test showed significant difference between the groups in Distance travel, Vertical count, Grooming and Zone Entries only after 21 weeks of diet exposure (Supplementary Table S3).
Regulation of ECS and EOS Genes
Transcription in the Hypothalamus
ECS
In addition to CB1, endocannabinoid signaling is based on
a rather complex array of proteins that form the so-called ECS. These include additional receptor targets, like type-2
cannabinoid receptor (CB2) and transient receptor potential
vanilloid-1 (TRPV1) channels, and metabolic enzymes involved
in biosynthesis and degradation of endocannabinoids (Chiurchiù
et al., 2018). All these elements of ECS were analyzed by qRT-PCR (Figure 3 and Table 2).
After 5 and 21 weeks, statistical analysis showed no
TABLE 2 | Gene expression of ECS and EOS elements in the hypothalamus of normal weight and overweight rats exposed for 5 and 21 weeks to high fat and/or standard diet, reported as 2−DDCtvalues calculated by Delta–Delta Ct (DDCt)
method vs. normal weight (5 weeks) posed equal to 1.
HYP 5 weeks 21 weeks
Gene STD HFD STD HFD ECS Cnr1 1.03 ± 0.03 1.42 ± 0.09a 0.79 ± 0.07 1.18 ± 0.16c Cnr2 1.21 ± 0.25 1.16 ± 0.70 1.98 ± 0.57 1.90 ± 0.59 Gpr55 1.22 ± 0.29 1.10 ± 0.21 1.44 ± 0.14 1.54 ± 0.27 Trpv1 1.24 ± 0.30 1.34 ± 0.45 1.22 ± 0.29 0.78 ± 0.06 Nape-Pld 1.06 ± 0.10 1.08 ± 0.15 1.10 ± 0.13 1.08 ± 0.18 Faah 1.09 ± 0.17 0.87 ± 0.12 1.36 ± 0.12 1.48 ± 0.10 Dagl 1.05 ± 0.13 1.49 ± 0.26 0.74 ± 0.07 0.58 ± 0.05 Magl 1.04 ± 0.11 1.14 ± 0.14 0.94 ± 0.08 0.88 ± 0.13 Opiod Oprl1 0.98 ± 0.05 1.23 ± 0.08 1.11 ± 0.12 1.15 ± 0.02 system Oprm1 1.03 ± 0.09 1.84 ± 0.26b 1.03 ± 0.17 1.10 ± 0.22 Oprd1 1.03 ± 0.11 1.36 ± 0.22 0.73 ± 0.09 0.71 ± 0.07 Oprk1 1.05 ± 0.17 1.23 ± 0.30 1.29 ± 0.23 1.19 ± 0.30 Pomc 1.18 ± 0.33 0.89 ± 0.22 1.19 ± 0.30 0.73 ± 1.19 Pnoc 1.03 ± 0.10 1.48 ± 0.17 1.00 ± 0.13 0.89 ± 0.11 Pdyn 1.04 ± 0.11 1.30 ± 0.23 1.02 ± 0.12 0.97 ± 0.08 Penk 1.01 ± 0.04 0.99 ± 0.15 1.06 ± 0.13 1.15 ± 0.17 ap< 0.05 vs. STD;bp< 0.01 vs. STD;cp< 0.001 vs. STD.
TABLE 3 | DNA methylation changes at Cnr1 gene promoter in the hypothalamus of normal weight and overweight rats exposed for 5 weeks to high fat
and/or standard diet.
Cnr1 5 weeks 21 weeks CpG sites STD HFD STD HFD 1 4.55 ± 0.48 4.24 ± 0.42 5.11 ± 0.31 5.28 ± 0.67 2 4.76 ± 0.64 2.30 ± 0.28b 5.49 ± 0.63 4.64 ± 0.29 3 3.37 ± 0.45 1.37 ± 0.10c 3.83 ± 0.35 2.77 ± 0.26 4 6.36 ± 0.87 3.81 ± 0.28a 8.17 ± 0.73 6.15 ± 028 5 1.31 ± 0.21 1.01 ± 0.20 1.69 ± 0.14 1.43 ± 0.18 6 2.22 ± 0.23 1.69 ± 0.13 2.35 ± 0.25 2.14 ± 0.20 7 3.13 ± 0.45 2.23 ± 0.28 3.64 ± 0.29 2.67 ± 0.28 8 3.77 ± 0.35 2.60 ± 0.25a 4.30 ± 0.48 3.21 ± 0.23 Average 3.72 ± 0.43 2.46 ± 0.11a 4.33 ± 0.32 3.54 ± 0.17 ap< 0.05 vs. STD;bp< 0.01 vs. STD;cp< 0.001 vs. STD.
gene encoding for CB1 (Table 2). Two-way ANOVA showed
that mRNA levels were affected by time [F(1,25) = 10.50,
P = 0.003] and diet [F(1,25) = 20.72, P = 0.0001], without a
significant interaction between these two factors [F(1,25) = 0.27, P = 0.607]. T-test revealed a selective and significant increase
in Cnr1 mRNA levels in HFD rats with respect to STD
animals at both time points analyzed (5 weeks = P < 0.0006;
21 weeks =P< 0.036; Figure 3A).
DNA methylation analysis of each CpG site, and as an average
of all eight CpG sites analyzed at the Cnr1 promoter, showed
significant changes in rats after 5 weeks on high fat diet (t-test:
P =< 0.006; Figure 3B and Table 3). Two-way ANOVA showed
that DNA methylation was affected by time [F(1,26) = 6.62,
P = 0.016] and diet [F(1,26)= 5.34,P = 0.029], without a significant interaction between these two factors [F(1,26)= 0.024,P = 0.876].
Moreover, a t-test corrected by Sidak–Bonferroni multiple
comparisons indicated a significant decrease ofCnr1 methylation levels at sites 2, 3, 4, and 8, as well as in the average of the eight sites analyzed, when compared to the STD group. No changes in DNA methylation were observed after 21 weeks (Table 3 and
Figure 3B). Consistently, a correlation between gene expression and average DNA methylation was also observed in overweight and normal weight animals after 5 weeks of diet (Spearman r = 0.609; P = 0.018; Figure 4A), but not after 21 weeks (Spearman r = 0.316; P = 0.271; Figure 4B).
EOS
EOS consists of four receptors, mu (OPRM1), delta (OPRD1), kappa (OPRK1), and Opioid related nociceptin receptor 1 (OPRL1) which are activated by endogenous opioid peptides processed from four protein precursors, proopiomelanocortin (POMC), proenkephalin (PENK), prodynorphin (PDYN) and
pronociceptin (PNOC) (Corbett et al., 2006; Bodnar, 2010).
Among EOS elements, only the expression of genes encoding
for the receptors Oprm1 and Oprd1 were altered (Figure 3
and Table 4). Two-way ANOVA showed that Oprm1 mRNA
levels were affected by diet [F(1,25) = 4.90, P = 0.036] but
not by time [F(1,25) = 3.45, P = 0.07], and there was no
significant interaction between these two factors [F(1,25)= 3.43, P = 0.07]. T-test revealed a selective and significant increase
in Oprm1 mRNA levels in rats after 5 weeks on high fat
diet with respect to STD animals (5 weeks = P < 0.05;
Figure 3Cand Table 4).
DNA methylation analysis of each CpG site, and as an average
of all four CpG sites analyzed at theOprm1 promoter, did not
show any significant change in rats exposed for 5 and 21 weeks to high fat diet (Table 4 and Figure 3D), nor any correlation between gene expression and average DNA methylation (at
5 weeks: Spearmanr = −0.001; P = 0.961; at 21 weeks: Spearman
r = −0.304; P = 0.282; Figures 4C,D).
DNA Methylation at CNR1 and OPRM1
Promoter Regions in Clinical Samples
We sought to extend the analysis of DNA methylation atCNR1
and OPRM1 promoters in the preclinical animal model to a
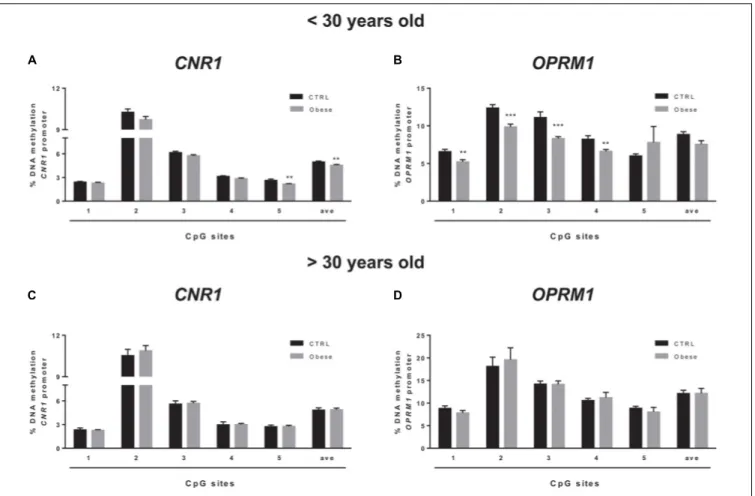
group of humans with obesity and matched healthy controls (CTRLs). In these samples, we failed to observe any alteration of the epigenetic hallmark at both gene promoters in the overall population (Table 5). Yet, data stratification based on subject age showed significant differences at both gene promoters in individuals younger than 30 years (Figure 5). Namely, DNA
methylation at CNR1 promoter was lower in humans with
obesity at CpG 5 (CTRLs = 2.62 ± 0.17, obese = 2.16 ± 0.06; p = 0.006), as well as at the average of the five CpG sites under study (CTRLs = 4.97 ± 0.11, obese = 5.58 ± 0.10;p = 0.008), when compared to age-matched controls (Figure 5A). Instead, DNA
methylation atOPRM1 promoter was significantly lower in obese
subjects at CpG 1 (CTRLs = 6.57 ± 0.31, obese = 5.28 ± 0.30;
fgene-10-00523 June 14, 2019 Time: 16:53 # 8
Pucci et al. OPRM1 and CNR1 Genes in Obesity
FIGURE 4 | Correlation between Cnr1 expression and % change of DNA methylation after 5 (A) and 21 weeks of diet (B). Correlation between Oprm1 expression and % change of DNA methylation after 5 (C) and 21 weeks of diet (D). Data were analyzed by Spearman’s rank correlation coefficient.
p< 0.001), CpG 3 (CTRLs = 11.10 ± 0.76, obese = 8.31 ± 0.27; p< 0.001) and CpG 4 (CTRLs = 8.22 ± 0.47, obese = 6.61 ± 0.25;
p< 0.01), when compared to age-matched controls (Figure 5A)
No differences in DNA methylation were observed between
TABLE 4 | DNA methylation changes at Oprm1 gene promoter in the
hypothalamus of normal weight and overweight rats exposed for 5 and 21 weeks to high fat and/or standard diet.
Oprm1 5 weeks 21 weeks
CpG sites STD HFD STD HFD 1 3.56 ± 0.62 4.16 ± 0.40 3.05 ± 1.14 4.64 ± 1.00 2 7. 30 ± 1.13 8.55 ± 0.57 8. 05 ± 1.16 7.31 ± 0.52 3 2. 81 ± 0.45 2.92 ± 0.67 3. 38 ± 0.59 5.15 ± 1.40 4 3.46 ± 0.43 3.54 ± 0.34 3.90 ± 0.68 4.82 ± 1.12 Average 4.28 ± 0.64 4.80 ± 0.44 4.60 ± 0.75 7.04 ± 1.72
obese and healthy controls in subjects older than 30 years (Figure 5B). We also observed the DNA methylation levels on CNR1 and OPRM1 gene promoters in humans with obesity and Ctrl stratified for gender (Supplementary Figure S1).
TABLE 5 | DNA methylation changes at human CNR1 and OPRM1 gene promoters in controls (CTRL) and humans with obesity.
Gene CNR1 OPRM1
CpG sites CTRL Obese CTRL Obese
1 2.36 ± 0.14 2.27 ± 0.07 7.87 ± 0.37 7.11 ± 0.32 2 10.41 ± 0.28 10.39 ± 0.25 15.62 ± 1.20 14.76 ± 0.83 3 5.84 ± 0.24 5.72 ± 0.15 12.90 ± 0.56 12.04 ± 0.57 4 3.03 ± 0.22 2.93 ± 0.10 9.55 ± 0.38 9.03 ± 0.43 5 2.70 ± 0.13 2.52 ± 0.09 7.65 ± 0.35 8.03 ± 0.95 Average 4.87 ± 0.17 4.74 ± 0.13 10.72 ± 0.50 10.19 ± 0.47
FIGURE 5 | Comparison of DNA methylation status at human CNR1 (A,C) and OPRM1 (B,D) promoters in the obese population and control (CTRL) subjects stratified based on age (A,B =< 30 years old; C,D > 30 years old). The bars represent the mean of the % of methylation values of individual CpG sites under study as well as of the average (ave) of the CpG sites ± the SEM. Significant differences are indicated:∗ ∗P< 0.01;∗ ∗ ∗P< 0.001 vs. CTRL.
No differences in the % of DNA methylation of CNR1
were observed in female and male subjects (Supplementary
Figures S1A,B). Lower levels in DNA methylation at OPMR1 were observed in human males with obesity at CpG site 3
(CTRLs = 13.45 ± 0.65, obese = 10.13 ± 0.79,P< 0.004), CpG
site 4 (CTRLs = 9.94 ± 0.45, obese = 7.61 ± 0.52, P< 0.003), as well as at the average of the five CpG sites under study
(CTRLs = 10.96 ± 0.49, obese = 8.72 ± 0.64, P < 0.010),
when compared to CTRLs (Supplementary Figure S1A). No
differences in the % of DNA methylation of OPRM1 were
observed in female subjects (Supplementary Figure S1B). Considering just the humans with obesity, DNA methylation differences were not observed after data stratification based on gender (Supplementary Figure S2). Focusing on the obese population only, DNA methylation differences were observed after data stratification based on the time length from obesity
onset (Figure 6). Additionally, methylation atCNR1 promoter of
subjects that were obese for more than 5 years was higher than that of humans with obesity for a shorter time. In particular, we observed a significant increase at two of the five sites analyzed, namely at the second (CTRLs = 9.78 ± 0.23, obese = 11.32 ± 0.37;
p < 0.008) and at the fifth (CTRLs = 2.23 ± 0.06, obese =
2.80 ± 0.13; p < 0.14) CpG site, respectively (Figure 6A).
Methylation of the combined five CpG sites analyzed in the
promoter region ofOPRM1 showed a significant increase in DNA
methylation of humans with obesity for a long time (>5 years from onset) (CTRLs = 7.36 ± 0.51, obese = 11.51 ± 0.95; p< 0.001). Moreover, we observed a significant increase in the
first (CTRLs = 4.91 ± 0.24, obese = 7.73 ± 0.50; p < 0.001),
second (CTRLs = 9.49 ± 0.34, obese = 18.18 ± 2.23;p< 0.001), third (CTRLs = 8.00 ± 0.21, obese = 13.42 ± 0.73;p< 0.001), and fourth (CTRLs = 6.45 ± 0.25, obese = 10.50 ± 1.01; p < 0.001) CpG site analyzed (Figure 6B). Finally, differences were also observed when considering the BMI of humans
with obesity, and post hoc group differences are reported in
Supplementary Figure S3. Focusing on humans with obesity younger than 30 years, we compared the DNA methylation
status at CNR1 and OPRM1 promoters in Preadolescents
(8–12 years old), Adolescents (13–17), Young adults (18–30)
(Supplementary Figure S4). A t-test corrected by Sidak–
Bonferroni multiple comparisons indicated a significant increase
of OPRM1 methylation levels at CPG site 3 of young adults,
when compared to the adolescents (Adolescent = 7.96 ± 0.26,
Young adult = 9.85 ± 0.78, P < 0.008). Association remained
for all stratified data, after Sidak–Bonferroni correction for multiple testing.
fgene-10-00523 June 14, 2019 Time: 16:53 # 10
Pucci et al. OPRM1 and CNR1 Genes in Obesity
FIGURE 6 | Comparison of the DNA methylation status at human CNR1 (A) and OPRM1 (B) promoters in the obese population stratified based on the years from obesity onset. The bars represent the mean of the % of methylation values of individual CpG sites under study as well as of the average (ave) of the CpG sites ± the SEM. Significant differences are indicated:∗
P< 0.05;∗ ∗
P< 0.01;∗ ∗ ∗
P< 0.001 vs. obese > 5.
DISCUSSION
The first outcome of this study is the selective up-regulation
of the expression of Cnr1, the gene coding for CB1, and of
Oprm1, the gene coding for MOP, in the hypothalamus of rats exposed to high fat diet for 5 and 21 weeks. These alterations were present at both time-points analyzed for CB1, that appeared
to be engaged in long-lasting effects, and only at the beginning of obesity development for MOP, that appeared to be engaged in obesity onset only. Of note, we failed to observe any alteration in any other component of the ECS and of the EOS, speaking in favor of a distinct role of the two receptors in obesity.
Our data are thus consistent with many studies that already
showed the hyperphagic role of CB1 (Williams and Kirkham,
1999; Jamshidi and Taylor, 2001; Verty et al., 2005; Koch et al., 2015) and MOP (Smith et al., 2002) in this brain region. Hypothalamic administration of the endocannabinoid
anandamide (Jamshidi and Taylor, 2001) or of the cannabis
extract tetrahydrocannabinol (THC) (Verty et al., 2005), both
primarily acting though CB1in the brain, rapidly increases food
intake in rats. Studies focused on the hypothalamus documented also that high-fat feeding increases MOP protein levels in Wistar rats (Smith et al., 2002), as well as in rats susceptible to obesity (Barnes et al., 2006).
The link between these two receptors in the promotion of feeding has been proposed by Kock and colleagues, who showed
that this effect can be due to CB1 activation on POMC neurons
leading to the release of β-endorphin, an opioid neuropeptide
acting on MOP (Koch et al., 2015).
Despite the great amount of research showing CB1 levels
dysregulation centrally in animal models of obesity (South and
Huang, 2008; Massa et al., 2010), there is less information
about altered hypothalamicCnr1 mRNA levels, which anyhow
have been reported by some (Kempf et al., 2007; Gamelin
et al., 2016; Ramirez-Lopez et al., 2016). Consistently with
our present findings, Cnr1 mRNA levels increased in female
offspring hypothalami from rat dams fed a high caloric diet (Ramirez-Lopez et al., 2016). Moreover, receptor knockdown in
mice hypothalamus induced a reduction in body weight while
increasing energy expenditure (Cardinal et al., 2012). On the
other hand, receptor gene expression was down-regulated in the hypothalamus of rats fed with a palatable high-energy diet (Timofeeva et al., 2009). It seems noteworthy that in a recent analysis of the transcriptional regulation of ECS components in an animal model of binge eating behavior, we observed a selective epigenetic regulation of fatty acid amide hydrolase, the
key enzyme for the degradation of anandamide, instead,Cnr1 and
all other ECS components were not affected (Pucci et al., 2018). This seems of particular relevance if one aims at finding specific biomarkers for different eating disorders and related disturbances (such as obesity).
The involvement of MOP gene regulation in obesity has also been investigated. MOP KO mice fed a high-fat diet were resistant to obesity (Tabarin et al., 2005), even though others also showed that MOP KO mice on a standard diet increased body weight
in adulthood, when compared to wild-type littermates (Han
et al., 2006). Analysis of gene expression showed increased MOP mRNA levels in hypohalami of the offspring of obese pregnant mice (Vucetic et al., 2010; Grissom et al., 2014), whereas no changes were observed in mice fed from weaning with high-fat diet for around 15 weeks (Vucetic et al., 2011).
In order to characterize MOP and CB1 transcriptional
regulation, we sought to compare hypothalamic genes DNA methylation. We observed a consistent reduction of the
epigenetic hallmark atCnr1 promoter, in four of the eight CpG
sites under study as well as in their methylation average, but only at the earliest time-point (5 weeks). However, no changes were observed in MOP DNA methylation. These findings suggest that
the temporary hypomethylation atCnr1 gene at the beginning of
obesity development might be responsible of the early changes observed in gene expression; yet, it does not seem necessary in the long term, when chromatin might be in a poised state with mRNA levels resulting still high. At any rate, this is the first
report showing DNA methylation of Cnr1 in obesity, whereas
others have already addressed MOP epigenetic regulation in mice reward-related brain regions of the offspring of pregnant dams exposed to chronic high-fat diet (Vucetic et al., 2011). In partial agreement with our data, also the latter studies failed to show alterations of methyl CpG-binding protein, as well as of histone acetylation, at MOP gene promoter in the hypothalamus (Vucetic et al., 2011). Very recently the hypothalamic increase in
histone acetylation was instead reported atCnr1 gene promoter,
and was linked to increased hypothalamic receptor expression (Almeida et al., 2019).
With the aim to extend the study of CB1and MOP receptors to
human obesity, we assessed whether PBMCs might mirror central nervous system defects, and we then evaluated DNA methylation
atCNR1 and OPRM1 gene promoters in PBMCs of humans with
obesity. We failed to observe any difference between controls and humans with obesity in the overall population, yet age-based stratification of the data clearly showed a significant reduction
of the epigenetic hallmark at bothCNR1 and OPRM1 promoters
in younger (<30 years old) humans with obesity. As for CNR1, an age-dependent modulation was observed at one of the five CpG sites analyzed, as well as at their average, possibly driving an
up-regulation of gene expression compared with normal weight subjects. Instead, in the same population DNA methylation was reduced in four of the five CpG sites analyzed. These differences for both receptors did not occur in subjects older than 30 years. Our findings appear of particular relevance if one attempts to identify early disease biomarkers. In agreement with this, a lower DNA methylation was also observed at genes promoters of humans with obesity with a shorter time length from disorder onset, and in those with lower BMI.
At the clinical level, it seems noteworthy that an increased CNR1 expression in obesity has been shown at the peripheral level (Pagano et al., 2007; Sarzani et al., 2009), but never in blood samples from human subjects. Moreover, to the best of
our knowledge,OPRM1 expression in humans with obesity has
not been studied yet, with the only available PET clinical study in different brain regions reporting lower MOP availability in obese subjects compared to controls (Karlsson et al., 2015).
Overall, our findings in human peripheral samples confirm the data observed centrally in the animal model, showing that
regulation of CNR1 and OPRM1 genes is altered mainly at the
early stage of phenotype development, at least in terms of the epigenetic hallmarks analyzed.
CONCLUSION
In conclusion, epigenetic switching appears dynamic and temporary in the preclinical and clinical models used here to
investigateCNR1 and OPRM1. Alterations of DNA methylation
in these two genes, observed earlier in the obese phenotype as a result of early exposure (i.e., to high-fat diet or, for instance, to stressful conditions), disappear at a later stage in life. Thus,
here we clearly show the relevant role of CNR1 and OPRM1
transcriptional regulation as a possible biomarker for obesity and, due to the reversible nature of the epigenetic hallmark, our data open new avenue for environmental strategies of intervention. As yet, conventional environmental strategies for the treatment of obesity include lifestyle modifications of diet and physical activity, and are often insufficient (Blevins, 2010). However, this might be also due to the lack of an early diagnosis. In line with this, our data support the relevance of a preventive therapeutic approach based on environmental factors.
Of relevance, a very recent study has reported altered DNA methylation on obesity-related genes in healthy adolescents, and these alterations were suggested as early life changes possibly associated with elevated disease risk in adulthood (He et al., 2019).
Study Limitations
We should point out that we analyzed PBMCs, composed of different cell types with different DNA methylation profiles (Bell et al., 2011). However, in order to extract homogeneous populations, cell manipulation is required, which is a laborious and difficult procedure to standardize, possibly affecting gene expression profiles (Whitney et al., 2003; Debey et al., 2004). Therefore, laser capture micro-dissected tissues might be used to address this issue in future studies. Moreover, for a better
fgene-10-00523 June 14, 2019 Time: 16:53 # 12
Pucci et al. OPRM1 and CNR1 Genes in Obesity
understanding of the relationship between blood and brain in terms of epigenetic modulation, it would be of interest to study also in rats transcriptional regulation of genes in blood. In addition, it seems necessary to extend the present study to a larger cohort of human subjects, possibly by using innovative methods to achieve cell-sorting, and to add different preclinical experimental models of obesity to further characterize the
epigenetic regulation ofCNR1 and OPRM1 expression, as well as
the relationship between their peripheral and central modulation.
DATA AVAILABILITY
The raw data supporting the conclusions of this manuscript will be made available by the authors, without undue reservation, to any qualified researcher.
ETHICS STATEMENT
This study was carried out in accordance with the recommen-dations of “name of guidelines, name of committee” with written informed consent from all subjects. All subjects gave written informed consent in accordance with the Declaration of Helsinki. The protocol was approved by the Ethic Committee of IRCCS – Istituto Auxologico Italiano (RBFR12DELS_004/05C302_2013).
This study was carried out in accordance with the recommendations of Institutional Guidelines and complied with the Italian Ministry of Health and associated guidelines from
European Communities Council Directive. The protocol was approved by Italian Ministry of Health no. 1610/2013.
AUTHOR CONTRIBUTIONS
MP, CD, CC, and MM conceived and designed the experiments. CD, MP, MM, VV, SM, EZ, and MMas performed the experiments. CD, MS, LP, MP, and CC analyzed the data. CD, CC, and AS contributed reagents, materials, and analysis tools. CD, MP, and MMac wrote the manuscript.
FUNDING
This work was supported by the Italian Ministry of University and Research under grants FIRBRBFR12DELS to CD and CC, and PRIN-2012JTX3KL to CC, and Ricerca Corrente Funds (05C302_2013) from the Italian Ministry of Health, Rome, Italy. EZ is granted by Marie Skłodowska-Curie grant agreement no. 713714 (Rep-Eat – H2020-MSCACOFUND-2015).
SUPPLEMENTARY MATERIAL
The Supplementary Material for this article can be found
online at: https://www.frontiersin.org/articles/10.3389/fgene.
2019.00523/full#supplementary-material
REFERENCES
Almeida, M. M., Dias-Rocha, C. P., Reis-Gomes, C. F., Wang, H., Atella, G. C., Cordeiro, A., et al. (2019). Maternal high-fat diet impairs leptin signaling and up-regulates type-1 cannabinoid receptor with sex-specific epigenetic changes
in the hypothalamus of newborn rats.Psychoneuroendocrinology 8, 306–315.
doi: 10.1016/j.psyneuen.2019.02.004
Apovian, C. M., Aronne, L., Rubino, D., Still, C., Wyatt, H., Burns, C., et al. (2013). A randomized, phase 3 trial of naltrexone SR/bupropion SR on weight and obesity-related risk factors (COR-II).Obesity 21, 935–943. doi: 10.1002/oby. 20309
Arosio, B., D’addario, C., Gussago, C., Casati, M., Tedone, E., Ferri, E., et al. (2014). Peripheral blood mononuclear cells as a laboratory to study dementia in the elderly.Biomed. Res. Int. 2014:169203. doi: 10.1155/2014/169203
Barnes, M. J., Holmes, G., Primeaux, S. D., York, D. A., and Bray, G. A. (2006). Increased expression of mu opioid receptors in animals susceptible to diet-induced obesity.Peptides 27, 3292–3298.
Bazhan, N., and Zelena, D. (2013). Food-intake regulation during stress by the hypothalamo-pituitary-adrenal axis.Brain Res. Bull. 95, 46–53. doi: 10.1016/j. brainresbull.2013.04.002
Bell, J. T., Pai, A. A., Pickrell, J. K., Gaffney, D. J., Pique-Regi, R., Degner, J. F., et al. (2011). DNA methylation patterns associate with genetic and gene expression variation in HapMap cell lines.Genome Biol. 12, R10. doi: 10.1186/gb-2011-12-1-r10
Berthoud, H. R. (2012). The neurobiology of food intake in an obesogenic
environment.Proc. Nutr. Soc. 71, 478–487. doi: 10.1017/S0029665112000602
Blevins, T. (2010). Therapeutic options that provide glycemic control and weight loss for patients with type 2 diabetes.Postgrad. Med. 122, 172–183. doi: 10.3810/ pgm.2010.01.2111
Bodnar, R. J. (2010). Endogenous opiates and behavior: 2009. Peptides 31,
2325–2359. doi: 10.1016/j.peptides.2010.09.016
Cardinal, P., Bellocchio, L., Clark, S., Cannich, A., Klugmann, M., Lutz, B., et al. (2012). Hypothalamic CB1 cannabinoid receptors regulate
energy balance in mice.Endocrinology 153, 4136–4143. doi:
10.1210/en.2012-1405
Chiurchiù, V., Van Der Stelt, M., Centonze, D., and Maccarrone, M. (2018). The endocannabinoid system and its therapeutic exploitation in multiple sclerosis: clues for other neuroinflammatory diseases.Prog. Neurobiol. 160, 82–100. doi: 10.1016/j.pneurobio.2017.10.007
Cifani, C., Micioni Di Bonaventura, M. V., Pucci, M., Giusepponi, M. E., Romano, A., Di Francesco, A., et al. (2015). Regulation of hypothalamic neuropeptides gene expression in diet induced obesity resistant rats: possible targets for obesity prediction?Front. Neurosci. 9:187. doi: 10.3389/fnins.2015.00187
Coccurello, R., and Maccarrone, M. (2018). Hedonic eating and the "delicious
circle": from lipid-derived mediators to brain dopamine and back. Front.
Neurosci. 12:271. doi: 10.3389/fnins.2018.00271
Colombo, G., Agabio, R., Diaz, G., Lobina, C., Reali, R., and Gessa, G. L. (1998). Appetite suppression and weight loss after the cannabinoid antagonist SR 141716.Life Sci. 63, L113–L117.
Corbett, A. D., Henderson, G., Mcknight, A. T., and Paterson, S. J. (2006). 75 years of opioid research: the exciting but vain quest for the holy grail.Br. J. Pharmacol. 147(Suppl. 1), S153–S162.
Cota, D., Marsicano, G., Lutz, B., Vicennati, V., Stalla, G. K., Pasquali, R., et al. (2003a). Endogenous cannabinoid system as a modulator of food intake.Int. J. Obes. Relat. Metab. Disord. 27, 289–301.
Cota, D., Marsicano, G., Tschop, M., Grubler, Y., Flachskamm, C., Schubert, M., et al. (2003b). The endogenous cannabinoid system affects energy balance via central orexigenic drive and peripheral lipogenesis.J. Clin. Invest. 112, 423–431. D’Addario, C., Micioni Di Bonaventura, M. V., Pucci, M., Romano, A., Gaetani, S., Ciccocioppo, R., et al. (2014). Endocannabinoid signaling and food addiction.Neurosci. Biobehav. Rev. 47, 203–224. doi: 10.1016/j.neubiorev.2014. 08.008
Debey, S., Schoenbeck, U., Hellmich, M., Gathof, B. S., Pillai, R., Zander, T., et al. (2004). Comparison of different isolation techniques prior gene expression profiling of blood derived cells: impact on physiological responses, on overall expression and the role of different cell types.Pharmacogenomics J. 4, 193–207. Di Marzo, V., and Despres, J. P. (2009). CB1 antagonists for obesity–what lessons
have we learned from rimonabant?Nat. Rev. Endocrinol. 5, 633–638. doi: 10.
1038/nrendo.2009.197
Di Marzo, V., Goparaju, S. K., Wang, L., Liu, J., Batkai, S., Jarai, Z., et al. (2001). Leptin-regulated endocannabinoids are involved in maintaining food intake. Nature 410, 822–825.
Dum, J., Gramsch, C., and Herz, A. (1983). Activation of hypothalamic
beta-endorphin pools by reward induced by highly palatable food. Pharmacol.
Biochem. Behav. 18, 443–447.
Foltin, R. W., Fischman, M. W., and Byrne, M. F. (1988). Effects of smoked marijuana on food intake and body weight of humans living in a residential laboratory.Appetite 11, 1–14.
Gadde, K. M., Allison, D. B., Ryan, D. H., Peterson, C. A., Troupin, B., Schwiers, M. L., et al. (2011). Effects of low-dose, controlled-release, phentermine plus topiramate combination on weight and associated comorbidities in overweight and obese adults (CONQUER): a randomised, placebo-controlled, phase 3 trial. Lancet 377, 1341–1352. doi: 10.1016/S0140-6736(11)60205-5
Gamelin, F. X., Aucouturier, J., Iannotti, F. A., Piscitelli, F., Mazzarella, E., Aveta, T., et al. (2016). Exercise training and high-fat diet elicit endocannabinoid system
modifications in the rat hypothalamus and hippocampus.J. Physiol. Biochem.
73, 335–347. doi: 10.1007/s13105-017-0557-1
Gladkevich, A., Kauffman, H. F., and Korf, J. (2004). Lymphocytes as
a neural probe: potential for studying psychiatric disorders. Prog.
Neuropsychopharmacol. Biol. Psychiatry 28, 559–576.
Glass, M. J., Billington, C. J., and Levine, A. S. (1999). Opioids and food intake: distributed functional neural pathways?Neuropeptides 33, 360–368.
Glass, M. J., Briggs, J. E., Billington, C. J., Kotz, C. M., and Levine, A. S. (2002). Opioid receptor blockade in rat nucleus tractus solitarius alters amygdala dynorphin gene expression.Am. J. Physiol. Regul. Integr. Comp. Physiol. 283, R161–R167.
Grissom, N. M., Lyde, R., Christ, L., Sasson, I. E., Carlin, J., Vitins, A. P., et al. (2014). Obesity at conception programs the opioid system in the offspring brain. Neuropsychopharmacology 39, 801–810. doi: 10.1038/npp.2013.193
Han, W., Hata, H., Imbe, H., Liu, Q. R., Takamatsu, Y., Koizumi, M., et al. (2006).
Increased body weight in mice lacking mu-opioid receptors.Neuroreport 17,
941–944.
He, F., Berg, A., Imamura Kawasawa, Y., Bixler, E. O., Fernandez-Mendoza, J., Whitsel, E. A., et al. (2019). Association between DNA methylation in obesity-related genes and body mass index percentile in adolescents.Sci. Rep. 9:2079. doi: 10.1038/s41598-019-38587-7
Hildebrandt, A. L., Kelly-Sullivan, D. M., and Black, S. C. (2003). Antiobesity effects of chronic cannabinoid CB1 receptor antagonist treatment in diet-induced obese mice.Eur. J. Pharmacol. 462, 125–132.
Hill, J. O., Wyatt, H. R., Reed, G. W., and Peters, J. C. (2003). Obesity and the
environment: where do we go from here?Science 299, 853–855.
Jamshidi, N., and Taylor, D. A. (2001). Anandamide administration into the ventromedial hypothalamus stimulates appetite in rats.Br. J. Pharmacol. 134, 1151–1154.
Jimerson, D. C., and Wolfe, B. E. (2004). Neuropeptides in eating disorders.CNS Spectr. 9, 516–522.
Johansson, K., Neovius, K., Desantis, S. M., Rossner, S., and Neovius, M. (2009). Discontinuation due to adverse events in randomized trials of orlistat,
sibutramine and rimonabant: a meta-analysis. Obes. Rev. 10, 564–575. doi:
10.1111/j.1467-789X.2009.00581.x
Karlsson, H. K., Tuominen, L., Tuulari, J. J., Hirvonen, J., Parkkola, R., Helin, S., et al. (2015). Obesity is associated with decreased mu-opioid but unaltered
dopamine D2 receptor availability in the brain.J. Neurosci. 35, 3959–3965.
doi: 10.1523/JNEUROSCI.4744-14.2015
Kempf, K., Hector, J., Strate, T., Schwarzloh, B., Rose, B., Herder, C., et al. (2007). Immune-mediated activation of the endocannabinoid system in visceral adipose tissue in obesity.Horm. Metab. Res. 39, 596–600.
Koch, M., Varela, L., Kim, J. G., Kim, J. D., Hernández-Nuño, F., Simonds, S. E., et al. (2015). Hypothalamic POMC neurons promote cannabinoid-induced feeding.Nature 519, 45–50. doi: 10.1038/nature14260
Lockie, S. H., Czyzyk, T. A., Chaudhary, N., Perez-Tilve, D., Woods, S. C., Oldfield, B. J., et al. (2011). CNS opioid signaling separates cannabinoid receptor 1-mediated effects on body weight and mood-related behavior in mice. Endocrinology 152, 3661–3667. doi: 10.1210/en.2011-1220
Lockie, S. H., Stefanidis, A., Tschop, M. H., and Oldfield, B. J. (2015). Combination cannabinoid and opioid receptor antagonists improves metabolic outcomes
in obese mice.Mol. Cell. Endocrinol. 417, 10–19. doi: 10.1016/j.mce.2015.
09.003
Mancino, S., Burokas, A., Gutierrez-Cuesta, J., Gutierrez-Martos, M., Martin-Garcia, E., Pucci, M., et al. (2015). Epigenetic and proteomic expression
changes promoted by eating addictive-like behavior.Neuropsychopharmacology
40, 2788–2800. doi: 10.1038/npp.2015.129
Manzanares, J., Corchero, J., Romero, J., Fernandez-Ruiz, J. J., Ramos, J. A., and Fuentes, J. A. (1999). Pharmacological and biochemical interactions between
opioids and cannabinoids.Trends Pharmacol. Sci. 20, 287–294.
Marks-Kaufman, R., Balmagiya, T., and Gross, E. (1984). Modifications in food intake and energy metabolism in rats as a function of chronic naltrexone
infusions.Pharmacol. Biochem. Behav. 20, 911–916.
Massa, F., Mancini, G., Schmidt, H., Steindel, F., Mackie, K., Angioni, C., et al. (2010). Alterations in the hippocampal endocannabinoid system in
diet-induced obese mice.J. Neurosci. 30, 6273–6281. doi: 10.1523/JNEUROSCI.
2648-09.2010
Nathan, P. J., and Bullmore, E. T. (2009). From taste hedonics to motivational
drive: central mu-opioid receptors and binge-eating behaviour. Int. J.
Neuropsychopharmacol. 12, 995–1008. doi: 10.1017/S146114570900039X Nogueiras, R., Romero-Picó, A., Vazquez, M. J., Novelle, M. G., López, M., and
Diéguez, C. (2012). The opioid system and food intake: homeostatic and
hedonic mechanisms.Obes. Facts 5, 196–207. doi: 10.1159/000338163
Pagano, C., Pilon, C., Calcagno, A., Urbanet, R., Rossato, M., Milan, G., et al. (2007). The endogenous cannabinoid system stimulates glucose uptake in human fat cells via phosphatidylinositol 3-kinase and calcium-dependent mechanisms.J. Clin. Endocrinol. Metab. 92, 4810–4819.
Patel, D. K., and Stanford, F. C. (2018). Safety and tolerability of new-generation anti-obesity medications: a narrative review.Postgrad. Med. 130, 173–182. doi: 10.1080/00325481.2018.1435129
Paxinos, G., and Watson, C. (1998).The Rat Brain in Stereotaxic Coordinates.
California, CA: AcademicPress.
Pucci, M., Micioni Di Bonaventura, M. V., Zaplatic, E., Bellia, F., Maccarrone, M., Cifani, C., et al. (2018). Transcriptional regulation of the endocannabinoid system in a rat model of binge-eating behavior reveals a selective modulation of the hypothalamic fatty acid amide hydrolase gene.Int. J. Eat Disord. doi: 10.1002/eat.22989 [Epub ahead of print].
Ramirez-Lopez, M. T., Arco, R., Decara, J., Vazquez, M., Noemi Blanco, R., Alen, F., et al. (2016). Exposure to a highly caloric palatable diet during the perinatal period affects the expression of the endogenous cannabinoid system in the brain. liver and adipose tissue of adult rat offspring.PLoS One 11:e0165432. Ramírez-López, M. T., Vázquez Berrios, M., Arco González, R., Blanco Velilla,
R. N., Decara Del Olmo, J., Suárez Pérez, J., et al. (2015). The role of maternal diet in metabolic and behavioural programming: review of biologic mechanisms involved.Nutr. Hosp. 32, 2433–2445. doi: 10.3305/nh.2015.32.6.9716 Ravinet Trillou, C., Arnone, M., Delgorge, C., Gonalons, N., Keane, P., Maffrand,
J. P., et al. (2003). Anti-obesity effect of SR141716, a CB1 receptor antagonist, in diet-induced obese mice.Am. J. Physiol. Regul. Integr. Comp. Physiol. 284, R345–R353.
Recant, L., Voyles, N. R., Luciano, M., and Pert, C. B. (1980). Naltrexone reduces weight gain, alters "beta-endorphin", and reduces insulin output from pancreatic islets of genetically obese mice.Peptides 1, 309–313.
Reid, L. D. (1985). Endogenous opioid peptides and regulation of drinking and feeding.Am. J. Clin. Nutr. 42, 1099–1132. doi: 10.1093/ajcn/42.5.1099 Reynés, B., García-Ruiz, E., Oliver, P., and Palou, A. (2015). Gene expression of
peripheral blood mononuclear cells is affected by cold exposure.Am. J. Physiol. Regul. Integr. Comp. Physiol. 309, R824–R834. doi: 10.1152/ajpregu.00221.2015 Rinaldi-Carmona, M., Barth, F., Heaulme, M., Alonso, R., Shire, D., Congy, C.,
et al. (1995). Biochemical and pharmacological characterisation of SR141716A, the first potent and selective brain cannabinoid receptor antagonist.Life Sci. 56, 1941–1947.
Romero-Picó, A., Sanchez-Rebordelo, E., Imbernon, M., González-Touceda, D., Folgueira, C., Senra, A., et al. (2018). Melanin-Concentrating Hormone acts
fgene-10-00523 June 14, 2019 Time: 16:53 # 14
Pucci et al. OPRM1 and CNR1 Genes in Obesity
through hypothalamic kappa opioid system and p70S6K to stimulate acute food
intake.Neuropharmacology 1, 62–70. doi: 10.1016/j.neuropharm.2017.11.040
Saper, C. B., Chou, T. C., and Elmquist, J. K. (2002). The need to feed: homeostatic
and hedonic control of eating.Neuron 36, 199–211.
Sarzani, R., Bordicchia, M., Marcucci, P., Bedetta, S., Santini, S., Giovagnoli, A., et al. (2009). Altered pattern of cannabinoid type 1 receptor expression
in adipose tissue of dysmetabolic and overweight patients.Metabolism 58,
361–367. doi: 10.1016/j.metabol.2008.10.009
Smith, S. L., Harrold, J. A., and Williams, G. (2002). Diet-induced obesity increases mu opioid receptor binding in specific regions of the rat brain.Brain Res. 953, 215–222.
South, T., and Huang, X. F. (2008). Temporal and site-specific brain alterations in CB1 receptor binding in high fat diet-induced obesity in C57Bl/6 mice. J. Neuroendocrinol. 20, 1288–1294. doi: 10.1111/j.1365-2826.2008.01785.x Statnick, M. A., Tinsley, F. C., Eastwood, B. J., Suter, T. M., Mitch, C. H., and
Heiman, M. L. (2003). Peptides that regulate food intake: antagonism of opioid receptors reduces body fat in obese rats by decreasing food intake and stimulating lipid utilization.Am. J. Physiol. Regul. Integr. Comp. Physiol. 284, R1399–R1408.
Stice, E. (2002). Risk and maintenance factors for eating pathology: a meta-analytic review.Psychol. Bull. 128, 825–848.
Striegel-Moore, R. H., and Bulik, C. M. (2007). Risk factors for eating disorders. Am. Psychol. 62, 181–198.
Tabarin, A., Diz-Chaves, Y., Carmona Mdel, C., Catargi, B., Zorrilla, E. P., Roberts, A. J., et al. (2005). Resistance to diet-induced obesity in mu-opioid receptor-deficient mice: evidence for a "thrifty gene".Diabetes 54, 3510–3516. Tanda, G., and Goldberg, S. R. (2003). Cannabinoids: reward, dependence, and
underlying neurochemical mechanisms–a review of recent preclinical data. Psychopharmacology 169, 115–134.
Timofeeva, E., Baraboi, E. D., Poulin, A. M., and Richard, D. (2009). Palatable high-energy diet decreases the expression of cannabinoid type 1 receptor messenger RNA in specific brain regions in the rat.J. Neuroendocrinol. 21, 982–992. doi: 10.1111/j.1365-2826.2009.01921.x
van Dijk, S. J., Tellam, R. L., Morrison, J. L., Muhlhausler, B. S., and Molloy, P. L. (2015). Recent developments on the role of epigenetics in obesity and metabolic disease.Clin. Epigenetics 7:66. doi: 10.1186/s13148-015-0101-5
Verty, A. N., Mcgregor, I. S., and Mallet, P. E. (2005). Paraventricular hypothalamic CB(1) cannabinoid receptors are involved in the feeding
stimulatory effects of Delta(9)-tetrahydrocannabinol.Neuropharmacology 49,
1101–1109.
Vickers, S. P., Webster, L. J., Wyatt, A., Dourish, C. T., and Kennett, G. A. (2003). Preferential effects of the cannabinoid CB1 receptor antagonist, SR 141716, on food intake and body weight gain of obese (fa/fa) compared to lean Zucker rats. Psychopharmacology 167, 103–111.
Volkow, N. D., and Wise, R. A. (2005). How can drug addiction help us understand obesity?Nat. Neurosci. 8, 555–560.
Vucetic, Z., Kimmel, J., and Reyes, T. M. (2011). Chronic high-fat diet drives postnatal epigenetic regulation of mu-opioid receptor in the brain. Neuropsychopharmacology 36, 1199–1206. doi: 10.1038/npp.2011.4
Vucetic, Z., Kimmel, J., Totoki, K., Hollenbeck, E., and Reyes, T. M. (2010). Mater-nal high-fat diet alters methylation and gene expression of dopamine and
opioid-related genes.Endocrinology 151, 4756–4764. doi:
10.1210/en.2010-0505
Whitney, A. R., Diehn, M., Popper, S. J., Alizadeh, A. A., Boldrick, J. C., Relman, D. A., et al. (2003). Individuality and variation in gene expression patterns in human blood.Proc. Natl. Acad. Sci. U.S.A. 100, 1896–1901.
WHO (2000).Obesity: Preventing And Managing the Global Epidemic: Report of a
WHO Consultation. Geneva: WHO Consultation on Obesity.
Williams, C. M., and Kirkham, T. C. (1999). Anandamide induces overeating:
mediation by central cannabinoid (CB1) receptors.Psychopharmacology 143,
315–317.
Williams, C. M., Rogers, P. J., and Kirkham, T. C. (1998). Hyperphagia in pre-fed rats following oral delta9-THC.Physiol. Behav. 65, 343–346.
Woelk, C. H., Singhania, A., Perez-Santiago, J., Glatt, S. J., and Tsuang, M. T. (2011). The utility of gene expression in blood cells for diagnosing neuropsychiatric disorders.Int. Rev. Neurobiol. 101, 41–63. doi: 10.1016/B978-0-12-387718-5.00003-1
Yeomans, M. R., and Gray, R. W. (2002). Opioid peptides and the control of human ingestive behaviour.Neurosci. Biobehav. Rev. 26, 713–728.
Zeltser, L. M., Seeley, R. J., and Tschöp, M. H. (2012). Synaptic plasticity in neuronal circuits regulating energy balance.Nat. Neurosci. 15, 1336–1342. doi: 10.1038/ nn.3219
Zhu, H., Wang, G., and Qian, J. (2016). Transcription factors as readers and effectors of DNA methylation.Nat. Rev. Genet. 17, 551–565. doi: 10.1038/nrg. 2016.83
Conflict of Interest Statement: The authors declare that the research was
conducted in the absence of any commercial or financial relationships that could be construed as a potential conflict of interest.
Copyright © 2019 Pucci, Micioni Di Bonaventura, Vezzoli, Zaplatic, Massimini, Mai, Sartorio, Scacchi, Persani, Maccarrone, Cifani and D’Addario. This is an open-access article distributed under the terms of the Creative Commons Attribution License (CC BY). The use, distribution or reproduction in other forums is permitted, provided the original author(s) and the copyright owner(s) are credited and that the original publication in this journal is cited, in accordance with accepted academic practice. No use, distribution or reproduction is permitted which does not comply with these terms.