‘Better late than never’: the interplay between green
technology and age for firm growth
Riccardo Leoncini&Alberto Marzucchi& Sandro Montresor&Francesco Rentocchini& Ugo Rizzo
Accepted: 30 June 2017
# The Author(s) 2017. This article is an open access publication Abstract This paper investigates the relationship between green/non-green technologies and firm growth. By combining the literature on eco-innova-tions, industrial organisation and entrepreneurial studies, we examine the dependence of this relation-ship on the pace at which firms grow and the age of the firm. From a dataset of 5498 manufacturing firms in Italy for the period of 2000–2008, longitudinal fixed effects quantile models are estimated, in which the firm’s age is set to moderate the effects of green and non-green patents on employment growth. We find that the positive effect of green technologies on
growth is greater than that of non-green technologies. However, this result does not apply to struggling and rapidly growing firms. With fast-growing (above the median) firms, age moderates the growth effect of green technologies. Inconsistent with the extant liter-ature, this moderation effect is positive: firm experi-ence appears important for the growth benefits of green technologies, possibly relative to the complex-ity of their management.
Keywords Green technology . Firm growth . Age . Quantile fixed effects
DOI 10.1007/s11187-017-9939-6
Electronic supplementary material The online version of this article (https://doi.org/10.1007/s11187-017-9939-6) contains supplementary material, which is available to authorized users. R. Leoncini
University of Bologna, Bologna, Italy e-mail: [email protected]
R. Leoncini
Freiburg Institute for Advanced Studies (FRIAS), University of Freiburg, Freiburg im Breisgau, Germany
R. Leoncini
IRCrES-CNR, Milan, Italy
A. Marzucchi (*)
SPRU, Science Policy Research Unit, University of Sussex, Brighton, UK
e-mail: [email protected]
S. Montresor
Faculty of Economics and Law, Kore University of Enna, Cittadella Universitaria, 94100 Enna, EN, Italy
e-mail: [email protected] F. Rentocchini
Department of Economics, Management and Quantitative Methods, University of Milan, Milan, Italy
e-mail: [email protected] F. Rentocchini
Southampton Business School, University of Southampton, Southampton, UK
U. Rizzo
Department of Economics and Management, University of Ferrara, Ferrara, Italy
JEL Classification L26 . O33 . Q55
1 Introduction
Following the‘Porter hypothesis’ and the debate over ‘whether it pays to be green’, studies have shown that by complying with environmental regulations, adopting sustainable practices and eco-innovating, firms can be-come more competitive (Porter and Van der Linde1995; Ambec and Lanoie2008; Ambec et al.2013) if not even more profitable (Horváthová 2010; Ghisetti and Rennings2014). However, the impact of green technol-ogies on firm growth has been minimally investigated, especially given the abundant literature on ‘standard’ innovation as a growth driver (Sutton 1998; Bottazzi and Secchi 2006; Lotti et al. 2009; Coad and Holz
2012).1Supportive evidence has been mainly obtained by examining the relationship between eco-innovations and firm growth through the lens of the technology–jobs nexus, usually in a non-longitudinal setting (e.g. Gagliardi et al.2016; Rennings and Zwick2002). How-ever, with few exceptions, these analyses do not address the ‘growth premium’ attached to green technologies vis-à-vis the non-green ones, nor do they pay attention to the inner complexity and dynamics of the phenomenon.
The present paper aims to close this gap by address-ing two research questions. We first draw on the idea from the field of industrial organisation that the growth effect of technology exploitation varies with the pace at which a firm grows, given that growth opportunities and threats change at different growth rates (Coad and Rao
2006). Hence, we investigate whether the growth out-come of eco-innovations depends on the firm’s pace of growth and on whether the firm is struggling or rapidly growing. To address this research question, we rely on a novel methodological approach: a quantile regression analysis (e.g. Coad and Rao2008; Coad and Rao2010; Coad et al. 2013) performed by using a fixed effects estimation technique (Canay2011). This technique cap-tures the potentially heterogeneous effects of green (and non-green) technologies on firm growth across different growth rates, while controlling for unobserved heterogeneity.
The second research question examines whether the firm’s age influences the growth impact of green tech-nologies. Again, we are informed by the industrial or-ganisation literature (e.g. Barba Navaretti et al. 2014; Distante et al.2014): we consider age-dependent mech-anisms that characterise the firm’s capacity to exploit innovation (Coad et al.2016) and add to them specific ones related to eco-innovations. By studying the knowl-edge complexity implications of eco-innovations (e.g. in terms of risk and financing) and the higher need for technology experience to grasp it (Carrillo-Hermosilla et al.2010), we investigate whether age moderates how the firm’s growth benefits from green technologies.
These two original research questions are addressed by relying on a novel longitudinal dataset comprising 5498 Italian manufacturing firms studied over the period of 2000–2008. In our econometric analysis, the impact of green and non-green patents on the firm’s growth, as measured by employment growth, is moderated by age. Our main findings are as follows. First, green technolo-gies have a greater impact on firm growth than non-green ones, except in the case of struggling and rapidly growing firms. Second, the firm’s age positively mod-erates the growth effect of green technologies for fast-growing (above the median) firms. We discuss the man-agement and policy implications for both scenarios.
The remainder of the paper is structured as follows. Section 2 reviews relevant background literature. Section3presents the empirical application. Section4
illustrates the results. Section5presents the conclusion.
2 Background literature and research questions
Surprisingly, despite the importance given to green and sustainable growth in the current policy debate, the role of eco-innovations in driving firm growth has scarcely been investigated. Although firm growth can be mea-sured through different variables at the micro-level, like job creation, assets and sales growth (Coad2009), our contribution to the nascent literature on the growth effects of green technologies focuses on employment. While we empirically justify our choice in Section3.3, it is also motivated by our attempt to complement a recent stream of literature about the effects of eco-innovations on the dynamics of firm employment. These studies investigate the possible positive (e.g. driven by product demand or higher staff requirements for operating envi-ronmental technologies) and negative (e.g. displacement
1This issue is related to, but different from the relatively more studied
topic of the (mainly policy) drivers of‘green growth’, for which see, among the others, Hallegatte et al. (2012).
and substitution) employment effects of different types of eco-innovations (Rennings and Zwick 2002; Rennings et al.2004; Licht and Peters2013; Horbach and Rennings2013). However, they generally rely on cross-sectional, self-reported survey data, often using binary variables for capturing employment growth (Rennings and Zwick 2002; Rennings et al. 2004; Horbach and Rennings2013) and/or focusing only on eco-innovators (Rennings and Zwick 2002; Rennings et al. 2004), thus preventing the distinction between occasional and persistent effects.
More relevant to our analysis is the patent-based study carried out in Italy (2001–2008) by Gagliardi et al. (2016), showing that eco-innovator firms have more employment growth than their non-green counter-parts. Similarly, Colombelli et al. (2015) studied patents of more than 400,000 firms in Germany, France, Italy, Spain and Sweden over the period of 2002–2011 and found that eco-innovation capabilities drive sales growth more than‘generic’ ones.
On the strength of these previous contributions, we argue that, despite their higher costs (Gagliardi et al.
2016), new green technologies could provide firms with ‘extra returns’ compared to non-green technologies. These extra returns can be exploited (e.g. re-invested) and, as we posit, yield an employment growth premium to eco-innovators. This argument finds support in three different research streams. At the outset, by extending the debate on Schumpeterian innovation regimes to the green realm (Malerba2005; Oltra and Saint Jean2009), we argue that eco-innovators could make a more effec-tive ‘creative accumulation’ of knowledge (i.e. Schumpeter Mark II) than standard ones and translate economic returns into higher growth opportunities. Giv-en the irreversibility of complying with Giv-environmGiv-ental regulations, investing in green-specific assets and ac-quiring internal/external green knowledge (Oltra and Saint Jean2009; Mazzanti and Rizzo2017) and envi-ronmental technologies have actually been found to lead to more persistent (eco-) innovation practices and out-comes than standard technologies, with greater oppor-tunities of increasing returns (see Sàez-Martínez et al.
2016; Chassagnon and Haned2015).
A growth premium from green vs. non-green tech-nologies is also supported by the literature on the joint improvements of environmental and economic/financial performances of firms (i.e. their ‘win-win’ strategies). The green-specific mechanisms that increase firm reve-nues (e.g. green differentiation of products, access to
green demand segments and sale of environmental con-trol technologies) and reduce costs (e.g. material and energy efficiency, and recycling initiatives) (see Ambec and Lanoie 2008) provide eco-innovators with im-proved financial indicators (e.g. Misani and Pogutz
2015), greater profits (Ghisetti and Rennings 2014) and, in general, extra economic returns to be turned into higher growth.
Finally, the regulations and policy actions on which eco-innovations depend (the so-called regulatory push/ pull effect) also represent an‘extra’ driver of growth. ‘Polluting’ firms at the end of the value chain are legally forced to improve their environmental performances and, in so doing, ‘induce’ an additional element of ‘derived demand’ in the upstream producers of green technologies that fuels the latter’s growth (Colombelli et al.2015; Ghisetti and Quatraro2013).
In summary, the extant literature seems to imply a growth effect of green technologies vs. non-green ones, which can depend on two scarcely analysed aspects: (i) the pace at which firms grow and (ii) the firm age.
The pace aspect has been confirmed through the use of quantile regressions for standard innovations. Coad et al. (2016), for example, showed that only the fastest-growing firms benefit from standard in-novation in terms of employment growth, while this return is actually negative for the slowest-growing ones. In general, fast-growing firms have been shown to have crucial advantages in the ‘job crea-tion argument’ (for a review see Almus2002). First, they are generally smaller, and thus more prone to commercialising their innovations, and younger, and accordingly more in need of investing in the knowl-edge they miss at the beginning of their businesses. Second, they often operate in technology-intensive sectors and are thus endowed with a larger knowl-edge base, qualified human capital and technological skills and experience. They also usually have a limited liability legal form, thus showing greater incentives for riskier but also more rewarding inno-vations. Finally, their close connection to suppliers, customers and competitors enables them to benefit from an open innovation approach.
As these aspects do not vary by the nature of the relevant technologies and given the absence of spe-cific literature on green technologies, we maintain that the distinction between rapidly and slowly growing firms could be a relevant factor for eco-innovations too. Although in a non-quantile
framework, but rather in a dynamic parametric es-timation of Gibrat’s law (Gibrat1931,2003), this is confirmed by Colombelli et al. (2015). They find that the growth differential between green and ge-neric technologies is actually greater for firms growing at more than ‘the average’ rate. We inter-pret this in light of the ‘induced’ innovation, which is the ‘derived demand’ from environmental regu-lations that fuels green sectors.
With regard to the second aspect of our analysis, in the industrial organisational literature, age has a twofold effect on growth. On the one hand, it is (along with size) an important determinant of a firm’s growth potential, with a large (although not yet conclusive) body of evidence favouring younger firms (Haltiwanger et al.
2013; Lawless 2014). On the other hand, age (along with other characteristics) is a crucial moderating factor of the impact of innovative activity on firms’ growth (Audretsch et al.2014) and on employment growth, in particular (Coad et al.2016).
However, the role of age in the relationship between green technologies and growth has received little em-phasis. A sort of‘sin of youth’ seems to emerge from the literature on‘(eco-)sustainable entrepreneurship’ (Dean and McMullen2007), in which the comparative analy-ses of start-ups (young firms) vs. incumbent (old) firms have been very rare, so far, and specific to some sectors (e.g. green electricity and microfinance) (Hockerts and Wustenhagen, Hockerts and Wüstenhagen2010). While ‘emerging green Davids’ usually show higher envi-ronmental commitment and attractiveness to sustain-able consumers, they often fail to translate their niche market potential into a broad mass market, mainly because of the competition from incumbent‘greening Goliaths’, through their ‘inner’ form of corporate sus-tainable entrepreneurship (e.g. Bird et al. 2002; Stenzel and Frenzel2008).
Other and more general age-related insights emerge from environmental and eco-innovation studies, all suggesting a greater growth potential of mature eco-innovators. First, an older firm can be ex-pected to have an advantage in terms of learning expe-rience against the multidimensionality and complexity that characterises green knowledge (Carrillo-Hermosilla et al.2010) and new green product development pro-jects (Tsai2012). Second, younger firms may be more averse to the growth exploitation of green technologies, as these are often in the early stage of their life cycles and thus marked by greater uncertainty than non-green
ones (Consoli et al.2016). Similarly, young firms could be disfavoured in benefiting from policy instruments for the adoption of green-tech—such as new practices of green public procurement (Parikka-Alhola 2008)—as
these are still marked by uncertainty and require expe-rience in managing demand-pull policy. Third, given the hard collaterisation and information signalling of green investment projects, older firms could be expected to have better access to financing (Schneider and Veugelers 2010) and be better prepared to cope with the higher cost of eco-innovations without crowding out other growth-driving investments (Hall et al. 2016). Last, but not the least, older firms may have an advan-tage in strengthening their available resources to in-crease their economic green returns (e.g. through econ-omies of scale) as well as in forming alliances to tap into external resources (e.g. through reputation and market position) (e.g. Cainelli et al.2015). Similarly, firm ma-turity could be beneficial for searching, absorbing and transforming external knowledge (Franco et al.2014) towards adopting the open eco-innovation mode (Ghisetti et al. 2015), particularly when accessing new and foreign markets (e.g. Autio et al. 2000; D’Agostino2015).2
In light of the above aspects, our study attempts to address the firm growth potential of green vs. non-green technologies, by providing new empirical evidence for two original research questions: (1) To what extent does the association between green tech-nologies and firm growth vary along the conditional distribution of growth rates? (2) What is the role that a firm’s age plays in the relationship between green technologies and growth?
3 Empirical application
3.1 Data
The empirical analysis is based on a dataset that has been obtained by combining three different sources (see
2The arguments about the growth potential of mature (young)
com-panies that we have just presented refer to green technologies in general terms (i.e. without distinguishing specific environmental targets or technological realms). In the absence of theoretical backing and/or prior empirical findings on the existence of differences for different green technological realms, we distinguish between green and non-green technologies only, without focusing on specific non-green technologies.
Online AppendixA1for details): (i) the ASIA database of the Italian National Statistical Office (ISTAT); (ii) the Bureau van Dijk AIDA database; (iii) and the World-wide Patent Statistical Database (PATSTAT).
By restricting our sample to manufacturing compa-nies (Section D of NACE Rev. 1.1) that filed at least one patent application in the period of 1977–2008 and be-cause of the availability of the other relevant data sources (see Online Appendix A1), we ended up with an unbalanced panel comprising 5498 firms observed over the period of 2000–2008. The focus on patenting firms allows us to minimise unobserved heterogeneity in terms of innovative capabilities across firms. Given that the objective here is to investigate the growth premium, if any, offered by green vs. non-green innovations and the moderating effect of age in the relationship between innovative activity and growth, our implications will be valid for innovative firms only.3
3.2 Methodology
To address our research questions (see Section2), we investigate the following relationship:
Growthit ¼ α þ β1Pat Greeni;t−1
þ β2Pat Nongreeni;t−1þ β3Agei;t−1 þ β4ðPat Green X AgeÞi;t−1 þ β5ðPat Nongreen X AgeÞi;t−1
þ z0i;t−1γ þ δtþ μiþ εit ð1Þ whereδtindicates a series of time dummies; z′i,t− 1is a
vector of firm-specific control variables;μidenotes the
unobserved firm-specific effects; and εit is the error
term.
Building upon previous empirical works on the rela-tionship between growth and innovation, and given our focal interest in the role of the pace at which firms grow, we employ a quantile regression approach (Coad and Rao 2008; Kesidou and Demirel 2012). As is well
known, this approach allows for a richer characterisation of the data: it disentangles the relationships between our independent variables and firm growth at different quantiles of the distribution of the growth rates, rather than at the conditional mean only. Further, as is normal-ly the case when investigating firm growth (Buchinsky
1998; Bottazzi and Secchi2003), quantile analysis is preferable over standard least squares for different rea-sons linked to the distribution of the growth rates in our sample (see Online AppendixA2).
Most of the applied literature adopting a quantile regression approach stems from cross-sectional settings, and for this reason, controlling for problems of endogeneity arising from unobserved heterogeneity has been difficult. Conversely, we follow recent develop-ments in a stream of the applied econometrics literature that has attempted to overcome this major limitation (Koenker2004; Galvao2011; Canay2011). Specifically, we implement the procedure suggested by Canay (2011), who developed a method to estimate fixed effects quantile regressions for panel data. The solution proposed consists of a two-step estimator. In the first step, we estimate our previous equation (1) as a standard linear panel regression model via the within estimator (Wooldridge 2010). From this model, we obtain the predicted value depurated from the unobserved heteroge-neity component:
^yit ¼ Growthit−^μi
where^μi¼ E Growthit− dGrowthit
h i
is an estimate of the unobserved heterogeneity term. In the second step, a standard quantile regression model is implemented in which the transformed dependent variable above (^yit) is regressed on our relevant independent variables (Koenker and Hallock2001).
3.3 Variables
Our dependent variable is the growth rate of employees (Growthit), calculated as the difference between the
logarithm of firm i’s employees in year t and the loga-rithm of employees in year t− 1 (Coad and Rao2006; Coad 2010) (see Online Appendix A3for details). In addition to theoretical reasons (see Section 2), this choice has also empirical motivations. Unlike other measures (Delmar et al. 2003) such as sales growth, employment growth can capture growth performance in recently constituted firms (Clarysse et al.2011).
3
Table A1 in the Online Appendix reports the difference in 1-year employment growth, employment and age between our sample and the overall population of Italian companies (source: ASIA-ISTAT). We test whether the means for the variables above are statistically different between the two groups. In line with the approach of Gagliardi et al. (2016), who employed similar data, firms in our sample are older and bigger, while there is no significant difference in terms of employment growth.
We have three main independent variables: (i) Pat Greeni,t− 1, which is the logarithm of the stock (at time
t− 1) of environmentally friendly technologies (plus 1), filed by firm i; (ii) Pat Nongreeni,t− 1is the logarithm of
the stock of non-environmentally friendly technologies (plus 1); (iii) Agei,t− 1which measures the (log
trans-formed) age of company i at time t − 1, with the difference between the current and its constitution date. Despite its limitations as an innovation proxy, patent data has been used by most of the recent research on eco-innovations because they are, on the one hand, more widely available and more informative than R&D about their environmental nature and, on the other hand, a more robust indicator than questionnaire-based measures (Arundel and Kemp2009; Berrone et al.2013). For the identification of ‘green patents’ in particular, we have relied on Marin and Lotti (2016) (see Online Appendix
A3). Both green and non-green technological variables are defined as stocks, rather than flows (see Online Appendix
A3for details). We do so because we expect a firm’s rate of
growth to be affected by the knowledge cumulated over time and not only by its variation added in the recent and/or current period (Bloom and Van Reenen2002; Hall et al.
2005). This also helps reduce, at least partially, the possible confounding effect of the persistency in technological leadership (Denicolò,2001) on firm growth, which cannot be addressed by controlling for unobserved heterogeneity (Peters2009).4
We control for a set of variables that are often includ-ed in growth rate regression models: (i) investments in tangible (Inv Tangi,t− 1) and intangible (Inv Intangi,t− 1)
assets (at time t− 1), recognised by the literature to have an important role in‘accounting’ for the firm’s capacity to grow (Hall1987); (ii) a measurement of size in terms of number of employees of firm i at time t− 1 (Emp,t− 1),
used to retain the implications of the Gibrat’s law (e.g. Evans1987; Hall1987; Calvo2006); (iii) an Herfindahl-Hirschman index of industry concentration (Herfindahl indexjt), which has been often found to play a relevant
role with respect to firms’ performance (Kaniovski and Peneder2008) (see Online AppendixA3for details).
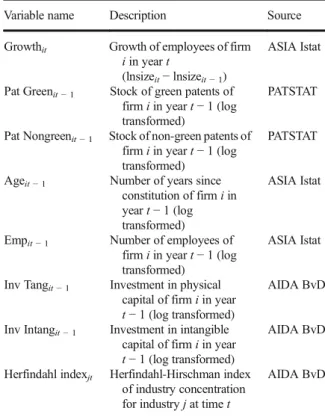
Finally, we include a set of eight dummy variables to control for year effects. Table 1 shows the variables included in the analysis and their sources.
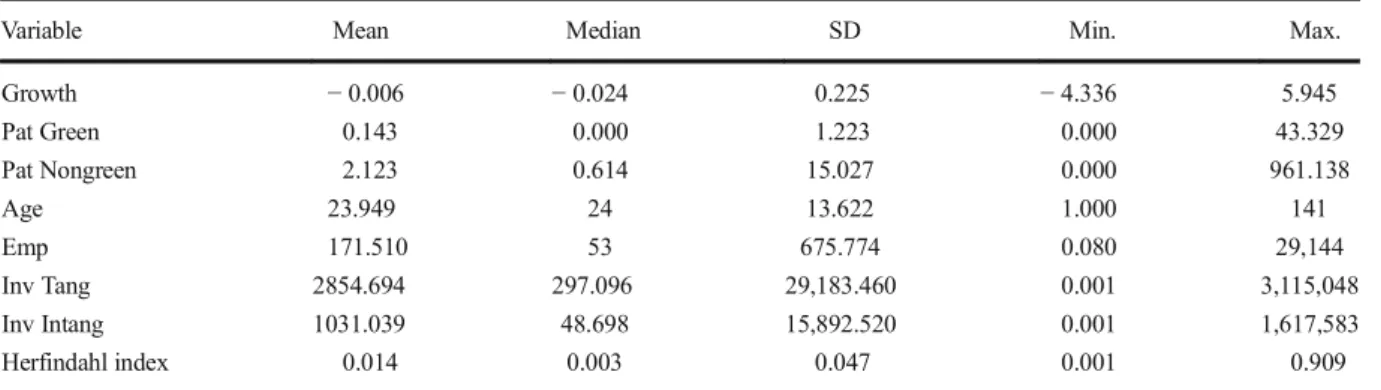
Descriptive statistics of the variables employed in the empirical exercise are reported in Table2. Table3reports the bivariate correlations of the variables considered in the analysis. No indication of significant multi-collinearity among the independent variables was found (i.e. the var-iance inflation factor ranges from 1.02 to 2.62, well below the threshold level of 5).
4 Results
The results of the quantile fixed effect estimations are presented in Table 4, which shows the baseline model, and in Table5, which incorporates the role of the firm’s age as a moderating factor in the relationship between envi-ronmental (and non-envienvi-ronmental) patents and firm’s growth.5
4The empirical literature does not point to unambiguous evidence on
the relevance of persistence in technological innovation, especially when it comes to major innovation or patents (Raymond et al.2010). In these cases, partial support for the presence of persistence emerges when considering top innovators (Geroski et al.1997; Cefis2003).
Table 1 Variables’ description
Variable name Description Source
Growthit Growth of employees of firm i in year t
(lnsizeit− lnsizeit− 1)
ASIA Istat
Pat Greenit− 1 Stock of green patents of firm i in year t− 1 (log transformed)
PATSTAT
Pat Nongreenit− 1 Stock of non-green patents of firm i in year t− 1 (log transformed)
PATSTAT
Ageit− 1 Number of years since constitution of firm i in year t− 1 (log transformed)
ASIA Istat
Empit− 1 Number of employees of firm i in year t− 1 (log transformed)
ASIA Istat
Inv Tangit− 1 Investment in physical capital of firm i in year t− 1 (log transformed)
AIDA BvD
Inv Intangit− 1 Investment in intangible capital of firm i in year t− 1 (log transformed)
AIDA BvD
Herfindahl indexjt Herfindahl-Hirschman index of industry concentration for industry j at time t
AIDA BvD
5Both tables report results of the Parente and Santos Silva (2016)
test to determine whether intra-industry correlation affects the standard errors in our estimates. Results show that, apart from the 50th percentile, all other percentiles (10th, 25th, 75th and 90th) are affected by intra-cluster correlation. Results reported in the tables therefore use cluster-robust standard errors at industry level (NACE rev. 1.1 2 digit codes).
Starting with the controls, as expected (e.g. Coad and Holz 2012), both tangible and intangible investments significantly drive firm growth. As for size, smaller companies show greater growth opportunities and ca-pacities, in agreement with the entrepreneurship litera-ture (Acs and Audretsch2006). An increase in market concentration (Herfindahl index) seems to favour firm growth, although the effect is significant—and posi-tive—only at the 50th and 90th percentiles. This result resonates well with the characterisation of the ‘Schumpeter Mark II’ pattern of innovation (Malerba and Orsenigo1995)—marked by an oligopolistic
con-text with high technological opportunities and appropriability—which the former literature actually identified in a section of the Italian national system of innovation (Malerba1993), and that here appears to be represented by fast-growing companies.
As far as firm’s age is concerned, the results of the standard literature on the growth advantages of newly created companies (Coad et al. 2013; Barba Navaretti et al. 2014) appeared reversed across all quantiles in Table4: unexpectedly, older companies grow more than younger ones. This result can be only be partially
explained by the specificity of our quantile methodolo-gy. Most likely, its explanation lies in the characteristics of our sample. Our sample consists of innovation-oriented manufacturing firms operating in a national context, where new-born firms face structural difficul-ties in taking off and surviving (Audretsch et al.1999), and where established incumbents usually obtain the most radical innovation outcomes (Malerba1993). The importance of banks in financing innovation (Benfratello et al. 2008) also plays a key role in the Italian context, and mature firms are more capable (e.g. by reputation) of developing borrowing relationships for their innovations (Gregory et al. 2005; Hartarska and Gonzalez-Vega2006; Carpenter and Rondi2000; Magri
2009). In the same context, firm internationalisation and innovation often entails a strong increase of competitive pressure and failure risk (Giovannetti et al.2013), and maturity and foreign market experience increase the chance of post-internationalisation survival (Autio et al. 2000; Carr et al. 2010). Finally, the regime of ‘creative accumulation’ (Schumpeter Mark II) that characterises the most competitive Italian industries (e.g. motor vehicles and non-electrical machinery) Table 2 Descriptive statistics for the pooled sample (n = 30,670)
Variable Mean Median SD Min. Max.
Growth − 0.006 − 0.024 0.225 − 4.336 5.945 Pat Green 0.143 0.000 1.223 0.000 43.329 Pat Nongreen 2.123 0.614 15.027 0.000 961.138 Age 23.949 24 13.622 1.000 141 Emp 171.510 53 675.774 0.080 29,144 Inv Tang 2854.694 297.096 29,183.460 0.001 3,115,048 Inv Intang 1031.039 48.698 15,892.520 0.001 1,617,583 Herfindahl index 0.014 0.003 0.047 0.001 0.909
All values are reported before log transformation
Table 3 Correlation matrix (n = 30,670)
Growth Pat Green Pat Nongreen Age Emp Inv Tang Inv Intang
Pat Green 0.001 Pat Nongreen − 0.0249 0.2571 Age − 0.1264 0.0095 0.1033 Emp − 0.1741 0.1811 0.3652 0.302 Inv Tang − 0.0103 0.1586 0.2815 0.2115 0.7361 Inv Intang 0.0078 0.144 0.3109 0.0644 0.5068 0.4613 Herfindahl index 0.0006 0.0542 0.0125 − 0.0197 0.0618 0.0579 0.0316
(Malerba and Orsenigo 1995) could lend knowl-edge accumulation and innovation persistence ex-perienced by mature firms a larger impact, also on the growth performance of sectoral systems of en-vironmental innovation (Chassagnon and Haned
2015; Oltra and Saint Jean 2009).
We now come to the core of our analysis. As Table4
shows, the positive and significant coefficients of both Pat Nongreen and Pat Green across the whole set of percentiles confirm the role of green technology as a driver of firm growth. This finding supports and extends the emerging evidence on the business environmental win-win situations enhanced by environmental prac-tices. Indeed, as we expected, the increase of product value and the reduction of production costs they entail (Ambec and Lanoie2008) actually seem to translate into higher growth.
A more relevant aspect to consider is the comparison between the coefficients of Pat Green and Pat Nongreen across the quantiles of the distribution. This comparison is crucial for assessing whether green technologies pro-vide a growth premium with respect to non-green
technologies or whether, instead, the effects of green and non-green patents are not different. By running appropriate statistical tests on the difference between the two coefficients (tests are reported in Table 4), we found that the difference between Pat Green and Pat Nongreen is not homogeneous across the quantiles. Specifically, it emerges that for the 25th, 50th and 75th percentiles, green technologies have a significantly larg-er effect (at a 99% level of confidence) on growth than standard technologies, while for the 10th and the 90th percentiles, green and non-green patents have statisti-cally similar effects on firm growth. In brief, the growth premium of green over non-green technologies is not unlimited and weakens when innovation efforts are pursued either to survive (struggling firms) or to remain among the growth‘superstars’ (gazelles).
The picture becomes more nuanced when we intro-duce interaction terms to capture the moderating role of age (Table5). While Pat Nongreen remains positive and significant, except for the 10th and 25th percentiles, Pat Green, per se, is not positive and becomes negative and significant for the 75th and 90th percentiles. However, Table 4 Quantile regression with fixed effects: firm growth’s determinants
q10 q25 q50 q75 q90 Aget− 1 0.098*** (0.002) 0.089*** (0.001) 0.081*** (0.001) 0.074*** (0.001) 0.061*** (0.002) Pat Greent− 1 0.021** (0.009) 0.022*** (0.002) 0.021*** (0.001) 0.025*** (0.003) 0.023*** (0.006) Pat Nongreent− 1 0.007*** (0.002) 0.013*** (0.001) 0.014*** (0.000) 0.015*** (0.001) 0.020*** (0.002) Empt− 1 − 0.424*** (0.002) − 0.437*** (0.001) − 0.447*** (0.000) − 0.458*** (0.001) − 0.473*** (0.001) Inv Intangt− 1 − 0.001 (0.001) 0.002*** (0.000) 0.004*** (0.000) 0.006*** (0.000) 0.008*** (0.001) Inv Tangt− 1 0.016*** (0.001) 0.015*** (0.001) 0.016*** (0.000) 0.017*** (0.000) 0.021*** (0.001) Herfindahl indext − 0.152 (0.174) − 0.044 (0.073) 0.016*** (0.006) 0.072 (0.044) 0.178*** (0.060) Constant 1.049*** (0.007) 1.184*** (0.008) 1.287*** (0.004) 1.374*** (0.005) 1.470*** (0.010) Pat Green-Pat Nongreen
difference test 0.014 (0.01) 0.009*** (0.002) 0.007*** (0.001) 0.009*** (0.003) 0.004 (0.006)
Test for intra-industry correlation 14.860*** 5.528*** − 0.147 10.893*** 14.722***
Firm-year obs 30,670
Firm obs 5498
Year dummy variables have been included in all of the models. Bootstrapped standard errors are reported in parentheses. They are based on 1000 replications of the data
the effect of Pat Green, as shown in Table5, should be understood in relation to the age of the company, given the contribution of the interaction between Pat Green and Age, which is always positive and significant, ex-cept for the 10th and 25th percentiles.
In other words, we find an apparently exclusive capacity of older firms to translate eco-innovation into growth. This is the second important result of our anal-ysis, which is possibly linked to the points of firm maturity and eco-innovations discussed in Section 2. First, as we said, older firms may be better equipped to evaluate the uncertainty/risk and the actual marketability of their eco-innovations, irrespective of their likely dis-advantages in terms of organisational inertia and learn-ing impediments (Majumdar1997; Sorensen and Stuart
2000; Criscuolo et al. 2012). Second, owing to better access to finance (Schneider and Veugelers2010), older firms can have a higher capacity to cope with the cost of eco-innovating (Gagliardi et al. 2016) and with the resources needed to engage in signalling, labelling and
certification efforts, which are often required to extract value from investment in green innovations (Ambec and Lanoie 2008). Third, older firms might have greater pressures and incentives for renewing their older capital vintages in an eco-sustainable manner—for example in responding to a policy constraint (Ruth et al.2004)—
also in light of their greater capacity to exploit internal economies of scale and external knowledge sourcing (Herriott et al. 1985; Levitt and March1988; Ghisetti et al.2015). Finally, the persistence of the learning and innovation patterns that characterises green technologies (Sàez-Martínez et al. 2016, Chassagnon and Haned
2015) can‘reserve’ the growth impact to firms that are capable of reaping the benefits of their path dependence. While favouring older firms, the implications of our results for entrepreneurial growth are quite discouraging. When attempting to pursue the heavily uncertain path of growth (e.g. Coad et al.
2013), young companies are able to obtain short-term gains only from standard innovations, which Table 5 Quantile regression with fixed effects: firm growth’s determinants—interaction effects
q10 q25 q50 q75 q90 Aget− 1 0.082*** (0.018) 0.097*** (0.003) 0.088*** (0.001) 0.081*** (0.001) 0.072*** (0.001) Pat Greent− 1 − 0.012 (0.057) 0.020 (0.019) − 0.002 (0.009) − 0.012*** (0.003) − 0.020** (0.010) Pat Nongreent− 1 0.026 (0.041) 0.010 (0.015) 0.023*** (0.004) 0.023*** (0.003) 0.020*** (0.004) Pat Greent− 1X Aget− 1 0.011
(0.017) 0.000 (0.005) 0.008*** (0.003) 0.011*** (0.001) 0.014*** (0.003) Pat Nongreent− 1X Aget− 1 − 0.004
(0.012) − 0.001 (0.005) − 0.003** (0.001) − 0.003*** (0.001) − 0.002 (0.001) Empt− 1 − 0.455*** (0.020) − 0.424*** (0.002) − 0.437*** (0.001) − 0.447*** (0.000) − 0.458*** (0.001) Inv Intangt− 1 0.005*** (0.001) − 0.001 (0.001) 0.002*** (0.000) 0.004*** (0.000) 0.006*** (0.000) Inv Tangt− 1 0.020*** (0.002) 0.016*** (0.001) 0.015*** (0.001) 0.016*** (0.000) 0.017*** (0.000) Herfindahl indext 0.046*** (0.011) − 0.151 (0.158) − 0.043 (0.075) 0.019*** (0.005) 0.072* (0.042) Constant 1.233*** (0.062) 1.074*** (0.012) 1.198*** (0.008) 1.295*** (0.007) 1.382*** (0.006)
Test for intra-industry correlation 15.142*** 5.468*** − 0.102 10.685*** 14.730***
Firm-year obs 30,670
Firm obs 5498
Year dummy variables have been included in all of the models. Bootstrapped standard errors are reported in parentheses. They are based on 1000 replications of the data
do not target external benefits associated to envi-ronmental protection and are arguably less distant from the traditional industrial knowledge base (Ghisetti et al. 2015). Interestingly, these gains occur for the central quantiles of the distribution, as can be noticed from the negative and significant coefficients on the interaction term Pat Nongreen X Age in the 50th and 75th percentiles. For rap-idly or slowly growing companies, age does not moderate the growth-driving effects of non-green technologies.
We further qualify the additional effect of green technologies compared to non-green technologies for the quantiles where the interaction between Pat Green and Age is significant (Table5, percentiles 50th to 90th). For young firms (those with less than 5 years for the 50th and 75th percentiles of growth rate and below 10 years for the 90th percentile), a stronger association can be determined between non-green technologies and firm growth vs. green technologies and growth. On the contrary, for more mature firms (i.e. those with more than 20 years for the 50th and 75th percentiles of growth rate and above 30 years for the 90th percentile), green technologies exert a higher effect on firm growth com-pared to non-green technologies (Figure A3 in the Online Appendix provides a graphical representation). These quantile-specific effects further confirm the choice of a quantile approach as the most suitable to identifying the different effects of the interplay between green technology and age on firm growth.
5 Conclusions
In this paper, we examined the capacity of green tech-nologies to sustain firm growth, building upon the idea that a firm’s capacity to grow is closely linked to its ability to master technological knowledge and capture the value of the innovation (Mansfield 1962; Scherer
1965). While an extensive body of industrial organisa-tion and innovaorganisa-tion literature has addressed the growth impact of technology (e.g. Audretsch et al.2014), only a few studies have examined the relationship between green technologies and firm growth. Our contribution is novel for two reasons. First, we assessed whether green technologies, compared to non-green technolo-gies, affect the growth of firms with different growth paces (e.g. struggling or rapidly growing). Second, we
considered whether green-based growth is affected by a firm’s age.
We adopted a novel econometric approach, combin-ing panel fixed effects with quantile regression estima-tions. We thus simultaneously controlled for unobserved heterogeneity (which is likely to affect firm growth) and for the heterogeneity of the growth process, along the distribution of growth rates.
Our analysis of a large sample of Italian firms be-tween 2000 and 2008 confirms the vital role of green and non-green technologies in fostering firm growth, as measured by the growth of employment. Moreover, the results indicate a‘win-win’ situation as green technolo-gies exert superior effects on growth than non-green ones. The possibility to enter green markets, to decrease production costs because of greater resource efficiency (e.g. reduced material and energy use) and to reinvest the relative extra returns from eco-innovating can justify this result. However, our analysis shows that the supe-rior effect of green technologies does not extend to the extreme percentiles of the growth rate distribution.
The second contribution of the paper pertains to the moderating effects of age: the green growth path is mainly taken by mature firms (age higher than 20 or 30 years), with the exception of the slow-growing ones. Hence, more mature companies seem to be better equipped to transform green technology into growth. Although further research is required, we contend that greater experience, fewer financial constraints and ex-emption from issues related to the liability of newness (e.g. Freeman et al. 1993)—a set of aspects that are
particularly relevant in the Italian context—allow older firms to engage successfully in complex and uncertain technological projects, such as environmentally related ones. These results are partially balanced by the positive effects on young companies of non-green technologies, which trigger short-term firm growth (for the central quantiles), possibly because of their less complex and costly nature.
These results hold important implications both for management and for policy. Extracting value from green technology and transforming it into higher growth is not a‘one-size-fits-all’ strategy. On the one hand, struggling firms might not find it viable to engage in more complex and costly green technological projects. On the other hand, for the elite group of fast-growing companies, a green orientation might not add to their portfolios of already outperforming and possibly unique—compared to their competitors—technological capabilities. As
said, our results suggest that the process of green-led growth is a complex and costly one: only older compa-nies are sufficiently broad shouldered to pursue a growth path based on environmental technology.
Building on our evidence, we also believe that our results have relevant implications for policy makers. If their short-run objective is to maximise the social impact of public resources in supporting the transition towards green forms of production, the main beneficiary group should be made of relatively established firms, rather than start-ups. This aspect should be considered when implementing policies favouring innovative start-ups (e.g. Mason and Brown 2013; European Commission
2014).
In conclusion, this is a first attempt at providing empirical evidence for the relation between firm growth and green technology. From a policy implications’ per-spective, future research should investigate the mecha-nisms that make growth particularly problematic for young companies. Further research should also go be-yond patenting firms: patent data, although the most diffused source of information for defining continuous firm-level innovation variables (e.g. Gagliardi et al.
2016) does not capture all the innovations introduced by firms (Griliches1990).
Acknowledgements Previous versions of this paper have been presented at the following: workshop BBorn to be Green. The Economics and Management of Green Start-Ups^, Southampton Business School (UK) 21–22 May 2015; 2016 Italian Economic Association Conference, Bocconi University of Milan (IT), 20–22 October 2016; 13th European Network on the Economics of the Firm (ENEF) Meeting, University of Turin (IT), 13–14 September, 2016; SPRU 50th Anniversary Conference, University of Sussex (UK), 7–9 September 2016; 2016 Conference of the Governance of a Complex World (GCW)BInnovation, Employment and the Environment^, INGENIO (CSIS-UPV), Valencia (ES), 22–24 June 2016; 2016 DRUID Conference, Copenhagen Business School (DK) 13–15 June 2016. We are grateful to the discussants and participants of these conferences, as well as to two anonymous referees for their precious comments. We also acknowledge the help and suggestions of Giovanni Marin and Alex Coad on data and methods, respectively. Usual caveats apply.
Open Access This article is distributed under the terms of the Creative Commons Attribution 4.0 International License (http:// creativecommons.org/licenses/by/4.0/), which permits unrestrict-ed use, distribution, and reproduction in any munrestrict-edium, providunrestrict-ed you give appropriate credit to the original author(s) and the source, provide a link to the Creative Commons license, and indicate if changes were made.
References
Acs, Z., Audretsch, D. B. 2006. Handbook of entrepreneurship research: an interdisciplinary survey and introduction. Vol.1, Springer Science & Business Media.
Ambec, S., & Lanoie, P. (2008). Does it pay to be green? A systematic overview. Academy of Management Perspectives, 22(4), 45–62.https://doi.org/10.5465/AMP.2008.35590353. Ambec, S., Cohen, M. A., Elgie, S., & Lanoie, P. (2013). The
Porter hypothesis at 20: can environmental regulation en-hance innovation and competitiveness? Review of Environmental Economics and Policy, 7(1), 2–22.
Almus, M. (2002). What characterizes a fast-growing firm? Applied Economics, 34, 1497–1508.
Arundel, A., Kemp, R. 2009. Measuring eco-innovation. 2009– 017. UNU-MERIT Working Paper Series. Maastricht.
https://search.oecd.org/greengrowth/consumption-innovation/43960846.pdf.
Audretsch, D. B., Coad, A., & Segarra, A. (2014). Firm growth and innovation. Small Business Economics.https://doi. org/10.1007/s11187-014-9560-x.
Audretsch, D. B., Santarelli, E., & Vivarelli, M. (1999). Start-up size and industrial dynamics: some evidence from Italian manufacturing. International Journal of Industrial Organization, 17(7), 965–983.
Autio, E., Sapienza, H. J., & Almeida, J. G. (2000). Effects of age at entry, knowledge intensity, and imitability on international growth. Academy of Management Journal, 43(5), 909–924.
https://doi.org/10.2307/1556419.
Barba Navaretti, G., Castellani D., Pieri, F. 2014. Age and firm growth: evidence from three European countries. Small Business Economics, 1–15. doi:https://doi.org/10.1007 /s11187-014-9564-6.
Benfratello, L., Schiantarelli, F., & Sembenelli, A. (2008). Banks and innovation: microeconometric evidence on Italian firms. Journal of Financial Economics, 90(2), 197–217.
Berrone, P., Fosfuri, A., Gelabert, L., & Gomez-Mejia, L. R. (2013). Necessity as the mother of‘green’ inventions: insti-tutional pressures and environmental innovations. Strategic Management Journal, 34(8), 891–909. https://doi. org/10.1002/smj.2041.
Bird, L. A., Wüstenhagen, R., & Aabakken, J. (2002). A review of international green power markets: recent experience, trends, and market drivers. Renewable and Sustainable Energy Reviews, 6, 513–536.
Bloom, N., & Van Reenen, J. (2002). Patents, real options and firm performance. Economic Journal, 112(478).https://doi. org/10.1111/1468-0297.00022.
Blundell, R., Griffith, R., & Van Reenen, J. (1995). Dynamic count data models of technological innovation. The Economic Journal, 105(429), 333.https://doi.org/10.2307/2235494. Bottazzi, G., Coad, A., Jacoby, N., & Secchi, A. (2011). Corporate
growth and industrial dynamics: evidence from French manufacturing. Applied Economics, 43(1), 103–116.
https://doi.org/10.1080/00036840802400454.
Bottazzi, G., & Secchi, A. (2003). Why are distributions of firm growth rates tent-shaped? Economics Letters, 80(3), 415– 420.https://doi.org/10.1016/S0165-1765(03)00142-3.
Bottazzi, G., & Secchi, A. (2006). Explaining the distribution of firm growth rates. The Rand Journal of Economics, 37(2), 235– 256.https://doi.org/10.1111/j.1756-2171.2006.tb00014.x. Buchinsky, M. (1998). Recent advances in quantile regression
models: a practical guideline for empirical research. The Journal of Human Resources, 33(1), 88–126.https://doi. org/10.2307/146316.
Cainelli, G., De Marchi, V., & Grandinetti, R. (2015). Does the development of environmental innovation require different resources? Evidence from Spanish manufactur-ing firms. Journal of Cleaner Production, 94(2015), 211–220.
Calvo, J. L. (2006). Testing Gibrat’s law for small, young and innovating firms. Small Business Economics, 26, 117–123. Canay, I. A. (2011). A simple approach to quantile regression for
panel data. The Econometrics Journal, 14(3), 368–386.
https://doi.org/10.1111/j.1368-423X.2011.00349.x. Carpenter, R. E., & Rondi, L. (2000). Italian corporate
gover-nance, investment, and finance. Empirica, 27(4), 365–388. Carr, J. C., Haggard, K. S., Hmieleski, K. M., & Zahra, S. A.
(2010). A study of the moderating effects of firm age at internationalization on firm survival and short-term growth. Strategic Entrepreneurship Journal, 4(2), 183–192. Carrillo-Hermosilla, J., Rio, P., & Konnola, T. (2010). Diversity of
eco-innovations: reflections from selected case studies. Journal of Cleaner Production, 18(10), 1073–1083. Cefis, E. (2003). Is there persistence in innovative activities?
International Journal of Industrial Organization, 21(4), 489–515.
Chassagnon, V., & Haned, N. (2015). The relevance of innovation leadership for environmental benefits: a firm-level empirical analysis on French firms. Technological Forecasting and Social Change, 91, 194–207. https://doi.org/10.1016/j. techfore.2014.02.012.
Clarysse, B., Wright, M., & Van de Velde, E. (2011). Entrepreneurial origin, technological knowledge, and the growth of spin-off companies. Journal of Management Studies, 48(6), 1420–1442. https://doi.org/10.1111/j.1467-6486.2010.00991.x.
Coad, A. 2009. The growth of firms: a survey of theories and empirical evidence. Edward Elgar Publishing.
Coad, A. (2010). Exploring the processes of firm growth: evidence from a vector auto-regression. Industrial and Corporate Change, 19(6), 1677–1703. https://doi.org/10.1093 /icc/dtq018.
Coad, A., and Holz, W. 2012.BFirm growth: empirical analysis. In Handbook on the economics and theory of the firm, edited by Michael Dietrich and Jackie Krafft. Edward Elgar Publishing.
Coad, A., Rao, R. 2006. Innovation and market value: a quantile regression analysis. Economics Bulletin 15 (1). doi:
https://doi.org/10.1016/j.bbrc.2007.02.039.
Coad, A., & Rao, R. (2008). Innovation and firm growth in high-tech sectors: a quantile regression approach. Research Policy, 37(4), 633–648.https://doi.org/10.1016/j.respol.2008.01.003. Coad, A., & Rao, R. (2010). Firm growth and R&D expenditure.
Economics of Innovation and New Technology, 19(2), 127– 145.https://doi.org/10.1080/10438590802472531. Coad, A., & Rao, R. (2011). The firm-level employment effects of
innovations in high-tech US manufacturing industries.
Journal of Evolutionary Economics, 21(2), 255–283.
https://doi.org/10.1007/s00191-010-0209-x.
Coad, A., Segarra A., Teruel, M. 2013. Like milk or wine: does firm performance improve with age? Structural Change and Economic Dynamics 24. Elsevier B.V.: 173–89. doi:
https://doi.org/10.1016/j.strueco.2012.07.002.
Coad, A., Segarra, A., & Teruel, M. (2016). Innovation and firm growth: does firm age play a role? Research Policy, 45(2), 387–400. https://doi.org/10.1016/j. respol.2015.10.015.
Colombelli, A., Krafft, J., Quatraro, F. 2015. Eco-innovation and firm growth: do green gazelles run faster? Microeconometric evidence from a sample of European firms GREDEG Working Papers 2015-12, Groupe de REcherche en Droit, Economie, Gestion (GREDEG CNRS), University of Nice Sophia Antipolis.
Consoli, D., Marin, G., Marzucchi, A., & Vona, F. (2016). Do green jobs differ from non-green jobs in terms of skills and human capital? Research Policy, 45(5), 1046–1060. Criscuolo, P., Nicolaou, N., Salter, A. 2012. The elixir (or burden) of
youth? Exploring differences in innovation between start-ups and established firms. Research Policy 41 (2). Elsevier B.V.: 319–33. doi:https://doi.org/10.1016/j.respol.2011.12.001. D’Agostino, L. M. (2015). How MNEs respond to environmental
regulation: integrating the Porter hypothesis and the pollution haven hypothesis. Economia Politica., 32(2), 245–269.
https://doi.org/10.1007/s40888-015-0010-2.
Dean, T. J., & McMullen, J. S. (2007). Toward a theory of sustainable entrepreneurship: reducing environmental degra-dation through entrepreneurial action. Journal of Business Venturing, 22(1), 50–76. https://doi.org/10.1016/j. jbusvent.2005.09.003.
Delmar, F., Davidsson, P., & Gartner, W. (2003). Arriving at the high-growth firm. Journal of Business Venturing, 18, 189–216.
Denicolò, V. (2001). Growth with non-drastic innovations and the persistence of leadership. European Economic Review, 45(8), 1399–1141.
Distante, R., Petrella, I., Santoro, E. 2014. Size, age and the growth of firms: new evidence from quantile regressions. Fondazione Enrico Mattei Working Paper, Paper 970. Available at:http://services.bepress.com/feem/paper970
European Commission, 2014. European employment policy ob-servatory review. Activating jobseekers through entrepre-neurship: start-up incentives in Europe. Directorate-General for Employment, Social Affairs and Inclusion.
Evans, D. S. (1987). Test of alternative theories of firm growth. Journal of Political Economy, 95, 657–674.
Franco, C., Marzucchi, A. and Montresor, S. 2014.Absorptive capacity, proximity in cooperation and integration mecha-nisms. Empirical evidence from CIS data, Industry and Innovation, Vol. 21, n.4, pp. 332–357.
Freeman, J., Carroll, G. R., & Hannan, M. T. (1993). The liability of newness: age dependence in organizational death rates. American Sociological Review, 48(5), 692. https://doi. org/10.2307/2094928.
Gagliardi, L., Marin, G., Miriello, C. 2016. The greener the better? Job creation effects of environmentally-friendly technologi-cal change. Industrial and Corporate Change, January. doi:
Galvao, A. F. 2011. Quantile regression for dynamic panel data with fixed effects. Journal of Econometrics 164 (1). Elsevier B.V.: 142–57. doi:https://doi.org/10.1016/j.jeconom.2011.02.016. Geroski, P. A., Van Reenen, J., & Walters, C. F. (1997). How
persistently do firms innovate? Research Policy, 26(1), 33– 48.
Geroski, P. A., Mata, J., & Portugal, P. (2010). Founding condi-tions and the survival of new firms. Strategic Management Journal, 31(5), 510–529.https://doi.org/10.1002/smj.823. Ghisetti, C., Marzucchi, A., & Montresor, S. (2015). The open
eco-innovation mode. An empirical investigation of eleven European countries. Research Policy, 44, 1080–1093.
https://doi.org/10.1016/j.respol.2014.12.001.
Ghisetti, C., & Rennings, K. (2014). Environmental innovations and profitability: how does it pay to be green? An empirical analysis on the German innovation survey. Journal of Cleaner Production, 75, 106–117.
Ghisetti, C., & Quatraro, F. (2013). Beyond inducement in climate change: does environmental performance spur environmental technologies? A regional analysis of cross-sectoral differ-ences. Ecological Economics, 96, 99–113.
Gibrat, R. (1931) Les inegualites economiques. Librairie du Receuil Sirey, Paris.
Gibrat, R. 2003. On economic inequalities. INTERNATIONAL LIBRARY OF CRITICAL WRITINGS IN ECONOMICS 158. EDWARD ELGAR PUBLISHING LTD: 497–514. Giovannetti, G., Ricchiuti, G., & Velucchi, M. (2013). Size,
inno-vation and internationalization: a survival analysis of Italian firms. Applied Economics, 43(12), 1511–1520.
Grazzi, M., Jacoby, N., Treibich, T. 2015. Dynamics of investment and firm performance: comparative evidence from manufacturing industries Empirical Economics, in press. Gregory, B. T., Rutherford, M. W., Oswald, S., & Gardiner, L. (2005).
An empirical investigation of the growth cycle theory of small firm financing. Journal of Small Business Management.
https://doi.org/10.1111/j.1540-627X.2005.00143.x.
Griliches, Z. (1990). Patent statistics as economic indicators: a survey. Journal of Economic Literature, 28(4), 1661–1707. Hall, B. H. (1987). The relationship between firm size and firm
growth in the US manufacturing sector. The Journal of Industrial Economics.https://doi.org/10.2307/2098589. Hall, B. H. (1993). The stock market’s valuation of R&D
invest-ment during the 1980’s. The American Economic Review, 83(2), 259–264http://www.jstor.org/stable/2117674?seq=1 #page_scan_tab_contents.
Hall, B. H., Jaffe, A., & Trajtenberg, M. (2005). Market value and patent citations. RAND Journal of Economics, 86, 2418– 2427.https://doi.org/10.1007/s00216-009-2643-x.
Hall, B. H., Moncada-Paternò-Castello, P., Montresor, S., & Vezzani, A. (2016). Financing constraints, R&D investments and innovative performances: new empirical evidence at the firm level for Europe. Economics of Innovation and New Technology, 25(3), 183–196. https://doi.org/10.1080 /10438599.2015.1076194.
Hallegatte, S., Heal, G., Fay, M., Treguer, D. 2012. From growth to green growth—a framework, National Bureau of Economic Research NBER Working Paper No. 17841. Haltiwanger, J., Jarmin, R., & Miranda, J. (2013). Who creates
jobs? Small versus large versus young. The Review of Economics and Statistics, 95(2), 347–361. https://doi. org/10.1162/REST_a_00288.
Hartarska, V., & Gonzalez-Vega, C. (2006). What affects new and established firms’ expansion? Evidence from small firms in Russia. Small Business Economics, 27(2–3), 195–206.
https://doi.org/10.1007/s11187-006-0012-0.
Herriott, S. R., Levinthal, D. A., & March, J. G. (1985). Learning from experience in organizations. The American Economic Review, 75(2), 298–302.https://doi.org/10.2307/1805614. Hockerts, K., & Wüstenhagen, R. (2010). Greening Goliaths
versus emerging Davids theorizing about the role of incum-bents and new entrants in sustainable entrepreneurship. Journal of Business Venturing, 25, 481–492.
Horbach, J., & Rennings, K. (2013). Environmental innovation and employment dynamics in different technology fields—an analysis based on the German Community Innovation Survey 2009. Journal of Cleaner Production, 57(October), 158–165. https://doi.org/10.1016/j. jclepro.2013.05.034.
Horváthová, E. (2010). Does environmental performance affect financial performance? A meta-analysis. Ecological Economics, 70(1), 52–59. https://doi.org/10.1016/j. ecolecon.2010.04.004.
Kaniovski, S., & Peneder, M. (2008). Determinants of firm sur-vival: a duration analysis using the generalized gamma dis-tribution. Empirica, 35(1), 41–58.
Kesidou, E., & Demirel, P. (2012). On the drivers of eco-innova-tions: empirical evidence from the UK. Research Policy, 41(5), 862–870.https://doi.org/10.1016/j.respol.2012.01.005. Koenker, R. (2004). Quantile regression for longitudinal data.
Journal of Multivariate Analysis, 91(1), 74–89.https://doi. org/10.1016/j.jmva.2004.05.006.
Koenker, R., & Hallock, K. F. (2001). Quantile regression. Journal of Economic Perspectives, 15(4), 143–156. https://doi. org/10.1257/jep.15.4.143.
Lawless, M. (2014). Age or size? Contributions to job creation. Small Business Economics, 42(4), 815–830.
Levitt, B., & March, J. G. (1988). Organizational learning. Annual Review of Sociology, 14(1), 319–338.https://doi.org/10.1146 /annurev.so.14.080188.001535.
Licht, G., Peters, B. 2013. The impact of green innovation on employment growth in Europe. WWW for Europe Working Paper, n. 50. http://www.foreurope.eu/fileadmin/ ?documents/pdf/Workingpapers/WWWforEurope_WPS_ no050_MS53.pdf
Lotti, F., Santarelli, E., & Vivarelli, M. (2009). Defending Gibrat’s law as a long-run regularity. Small Business Economics, 32(1), 31–44.https://doi.org/10.1007/s11187-007-9071-0. Lotti, F., Marin, G. 2013. Matching of PATSTAT applications to
AIDA firms—discussion of the methodology and results. Occasional Papers (Questioni di Economia e Finanza) no. 166, Banca d'Italia.
Magri, S. (2009). The financing of small innovative firms: the Italian case. Economics of Innovation and New Technology., 18(2), 181–204.
Majumdar, S. K. (1997). The impact of size and age on firm-level performance: some evidence from India. Review of Industrial Organization, 12(2), 231–241. https://doi.org/10.1023 /A:1007766324749.
Malerba, F. (2005). Sectoral systems: how and why innovation differs across sectors. In J. Fagerberg, D. C. Mowery, & R. R. Nelson (Eds.), The Oxford handbook of innovation (pp. 380– 406). Oxford: Oxford University Press.
Malerba, F. (1993). The national system of innovation: Italy. In R. Nelson (Ed.), National systems of innovations. Oxford: Oxford Univ. Press.
Malerba, F., & Orsenigo, L. (1995). Schumpeterian patterns of innovation. Cambridge Journal of Economics, 19(1), 47–65. Mansfield, E. (1962). Entry, Gibrat’s law, innovation, and the growth of firms. American Economic Review, 52(5), 1023– 1051.https://doi.org/10.1126/science.151.3712.867-a. Marin, G. (2014). Do eco-innovations harm productivity growth
through crowding out? Results of an extended CDM model. Research Policy, 43(2), 301–317.
Marin, G., Lotti, F. 2016. Productivity effects of eco-innovations using data on eco-patents, Industrial and Corporate Change, forthcoming.
Mason, C., & Brown, R. (2013). Creating good public policy to support high-growth firms. Small Business Economics, 40, 211–225.
Mata, J., & Portugal, P. (2002). The survival of new domestic and foreign-owned firms. Strategic Management Journal, 23(4), 323–343.https://doi.org/10.1002/smj.217.
Mazzanti, M., Rizzo, U. 2017. Diversely moving towards a green economy: techno-organisational decarbonisation trajectories and environmental policy in EU sectors Technological Forecasting and Social Change, 115,111-116.https://doi. org/10.1016/j.techfore.2016.09.026.
Misani, N., & Pogutz, S. (2015). Unraveling the effects of envi-ronmental outcomes and processes on financial performance: a non-linear approach. Ecological Economics, 109, 150–160. OECD. 2015. Patent search strategies for the identification of selected environment-related technologies (ENV-TEC).
h t t p : / / w w w. o e c d . o r g / e n v i r o n m e n t / c o n s u m p t i o n -innovation/env-tech-search-strategies.pdf.
Oltra, V., & Saint Jean, M. (2009). Sectoral systems of environ-mental innovation: an application to the French automotive industry. Technological Forecasting and Social Change, 7, 567–583.https://doi.org/10.1016/j.techfore.2008.03.025. Parente, P. M., & Santos Silva, J. (2016). Quantile regression with
clustered data. Journal of Econometric Methods, 5(1), 1–15. Parikka-Alhola, K. (2008). Promoting environmentally sound furni-ture by green public procurement. Ecological Economics, 68(1– 2), 472–485.https://doi.org/10.1016/j.ecolecon.2008.05.004. Peters, B. (2009). Persistence of innovation: stylised facts and
panel data evidence. The Journal of Technology Transfer, 34(2), 226–243.
Porter, M., & Van der Linde, C. (1995). Toward a conception of the environment-competitiveness relationship. Journal of Economic Perspectives, 9(4), 97.https://doi.org/10.1257 /jep.9.4.97.
Raymond, W., Mohnen, P., Palm, F., & Van Der Loeff, S. S. (2010). Persistence of innovation in Dutch manufacturing:
is it spurious? The Review of Economics and Statistics, 92(3), 495–504.
Rennings, K., Ziegler, A., & Zwick, T. (2004). The effect of environmental innovations on employment changes: an econometric analysis. Business Strategy and the Environment, 13(6), 374–387. https://doi.org/10.1002 /bse.424.
Rennings, K., & Zwick, T. (2002). Employment impact of cleaner production on the firm level: empirical evidence from a survey in five European countries. International Journal of Innovation Management, 06(03), 319–342.https://doi. org/10.1142/S1363919602000604.
Ruth, M., Davidsdottir, B., & Amato, A. (2004). Climate change policies and capital vintage effects: the cases of US pulp and paper, iron and steel, and ethylene. Journal of Environmental Management, 70(3), 235– 252.
Sàez-Martínez, F. J., Díaz-García, C., & Gonzalez-Moreno, A. (2016). Firm technological trajectory as a driver of eco-innovation in young small and medium-sized enterprises. Journal of Cleaner Production, 138, 28–37. https://doi. org/10.1016/j.jclepro.2016.04.108.
Scherer, F. M. (1965). Corporate inventive output, profits, and growth. Journal of Political Economy, 73(3), 290–297. Schneider, C., & Veugelers, R. (2010). On young highly
innova-tive companies: why they matter and how (not) to policy support them. Industrial and Corporate Change, 19(4), 969– 1007.https://doi.org/10.1093/icc/dtp052.
Sorensen, J. B., & Stuart, T. E. (2000). Aging obsolescence, and organizational innovation. Administrative Science Quarterly, 45, 81–112.https://doi.org/10.2307/2666980.
Stanley, M. H. R., Amaral, L. A. N., Buldyrev, S. V., Havlin, S., Leschhorn, H., Maass, P., Salinger, M. A., & Stanley, H. E. (1996). Scaling behaviour in the growth of companies. Nature, 379, 804–806.
Stenzel, T., & Frenzel, A. (2008). Regulating technological change. The strategic reactions of utility companies towards subsidy policies in the German, Spanish and UK electricity markets. Energy Policy, 36, 2645–2657.
Sutton, J. 1998. Gibrat’s legacy. Journal of Economic Literature XXXV (March): 40–59.
Tsai, C. (2012). A research on selecting criteria for new green product development project: taking Taiwan consumer elec-tronics products as an example. Journal of Cleaner Production, 25, 106–115. https://doi.org/10.1016/j. jclepro.2011.12.002.
Wooldridge, J. M. 2010. Econometric analysis of cross section and panel data. MIT Press. doi:https://doi.org/10.1515 /humr.2003.021.