DOTTORATO DI RICERCA IN
"SCIENZE DELL’INGEGNERIA"
CICLO XXIV
COORDINATORE Prof. Stefano Trillo
Environmental risk of pharmaceuticals in waters:
Investigation on their occurrence and removal in
conventional treatment plants.
Settore Scientifico Disciplinare ICAR/03
Dottorando Tutore
Dott. Al Aukidy Mustafa Prof. Verlicchi Paola
(firma) (firma)
Ph.D IN
"SCIENCE OF ENGINEERING"
XXIV CYCLECOORDINATOR Prof. Stefano Trillo
Environmental risk of pharmaceuticals in waters:
Investigation on their occurrence and removal in
conventional treatment plants.
Disciplinary Scientific Sector ICAR/03
Ph. D Student Tutore
Al Aukidy Mustafa Prof. Verlicchi Paola
(Signature) (Signature)
Firstly I would like to thank Allah Almighty for giving me courage and support in order to accomplish the task of my Ph.D Thesis. Allah helps me a lot in all the stages of this thesis and gave me ideas to implement, things to achieve my desired goals.
I would like thank my supervisor Prof. Paola Verlicchi, I am deeply indebted to her for her help expertise and encouragement throughout my time as a PhD student. I could not have imagined having a better advisor and mentor for my Ph.D study.( Grazie Paola). Special thanks to Prof. Luigi Masotti for giving me the opportunity to be involved in his research group, that opened my eyes to many different fields, and to his support and advices during the field works.
I am very thankful to the Iraqi ministry of higher education and scientific research and Italian ministry of foreign affair for the financial support given to me.
I would like to thank Prof. Damia Barcelò and Prof. Mira Petrovic’ that give me the opportunity to perform the chemical analysis of the withdrawal water samples in their laboratory, special thanks go also to Dr. Aleksandra Jelic for her assistance during the analysis.
I would also like to thank Dr. Nick Vuolvuolis and all the member of the Centre for environmental policy, Imperial college of London for their support, advices and hospitality during my stay in London.
Special thanks to prof. Mira Petrovic, Prof. Fabio Conti and Dr. Ole Pahl for accepting to be my thesis committee.
I also want to thank my friends Alessio Galletti and Elena Zambello who welcomed me in the laboratory and helped me during this study.
Special thanks to whom supported me and shared my days even from far distance, who was always capable to convert my cloudy day into a sunny one.(grazie Rosy).
Lastly, I would like to dedicate this thesis to my family whose encouragement, guidance and never ending support inspired me from beginning to end. Thanks to my father Mr.Tareq Al-Ogaidi, my mother Ms. Faraed Al-Ogaidi who are most important part of my life. I would also like to thank my whole family my brothers Zeyad and Ghaith and my nephews Tuqa, Ruaa and Jennat and my uncles Karim and Ibrahim for giving me moral support throughout the studying period.
Mustafa Ferrara, February 2013
I
Chapter 1: Introduction
1.1 The Scientific interest towards Pharmaceutical compounds as emerging contaminants... 3
1.2 Aim and Objectives... 5
Chapter 2: Background 2.1 Introduction ... 11
2.2 Physico-chemical properties of pharmaceutical compounds (PhCs) ... 11
2.2.1 Volatility ... 11 2.2.2 Acidity ... 12 2.2.3 Lipophilicity ... 12 2.2.4 Sorption Potential ... 13 2.3 Pharmaceutical consumption ... 13 2.4 Toxicity of PhCs ... 14
2.5 Legislation on PhCs in the aquatic environment ... 15
2.6 Environmental risk assessment of PhCs. ... 17
2.7 Source and pathways of PhCs ... 18
2.8 Occurrence and fate of PhCs in wastewaters ... 19
2.8.1 Mostly Investigated PhCs ... 21
2.8.2 Main features of the mostly investigated wastewater treatment plants (WWTPs) ... 22
2.8.3 Quality assurance of literature data ... 31
2.9 Occurrence of PhCs in raw urban wastewaters (UWWs) ... 40
2.10 Occurrence of PhCs in secondary biological effluents ... 45
2.11 Observed removal efficiencies in WWTPs ... 51
2.11.1 Considerations on the observed removal efficiencies of the selected PhCs. ... 65
2.11.1.1 Effect of biomass concentration and sludge retention time (SRT) ... 65
2.11.1.2 Effect of Hydraulic retention time (HRT) ... 73
2.11.1.3 Effect of pH ... 74
2.11.1.4 Effect of temperature ... 75
2.11.1.5 Effect of Treatment configuration ... 76
2.12 Average daily mass loads of PhCs in secondary effluents ... 77
2.13 Environmental risk assessment of secondary biological effluent ... 78
2.14 Conclusion ... 89
Chapter 3: Hospital effluent: Investigation of the concentrations and distribution of PhCs and environmental risk assessment 3.1 Introduction ... 93
3.1.1 Hospital Wastewaters (HWWs) ... 93
3.1.2 Ecotoxicity of HWWs ... 94
3.1.3 Antibiotic resistant bacteria in HWWs... 95
3.1.4 Hospitals as a point source of PhCs ... 96
3.2 Experimental materials and methods ... 97
II
3.2.4 Standards ... 100
3.2.5 Analytical methods ... 100
3.2.6 Risk Quotients (RQ) and Ecotoxicological Risk Assessment ... 101
3.3 Results and discussion ... 105
3.3.1 Comparison of PhC Concentrations in the Effluent from Hospitals A and B in Summer ... 107
3.3.2 Comparison between Summer and Winter Concentrations of PhCs in Hospital B Effluent ... 107
3.3.3 Comparison between Winter Concentrations of PhCs in Hospital B effluent and WWTP Influent ……….…111
3.3.4 Contribution of Hospital B Loads to WWTP influent ... 111
3.3.5 Environmental Risk Analysis ... 116
3.4 Conclusions ... 118
Chapter 4: Evaluation of the removal and release of PhCs from full -scale WWTPs and their impacts on the receiving water bodies 4.1 Introduction ... 123
4.2 Materials and methods ... 124
4.2.1 Pharmaceutical compounds ... 124
4.2.2 Sampling area and sample collection ... 127
4.2.3 Standards ... 129
4.2.4 Analytical methods ... 130
4.2.5 Statistical analysis... 131
4.2.6 Environmental risk assessment ... 133
4.3 Results and discussion ... 133
4.3.1 Removal of selected pharmaceuticals in the WWTP B. ... 133
4.3.2 Occurrence of selected pharmaceuticals in the investigated WWTP effluents ... 134
4.3.3 Occurrence of selected pharmaceuticals in the two receiving surface water bodies ... 140
4.3.4 Pharmaceutical load discharged into the environment ... 146
4.3.5 Environmental impact of the selected PhCs ... 148
4.4 Conclusions ... 151
Chapter 5: Predicted and measured concentration of selected PhCs: Towards an accurate environmental risk assessment 5.1 Introduction ... 155
5.2 Materials and methods ... 155
5.2.1 WWTP and receiving water body ... 155
5.2.2 Selected compounds ... 156
5.2.3 Measured environmental concentration (MEC) ... 156
5.2.4 Predicted environmental concentrations (PEC) for the selected PhCs ... 156
5.2.4.1 WWTP Influent and effluent ... 156
5.2.4.2 Surface water ... 158
5.3 Results and discussion ... 159
5.3.1 Predicted environmental concentrations ... 159
III
5.3.3 Comparison of PEC and MEC ... 162
5.3.4 Explanation of discrepancies ... 164
5.4 Conclusions ... 166
Chapter 6: Environmental Risk Assessment of PhCs as a Tool for the Management of Hospital Effluents 6.1 Introduction ... 171
6.2 Methodology ... 173
6.2.1 Evaluation of the environmental Risk posed by PhCs in HWWs. ... 176
6.2.2 Evaluation of the environmental risk in surface water posed by PhCs originated from HWWs ……….………176
6.2.3 Evaluation of the relative importance of hospitals and catchments area on the risk of PhCs in the influent of WWTPs ... 181
6.2.4 Case studies ... 182
6.3 Results ... 183
6.3.1 Environmental risk posed by PhCs in HWWs ... 183
6.3.2 Environmental Risk in surface water posed by PhCs originated from HWWs ... 184
6.3.3 The relative importance of hospitals and catchments area on the risk of PhCs in the influent of WWTPs ... 186
6.4 Discusion ... 188
6.5 Method limitations ... 189
6.6 Application of the tool and management options ... 190
6.7 Conclusion ... 191
Chapter 7: Conclusions 7.1 Findings ... 195
7.2 Suggestions for future research. ... 199
Appendix A……… 201
Appendix B ………247
Appendix C ………251
Appendix D List of Publications………...………...……….257
V
Table 2.1. Volume of pharmaceutically active compounds sold in different countries (kg/yr). ……… 13
Table 2.2. Pharmaceutical compounds examined, grouped according to their therapeutical class. For each substance, chemical formula and molecular weight (MW) are provided as well as number of papers and references dealing with it. ……….24
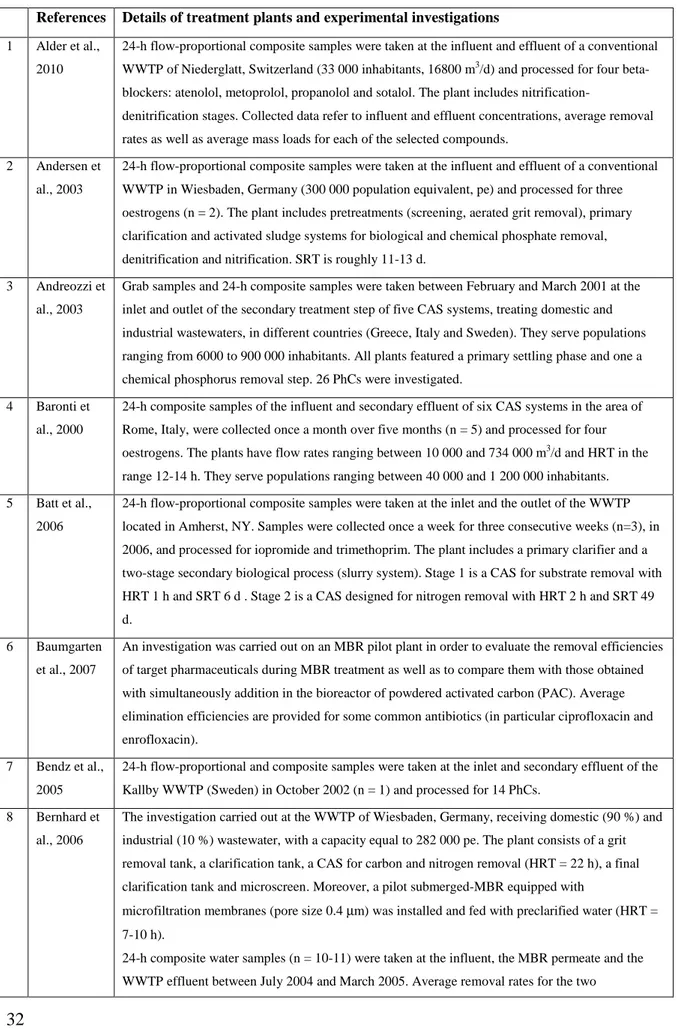
Table 2.3 Main characteristics of the treatment plants and monitoring campaigns included in the litereature review. ……….32
Table 2.4. Fractions with respect to the influent mass load of selected PhCs removed during secondary biological treatment, sorbed to sludge and discharged with secondary effluent. Data with a star as apex refer to MBR systems ……….61
Table 2.5. Average removal efficiencies obtained in CAS systems for the selected pharmaceuticals with respect to the operating SRT in the bioreactor and the corresponding references. ……… 68
Table 2.6. Average removal efficiencies obtained in MBRs for the selected pharmaceuticals with respect to the operating SRT in the bioreactor and the corresponding references . ………...71
Table 2.7. PNECvalues for the PhCs under investigation and corresponding assayed species……… 80
Table 3.1. Investigated pharmaceutical compounds grouped according to therapeutic class………. 98
Table 3.2. Recovery and limits of detection (LOD) of the selected compounds. ... 102
Table 3.3. Ranges and average concentration levels of pharmaceuticals in effluents from the two hospitals and in the influent and effluent of Ferrara WWTP. ... 108
Table 3.4. Hospital B average percentage contributions for the detected compounds with respect to the WWTP influent loads and comparison with other studies. ... 113
Table 4.1. Consumption of selected compounds in Italy in 2010, expressed as defined daily dose per 1000 inhabitants per day (DDD 1000 inh-1 d-1) and the corresponding amount of compound consumed in that year (kg) evaluated using the conversion factor CF (mg active compound/DDD); percentage of excretion through human body after administration and percentage removal efficiency found in the literature. ... 126
Table 4.2. Characteristics of the two wastewater treatment plants under study ... 129
Table 4.3.Limits of detection (LOD), limits of quantification (LOQ) and precision of the method, expressed as a relative standard deviation (n=3)... 132
Table 4.4. Occurrence of pharmaceuticals in the effluents of WWTP A and WWTP B: Concentration ranges (ng L-1) with their mean values (n=3), their standard deviation SD and the frequency of detection f. Comparison with literature values referring to Italy and worldwide ... 139
Table 4.5. Predicted no-effect concentrations (PNECs, ng L-1) and corresponding risk quotients (RQs) for the selected compounds in the both two WWTP effluents and receiving water bodies. ... 150
Table 5.1. Amounts of the selected compounds used in Italy in 2010, in terms of DDD and kg/year, together with the conversion factor, excretion rate (from the literature) and removal efficiency (observed value) of each compound ... 157
VI
Table 5.2. Maximum daily dose, predicted environmental concentrations and predicted no effect concentrations for the selected compounds in WWTP influent, effluent and receiving water body ... 161 Table 5.3. Average environmental concentrations and standard deviations (µg L-1) for the selected pharmaceuticals in the WWTP influent, effluent and receiving surface water body ... 161 Table 5.4. Evaluation of the PEC/MEC ratio for the study area ... 164 Table 5.5. Factors behind discrepancies between measured and predicted environmental concentrations of pharmaceuticals in raw wastewater, treated effluent and surface waters. ... 166 Table 6.1. PhCs proposed to be a priority compounds by different research groups. ... 174 Table 6.2. Minimum and maximum concentration of selected PhCs in HWWS, Percentage removal rate in WWTPs and PNEC values. ... 179 Table A.1. Physico-chemical properties of the selected pharmaceuticals. Data with a star as apex refer to MBR systems. ... 203 Table A.2. Ranges of concentration in the influent for the selected pharmaceuticals together with their corresponding references. ... 222 Table A.3. Ranges of concentration for the selected pharmaceuticals in the effluent of CAS and MBR together with their corresponding references. ... 229 Table A.4. Ranges of removal efficiency for the selected pharmaceuticals with their corresponding references.. ... 237 Table B.1. Investigated compounds and their optimized QqLITMS/MS parameters in SRMnegative and -positive ionization modes. ... 249 Table C. 1.Concentration of Selected PhCs (ng L-1) up stream and down stream the discharge point of WWTPs A and B. ... 253 Table C. 2.Summary of experimental investigations carried out in this thesis. ... 254
VII
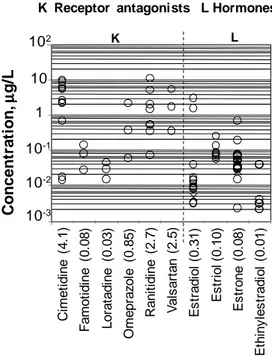
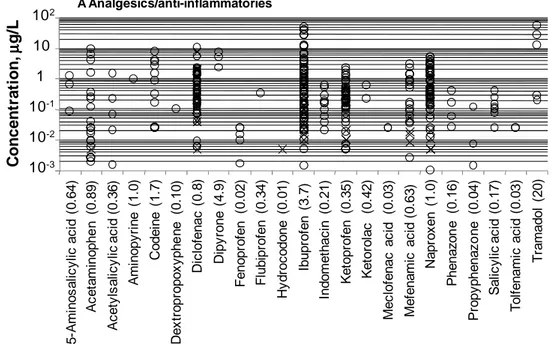
Figure 2.1. Sources and pathways of pharmaceutical compounds. ... 19 Figure 2.2. Historical development of the activated sludge process: from CAS for BOD removal to MBR and MBBR for enhancing the quality of the final effluent and upgrading the existing CAS maintaining the same footprint or reducing it. ... 23 Figure 2.3. Concentration of selected analgesics/anti-inflammatories measured in the raw influent to
municipal WWTP (o refers to CAS and x to MBR) and corresponding average values (in brackets). ... 41 Figure 2.4. Concentrations of selected antibiotics measured in the raw influent to municipal WWTPs (o refers to CAS and x to MBR) and corresponding average values (in brackets). ... 41 Figure 2.5. Concentrations of selected PhCs belonging to six therapeutic classes measured in the raw influent to municipal WWTPs (o refers to CAS and x to MBR) and corresponding average values (in
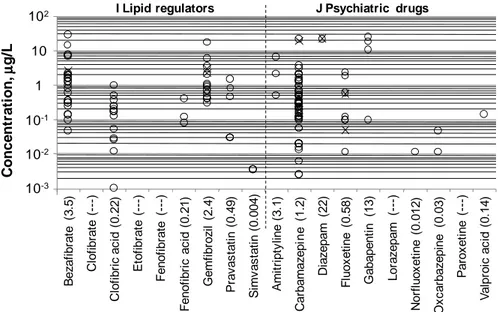
brackets). ... 42 Figure 2.6. Concentrations of selected lipid regulators and psychiatric drugs measured in the raw influent to municipal WWTPs (o refers to CAS and x to MBR) and corresponding average values (in brackets). ... 43 Figure 2.7. Concentrations of selected receptor antagonists and hormones measured in the raw influent to municipal WWTPs (o refers to CAS and x to MBR) and corresponding average values (in brackets). ... 44 Figure 2.8. Concentrations of other classes of micropollutants measured in the raw influent to municipal WWTPs (o refers to CAS and x to MBR) and their corresponding average values (in brackets). ... 45 Figure 2.9. Concentration of selected analgesics/anti-inflammatories measured in the secondary effluent (o refers to CAS and x to MBR) and corresponding average values (in brackets). ... 46 Figure 2.10. Concentration of selected antibiotics measured in secondary effluent (o refers to CAS and x to MBR) and corresponding average values (in brackets). ... 46 Figure2.11. Concentrations of selected PhCs from different classes measured in secondary biological effluent (o refers to CAS and x to MBR) and corresponding average values (in brackets). ... 47 Figure2.12. Concentrations of selected lipid regulators and psychiatric drugs measured in secondary biological effluent (o refers to CAS and x to MBR) and corresponding average values (in brackets). ... 48 Figure 2.13. Concentrations of receptor antagonists and hormones measured in secondary biological effluent (o refers to CAS and x to MBR) and corresponding average values (in brackets). ... 49 Figure 2.14. Concentrations of other classes of micropollutants measured in secondary biological effluent (o refers to CAS and x to MBR) and corresponding average values (in brackets). ... 50 Figure 2.15. Comparison between the ranges of variability for the selected classes in the influent and effluent of all the CAS and MBRs under study. ... 51 Figure 2.16. Percentage removal rates for analgesics/anti-inflammatories in WWTPs, and corresponding average values for CAS (o) and MBR (x). ... 55 Figure 2.17. Percentage removal rates of antibiotics in WWTPs and corresponding average values for CAS (o) and MBR (x). ... 56
VIII
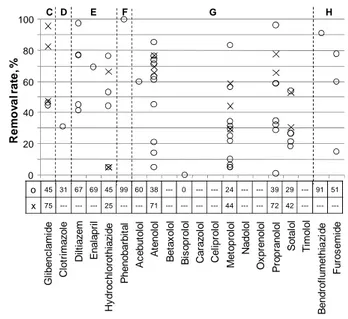
Figure 2.18. Percentage removal rates for some PhCs from different therapeutic classes in WWTPs, and corresponding average values for CAS (o) and MBR (x). ... 57 Figure 2.19. Percentage removal rates of selected lipid regulators and psychiatric drugs (o refers to CAS and x to MBR). ... 58 Figure 2.20. Percentage removal rates for selected receptor antagonists, hormones another PhCs, and corresponding average removal rates in CAS (o) and MBR(x). ... 59 Figure 2.21. Average daily mass loads evaluated for most of the compounds under review. The number p of treatment plants considered in the analysis are shown in brackets after the name in the X-axis.. ... 78 Figure 2.22. RQ of the investigated compounds ... 89 Figure 3.1. Concentration of antibiotic resistance integrons and proportion of bacteria with antibiotic resistance integrons in hospital waste water in comparison to municipal waste water and river water( adapted from PILLS 2012)... 96
Figure 3.2. WWTP of Ferrara... 98 Figure 3.3. Risk quotients for analgesic/anti-inflammatories in Hospital B effluent and Ferrara WWTP influent and effluent ... 116 Figure 3.4. Risk quotients for antibiotics in Hospital B effluent and Ferrara WWTP influent and effluent. . 117 Figure 3.5. Risk quotients for other PhCs investigated in Hospital B effluent and Ferrara WWTP influent and effluent. ... 117 Figure 4.1. Location of the WWTPs and the receiving surface water canals sampled in the case studies. ... 129 Figure 4.2. Influent and effluent concentration of selected PhCs in WWTP B. ... 134 Figure 4.3. Average concentrations of pharmaceuticals detected in WWTP A effluent and its receiving water body, the canal A (case study A). ... 145 Figure 4.4. Average concentrations of pharmaceuticals detected in WWTP B effluent and its receiving water body, the canal B (case study B). ... 145 Figure 4.5. Average mass loads for the nine therapeutic classes based on occurrence of the selected
pharmaceuticals. ... 147 Figure 5.1. Comparison of predicted and measured concentrations of the selected compounds at the three sampling points by means of the ratio PEC/MEC. In the third axis of the graph: inf = WWTP influent, eff = WWTP effluent, sw= receiving surface water. ... 163 Figure 6.1. Expected range of Risk posed by PhCs in HWWs...184 Figure 6.2. Expected environmental range of risk in surface water posed PhCs originated from HWWs in different catchments area. ... 185 Figure 6.3. Risk patterns posed by diclofenac in the influent of WWTP. case study 1 (Low bed density), case study 2 ( medium bed density), case study 3 (high bed density). ... 187
IX AOP Advanced Oxidation Process
AOX Adsorbable Organic Halogen °C Degrees centigrade
C Carbon
CAS Conventional Activated sludge CF Conversion Factor
Ch Concentration of Pharmaceuticals in Hospital Wastewater
CIS Common Implementation Strategy
Cu Concentration of Pharmaceuticals in Urban Wastewater
d Day
DDD Defined Daily Dose
Dfe Dilution Factor, due to the discharge of WWTP into the receiving water body
Dfu Dilution Factor, due to the discharge of hospital effluent in the sewer system
EC European Comunity
EIAs Environmental Impact Assessment
EMEA European Agency for the Evaluation of Medicinal Products EQSs Environmental Quality Standards
ERA Environmental Risk Assessment
ERQ Environmental risk posed by pharmaceuticals originated from hospital wastewater EU European Union
F/M Food to Microorganism ratio
FDA United .States Food and Drug Administration GWD Ground Water Directive
GWRC Global Water Research Coalition
h Hour
HLB Hydrophilic-lipophilic-balanced (reversed-phase sorbent) HPLC High-Performance Liquid Chromatography
HRQ Risk Quotient posed by Pharmaceuticals in hospital wastewater HRT Hydraulic Retention Time
HWWs Hospital WasteWaters
Ic Wastewater treatment plant influent concentration of Pharmaceutical under investigation Inh. Inhabitants
IRQ Wastewater treatment plant Influent Risk quotient posed by Pharmaceuticals under investigation ISTAT Istituto Nazionale di Statistica
Kbiol Reaction Rate Constant
Kd solid-water distribution coefficient
X
LOD Limit Of Detection Log Kow Octanol Water Coefficient
LOQ Limit Of Quantification MBR Membrane Bioreactor
MCDA Multiple - Criteria Decision Analysis MDD Maximum Daily Dose
mg Milligram MS Mass Spectrometry MW Molecular Weight N Nitrogen ng Nanogram NI Negative Ion
NSAIDs NonSteroidal Anti-Inflammatory Drugs OsMed Osservatorio sull’impiego dei Medicinali
OSPAR Oslo/Paris convention (for the Protection of the Marine Environment of the North-East Atlantic) OTC Over The Counter
P Phosphorus
PBT Persistence, Bioaccumulation and Toxic properties PE Person Equivalent
PEC Predicted Environmental Concentration pH Power of Hydrogen
PhCs Pharmaceutical Compounds
PILLS Pharmaceutical Input and Elimination From Local Sources Pka Dissociation Constant
PNEC Predicted No Effect Concentration PPS Pharmaceutical Products
QqLIT Quadrupole-Linear Ion Trap
R Percentage removal rate of pharmaceutical compound in WWTP RQ Risk Quotient
RSD Relative Standard Deviation SD Standard Deviation
SRM Selected Reaction Monitoring SRT Sludge retention Time STP Sewage Treatment Plant STWs Sewage Treatment Works Sw Surface Water
t1/2 Half life time µg Microgram
XI U.S. EPA United states Environmental Protection Agency
UK United kingdom UWWs Urban WasteWaters
V Volume
VMPs Veterinary Medicinal Products WFD Water Framework Directive WHO World Health Organization WW WasteWater
1
3
1.1 The Scientific interest towards Pharmaceutical compounds as emerging contaminants
Pharmaceutical compounds (PhCs) have been characterized as “new” or “emerging” contaminants in the environment. However, PhCs have been around for several decades now. To that effect, a more accurate characterization is the fact that our attention to their presence in the environment is new or just emerging ( Jjemba 2008).
Interest in their presence in the environment is directly or indirectly stimulated by the fact that they are produced in increasingly large quantities and the improvements in detection methods, in fact enhanced sensitivity of analytical chemistry methods has enabled the detection of low-levels of pharmaceuticals in the environment, resulting in questions about the safety of the ecosystem and surface waters used for drinking supplies. Furthermore, their use and diversity is also steadily increasing every year. In addition, the continually ageing population and improving quality of life worldwide mean that their consumption is set to increase in future years (Van der Aa et al., 2011), recent investigations document that PhCs production and administration may vary both between countries and over time (Goossens et al., 2007, Kümmerer, 2009a), fluctuating not only on an annual basis, but also from one year to the next (Alexy et al., 2006). In recent years, PhCs have provoked increasing concern, particularly as no legal requirements have been set for discharge into surface water bodies of these ubiquitous, persistent and biologically active substances (Furhacker, 2008; Salgot et al., 2006; Ternes et al., 2007). Hence, over the last ten to fifteen years, PhC concentrations in raw and treated urban wastewater (WW) have been extensively monitored. Nevertheless, this is still a largely unregulated area, and there is ongoing debate within the scientific community regarding which PhCs to include among the priority substances (Bottoni et al. 2010). According to the new European draft annex (EC 2012), the anti-inflammatory diclofenac and the hormones 17β-estradiol and 17α-ethinylestradiol are prime candidates to be added to the European Priority List, while according to the U.S. EPA, erythromycin, nitroglycerin, and 9 hormones (17α -ethinylestradiol, 17α-estradiol, 17β-estradiol, equilenin, equilin, estriol, estrone, mestranol and norethindrone), need to be considered a priority (Richardson and Ternes 2011).
Once administered, these compounds are only partially metabolized by the human body, and therefore enter the water cycle either as parent (unchanged) compounds, which
4
are excreted largely through urine (generally 55-80 % of the total, with few exceptions) and partially in the feces, or as a mixture of metabolites and/or conjugated compounds (Jjemba et al., 2006, Lienert et al., 2007).
Municipal wastewater treatment plants (WWTPs) were not designed to remove trace organic contaminants, and as a results PhCs found their way into the environment through the discharge of treated WWs (Bendz et al., 2005; Castiglioni et al., 2006; Glassmeyer et al., 2005; Gomez et al., 2007; Joss et al., 2005; Verlicchi et al., 2012b), and as a result, their occurrence in surface water has been documented by a number of authors (Ashton et al., 2004; Calamari et al., 2003; Fatta-Kassinos et al., 2011; Gros et al., 2006, Kolpin et al., 2002, 2004; Spongberg et al., 2011) from around the world.
While the presence of pharmaceuticals in the environment is established, sources of these compounds in the environment, the pathways by which they reach sensitive receptors and their effects on these receptors are less characterized, moreover the latter must be determined before the effectiveness of risk mitigation measures can be assessed. Hospital wastewater (HWWs) represent an important source of PhCs ( Le Corre et al. 2012, Jean et al. 2012), but has only recently been investigated, and in a far fewer number of studies. Not only high analysis costs, but also the difficulties in organizing water-sampling campaigns inside health facilities have delayed these investigations. Nonetheless, according to the recent literature (Verlicchi et al. 2010a,b; Ort et al. 2010a) HWWs may be considered a hot spot in terms of PhC load generated, prompting the scientific community to question the acceptability of the general practice of discharging HWWs into public sewers ( Verlicchi et al. 2010 b), where they are conveyed to municipal WWTPs and co-treated with UWWs (Verlicchi et al. 2010 a,b; Pauwels and Verstraete 2006; Kummerer and Helmers 2000).
Through the evaluation of a compound’s risk quotient (RQ), that is the ratio between its measured or predicted concentration and its predicted no-effect concentration (PNEC), Escher et. al. (2011) found that the presence of PhCs in raw HWWs, UWWs pose a risk for the environment, and this risk remains high in the WWTP effluent. However, once the effluent is discharged into the receiving water body, its dilution with surface water can mitigate the effect of residual PhCs and the associated risk quotient may decrease ( Gros et al. 2010).
5
1.2 Aim and Objectives
The general aims of this thesis were to characterized the sources and pathways of PhCs in the environment, to monitor the occurrence, to assess the removal and fate of selected PhCs in WWTPs and in the water environment, and to carry out environmental risk analysis based on their occurrence as a basis to prioritize the hazardous compounds and to manage the risk posed by their exposure. In particular, this work focused on HWWs in order to assess their potential as a point source of 73 PhCs and their role in spreading these compounds into the environment, and consequently the impact of WWTPs on the receiving water bodies. The last aim was to develop a tool to estimate the level of environmental risk posed by PhCs originated from HWWs at site specific catchment area to aid the authorities and decision makers in the management of HWWs and the reducing of PhCs discharged into the environment. To achieve these aims the following objectives were set:
Objective 1: To review of the current knowledge on the sources, pathways, fate, and
behaviour of PhCs in WWTPs from the literature (Chapter 2).
In this Chapter, an in-depth literature review has been carried out, collating data pertaining to 264 WWTPs from various global locations, mostly in Europe. The data pertaining to a wide spectrum of PhCs, 118 compounds belonging to 17 different classes distinguished by their function or biological activity, were considered: 23 analgesics/anti-inflammatories, 36 antibiotics, 1 antidiabetic, 1 antifungal, 3 antihypertensives, 1 barbiturate, 12 beta-blockers, 2 diuretics, 9 lipid regulators, 10 psychiatric drugs, 6 receptor antagonists, 4 hormones, 4 beta-agonists, 3 antineoplastics, 1 topical product, 1 antiseptic and 1 contrast agent.
Objective 2: To assess the occurrence of selected PhCs in HWWs and to evaluate their
potential as point sourc of PhCs to the total load in the Influent of WWTP (Chapter 3).
In this chapter, an experimental investigation has been conducted in the area of Ferrara, Italy. Sixteen water samples were withdrawal from the effluents of two different sized hospitals and the influent and effluent of the receiving municipal treatment plant of one of the examined hospitals. The aim was to investigate 73 selected pharmaceuticals, belonging
6
to twelve different classes, comparing their occurrence in the effluent directly exiting the hospital with that, mixed with the local urban effluent, at the points of its entry and exit from the treatment plant. PhCs were selected due to their high prescription rates or volumes, the availability of a reliable analysis methods, as well as due to their occurrence and ubiquity in the aquatic environment
Objective 3: To assess the removal and release of 27 selected PhCs in full-scale WWTPs
and their impacts on the receiving water bodies (Chapter 4).
An investigation on the occurrence of 27 PhCs, belonging to different classes has been carried out. Twenty one water samples were withdrawal from the influent, effluent of two full-scale WWTPs and their receiving water bodies in the sensitive area of the Po Valley (northern Italy). The receiving water bodies were monitored upstream and downstream of the effluent discharge points in order to evaluate the effluent impact on the quality of surface waters, commonly used for irrigation.
Objective 4: To determine the relative accuracy of the prediction models, and the
limitations of on-site monitoring campaigns, that regard the occurrence of PhCs in the influent, effluent of a large municipal WWTP and downstream of its discharge point in the receiving water body, and their effect on the estimation of the environmental risk. (Chapter 5).
Objective 5: To estimate the potential impact of HWWs on the environment, and to assess
the relative importance of PhCs pathways (HWWS, UWWs) for the priority candidate diclofenac as a case study for individual WWTP. (Chapter 6).
Scientific researches that study the occurrence of pharmaceuticals in the environment are hindered by many challenges, chemical analysis and sampling protocol represent the most important and they are a key part in the process of gathering environmental data (Ort et al. 2010b). These two factors are time and monetary consuming,
7 indeed they required an adequate quality assurance and control protocols. For these reasons and in order to maximize the value of measured data for the experimental investigations, chemical analysis of investigated PhCs in the different withdrawal water samples (HWWs, raw UWWs, treated WWs and surface water) in this work are done thanks to the collaboration with the Department of Environmental Chemistry, Institute of Environmental Assessment and Water Research (IDAEA), Spanish Council for Scientific Research (CSIC), Barcelona, Spain. Moreover, This work is conducted in parallel with the European project “PILLS” (www.pills-project.eu), that part of its aims were the aims investigated in this Ph.D thesis, and during the years of this work, our results and knowledge have been discussed.
The results obtained from this research have been presented at international conferences, workshops, as well as in book chapters (see Appendix D). Moreover , three scientific papers are published in international journals as following:
1. Verlicchi P, Al Aukidy M, Zambello E. Occurrence of Pharmaceutical Compounds in Urban Wastewater: Removal, Mass Load and Environmental Risk after a Secondary Treatment – A Review. Science of the Total Environment 429 (2012) 123– 155.
2. Verlicchi P., Al Aukidy M., Galletti A., Petrovic M., Barceló D.. Hospital Effluent: Investigation of the Concentrations and Distribution of Pharmaceuticals and Environmental Risk Assessment. Science of the Total Environment 430 (2012) 109– 118.
3. Al Aukidy M., Verlicchi P., Jelic A., Petrovic M., Barcelo D. Monitoring release of pharmaceutical compounds: Occurrence and environmental risk assessment of two WWTP effluents and their receiving bodies in the Po Valley, Italy. Science of the Total Environment 438 (2012) 15 – 25.
9
11
2.1 Introduction
The problem of PhCs in the Environment, is not a new issue (there has much work in this area since the 1990s, and a lot of information is available in the scientific literature) but recently it has become a priority concern, particularly for politicians and the general public. PhCs have been found in various environmental compartments (waters, soils, sediments) and have been suspected of having an affect on the integrity of the aquatic ecosystems ( Kummerer, 2008 ).
Pharmaceuticals are classified according to their purpose (e.g., antibiotics, analgesics, anti-neoplastics, anti-inflammatory substances, antihistamines, X-ray contrast media, etc.). PhCs are complex molecules with different physicochemical and biological properties and functionalities. They are developed and used because of their more or less specific biological activity and are most notably characterized by their ionic nature. The molecular weights of the chemical molecules range typically from 200 to 1000 Dalton. This chapter gives an introduction to the PhCs properties, consumption, toxicity, sources and pathways through a full litereature review that deals also with their occurrence, removal, fate and factors effecting their removal in WWTPs, and finaly the total discharged load of PhCs from WWTP and an evaluation of their risk posed to the envieonment is presented.
2.2 Physico-chemical properties of pharmaceutical compounds (PhCs)
Once a PhCs is discharged into wastewater, it will be distributed between the different environmental compartments (e.g. surface water, soil, sediment) according to its physico-chemical properties, including the solubility, volatility, acidity, lipophilicity and sorption potential. Moreover, its persistence will depend on its resistance to be degraded biologically or abiotically. Appendix A.1. shows the physico-chemical characteristics and biodegradability of selected PhCs.
2.2.1 Volatility
Volatility is the tendency of a compound to volatilize, that is to leave the liquid phase and enter into the gas phase. It is strictly correlated to Henry coefficient. Ternes and Joss (2006) observed that a significant amount of a compound will be stripped in a bioreactor with fine bubble aeration if Henry constant > 0.003. Therefore, since most of
12
PhCs has low henry constant (Appendix A.1.), it can be concluded that stripping process is in general not relevant for the removal of pharmaceuticals during WWTPs.
2.2.2 Acidity
Acidity (i.e. dissociation constant pKa) describes the degree of ionization of the
compound at a known pH. The pH of relevance in the environment ranges between 4 and 8, with activated sludge typically presenting a pH in the range of 7 – 8 (Christofi et al., 2003). The pKa values that are less than 7 indicate that the compound is negatively charged
under acidic conditions and vice versa. Most PhCs are acids or bases with pKa values of 2
– 12. Weakly acidic pharmaceuticals such as the nonsteroidal anti-inflammatory drugs (NSAIDs) (i.e., naproxen, ibuprofen, and acetysalicylic acid) with pKa values of 4.2, 5.2,
and 3.5 as well as clofibric acid ( pKa = 2.95) have a low tendency to adsorb onto sludge.
2.2.3 Lipophilicity
Lipophilicity (Hydrophobicity) is related to the physical property of a compound to be repelled from a mass of water. Different coefficients were used to evaluate the tendency of a substance to stay in the water phase. The most common parameters are the octanol-water partition coefficient (Kow) and the octanol-water distribution coefficient (Dow). In the
past, Kow was generally used for evaluating and predicting pharmaceutical behavior in
aquatic compartment by considering that high Kow values are characteristics of
hydrophobic substances, poor hydrosolubility and in some case of a high potential to sorb on organic material of sludge (Rogers, 1996).
As known, PhCs are complex molecules, multifunctional organic compounds in some cases ionized in the aquatic environment: the un-ionized species will be the predominant species to partition into octanol from water, the ionized species predominantly remaining in the aqueous compartment. The pH at which measurements are made for evaluating Kow is a crucial parameter. For these reason, recently Cunnigham
(2008) reported that Kow does not properly describe environmental partitioning and
dynamic in the environment of polar and ionizable compounds such as PhCs and for them the coefficient Dow is more adequate as it is pKa dependent at the pH of the environment.
13
2.2.4 Sorption Potential
The sorption potential of a given compound is indicated by the solid-water distribution coefficient (Kd), which combines two driving forces for sorption: acidity and
lipophilicity. Ternes and Joss (2006) indicated that only compounds having Kd values
higher than 500 L kg−1 will be sorbed significantly onto sludge during primary and secondary treatment. In the case of sludge treatment, Carballa et al. (2007) showed that the limit of relevance below which sorption can be neglected is around Kd < l L kg−1, since the
sorbed amount is not only dependent on the distribution coefficient but also on the concentration of solids.
2.3 Pharmaceutical consumption
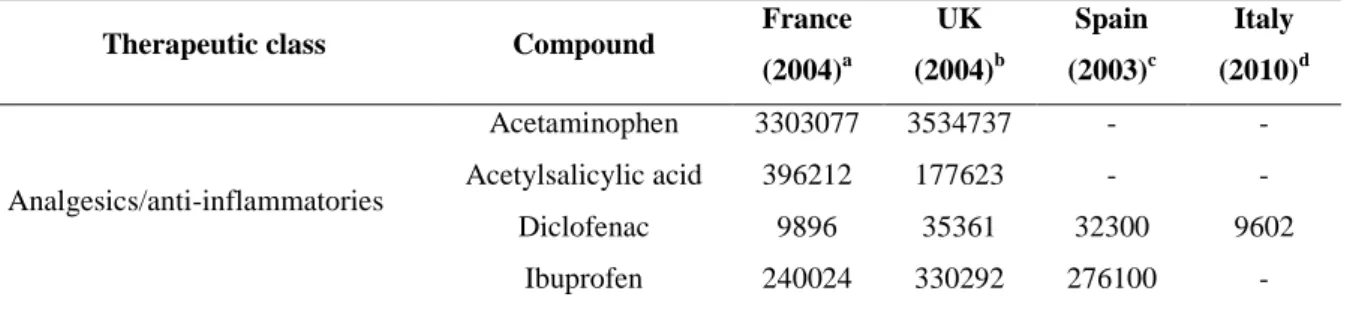
Large amounts of pharmaceuticals, representing a wide spectrum of therapeutic classes, are used and prescribed in human medicine world wide (Dìaz-Cruz and Barcelo 2004). In most cases, only a rough estimation of pharmaceutical consumption is available, because they are often sold as over-the-counter drugs (Dìaz-Cruz and Barcelo 2004; Stackelberg et al. 2004). A rough estimation of the global consumption of human PhCs showed that about 100 000 tons of PhCs are used each year, which corresponds to a worldwide average consumption of 15 g/pro capite year (Kummerer 2004). More detailed analyses about PhC consumption for area, country are available in terms of sales (WHO, 2004) of the specific therapeutic classes, but these data are not useful to evaluate the mass flow of PhCs consumed in a specific area and time. Usage data for active compounds sold in four different European countries are summarised in Table 2.1. These data indicate that, in general, the analgesic acetaminophen and the analgesic and anti-inflammatory drugs acetylsalicylic acid and ibuprofen are the pharmaceuticals sold in highest quantities, followed by the antibiotics, and the antiepileptic carbamazepine.
Table 2.1. Volume of pharmaceutically active compounds sold in different countries (kg/yr)
Therapeutic class Compound France
(2004)a UK (2004)b Spain (2003)c Italy (2010)d Analgesics/anti-inflammatories Acetaminophen 3303077 3534737 - - Acetylsalicylic acid 396212 177623 - - Diclofenac 9896 35361 32300 9602 Ibuprofen 240024 330292 276100 -
14
Therapeutic class Compound France
(2004)a UK (2004)b Spain (2003)c Italy (2010)d Naproxen 37332 33580 42600 - Antibiotics Azithromycin 4073 756 - 13870 Clarithromycin 15105 8807 - 64470 Erythromycin - 48654 8100 - Penicillin V - 32472 - - Amoxicillin 333223 149764 - - Sulfamethoxazole 16730 3113 12700 - Sulfadiazine - 362 - - Ciprofloxacin 12186 16445 - 21672 Tetracycline - 2101 - - Trimethoprim 3346 11184 3700 13896 Beta-blockers Acebutolo - 943 - - Atenolol 18337 49547 - 18084 Metoprolol 8786 3907 2300 - Propranolol 12487 9986 - - Hormones Progesterone - 751 - - Testosterone - - - - Lipid regulators Gemfibrozil - 1418 - - Fenofibrate 85670 2815 - - Atorvastatin 7924 - - 7682 Simvastatin 6943 14596 - - Lovastatin - - - - Psychiatric drugs Fluoxetine 3740 4826 4200 - Paroxetine 5515 2663 - - Citalopram 3487 4799 1600 - Carbamazepine 33514 52245 20000 31190
Contrast media Iopromide - - 20000 -
Data from: aBesse et al. (2007), b Environment Agency (2008), C Carballa et al. (2008), d Al Aukidy et al. (2012)
2.4 Toxicity of PhCs
The most important issue of concern about the presence of pharmaceuticals in the aquatic environment and the main reason why they are of interest for inclusion in monitoring programs as environmental contaminants is the ecotoxicological effects that they may cause. Even today, little is known about this subject. Some studies, however, have reported that some compounds, such as diclofenac (anti-inflammatory), propranolol (β-blocker), and fluoxetine (antidepressant), show chronic lowest-observed-effect
15 concentrations for fish toxicity, zooplankton, and benthic organisms in the range of WWTP effluent concentrations (Fent et al.2006). This indicates that for some compounds, the margin of safety is narrow and that chronic effects at highly contaminated sites cannot be completely ruled out, particularly when combined effects of pharmaceutical mixtures are taken into account (Fent et al.2006). Nevertheless, dilution in receiving waters results in lower levels, enabling the reduction of environmental risks.
It is impossible to rule out acute effects entirely without further testing since certain species may be particularly susceptible to certain class of drugs. Pharmaceuticals are created with the intent of causing a biological effect, they often have similar types of physiochemical behavior that are characteristic of harmful xenobiotics (e.g. they are able to pass membranes, and they are relatively persistent in order to avoid being inactivated before having their therapeutic effect). In non-target aquatic life many pharmaceuticals act as baseline toxicants. However, some exhibit the therapeutic effect also in aquatic life as the unwanted estrogenic effects on fish ( Kidd et al., 2007). Others act via a different specific mode of toxic action, as evidenced for fluoxetine effects on algae ( Neuwoehner et al., 2009). It is generally accepted that mixtures with components exhibiting the same mode of action act according to the model of concentration addition. In wastewater pharmaceuticals are present as mixture with varying modes of toxic action, and their toxicity was found at concentrations at which the single compound showed no or only little effects. Thus it could be assumed that the toxicity of a very complex mixture is governed by the underlying baseline toxicity, not the specific mode of toxic action of single components ( Escher et a.2011).
Pomati et al. (2006, 2008) investigated the effects and interactionsof a mixture of commonly used pharmaceuticals, including carbamazepine, ibuprofen and sulfamethoxazole at low concentrations, designed to mimic those found in the environment using in vitro tests on human and zebrafish cells. They concluded that a mixture of drugs at ng/L levels can inhibit cell proliferation by affecting their physiology and morphology and that waterborne pharmaceuticals may have an effect on aquatic life. Synergy remains an important topic with the complex mixtures of trace organic compounds being released to the environment ( Stuart et al. 2012).
16
2.5 Legislation on PhCs in the aquatic environment
From a legislation point of view, it is quite important to note that the Directives concerning the protection of aquatic environments and related organisms are the Water Framework Directive 2000/60/EC (WFD), the daughter Directice 2006/118/EC (GWD) for the protection of groundwater and the daughter Directive 2008/105/EC (PSD) stating the List of Priority Substances (also known as Annex X to WFD) for surface waters and related Environmental Quality Standards (EQSs). Pharmaceuticals are not included among those compounds to be monitored, outwithstanding their occurrence have been documented since more than 20 years in many European countries. The revision of the list of compounds and the subsequent definition of pertinent new EQSs are based on significant risks to or via aquatic environment in compliance with Art. 16 of the WFD.
Bottoni et al. (2010) report that a simplified and pragmatic methodology was developed under the WFD Common Implementation Strategy (CIS), taking into consideration both monitoring data and modelling data. According to these Authors, possible priority pharmaceuticals could be antineoplastics (including tamoxifen and cyclophosphamide), synthetic estrogens and hormones. The inclusion of target PhCs in the EU List of Priority Substances implies the definition of their corresponding EQSs and the necessity to subject to monitoring ambient water, sediment and biota in the different EU countries. In addition further attempts to define prioritisation lists have been made by other Commissions. For instance that by Oslo and Paris Commission (OSPAR) including mainly antibiotics, psychiatric drugs, receptor antagonists, that by Global Water Research Coalition (GWRC 2008) that defined a high priority level for a group of substances belonging to different classes: carbamazepine, sulfamethoxazole, diclofenac, ibuprofen, naproxen, bezafibrate, atenolol, ciprofloxacin, erythromycin and gemfibrozil. National prioritisation procedures have also taken place and prioritised PhCs based on the potential risk that they are perceived to pose to aquatic environment. In the United Kingdom, 12 compounds were prioritised for targeted monitoring based upon their predicted environmental concentrations, predicted no effect concentration (PNECs), and persistence, bioaccumulation and toxic (PBT) properties: mainly analgesics, antidepressants, antibiotics,antineoplastics (Ashton et al., 2004). In the United States the contaminants candidate to be included into the priority lists are the antibiotic erythromycin and the estrogens ethinylestradiol, estradiol, equilenin, estriol, estrone, mestranol and norethindrone (Richardson and Ternes, 2011). All these attemps provide a good start in focusing efforts, but they should be considered with caution as they are based on acute,
17 principally lethal, ecotoxicological test data and may therefore not include those substances taht may be exerting effects following chronic exposure. Occurrence data have to be used not only to confirm the presence of a compound in the aquatic environment, but it is used in combination with relevant ecotoxicol test data to allow the refinement of risk assessments.
2.6 Environmental risk assessment of PhCs.
The European Union Directive 92/18/EEC introduced for the first time, the requirement for an environmental risk assessment, as a prerequisite to obtain marketing authorization for veterinary pharmaceuticals. For this purpose, the European Agency for the Evaluation of Medicinal Products (EMEA) published a “Note for Guidance” (EMEA 1998) where guidelines to assess the environmental risk of veterinary medicinal products are established. The European Commission extended its concerns to pharmaceuticals for human use by publishing Directive 2001/83/EC which was subsequently amended by Directive 2004/27/EC (EudraLex 2009). These directives established that marketing authorization for new medical products for human use should be accompanied by an environmental risk assessment, whose guidelines were set out by (EMEA,2006). Nevertheless, the environmental impact does not provide sufficient grounds for a refusal. Environmental risk assessment of both veterinary and human pharmaceuticals is assessed in a stepwise approach, divided into two phases. In Phase I, environmental exposure to the pharmaceutical or its metabolites is estimated. Phase II comprises its fate and effects in the environment. For this reason, Phase II is sub-divided into two parts: Tier A, in which possible fate and effects of the pharmaceutical and/or its major metabolites are evaluated; and Tier B, which focuses on the effects on fauna and flora within environmental compartments that are likely to be affected (EMEA 1998,2006). However, medicinal products for human use only require Phase II studies if the predicted environmental concentration in surface water is equal to or above 0.01 µgL−1 (EMEA 2006). In the US, issues concerning pharmaceuticals in the environment are regulated by the U.S. Food and Drug Administration (FDA). This institution requires environmental assessments to obtain marketing authorisations which are specified in the “Guidance for Industry-Environmental Assessment of Human Drug and Biologic Applications” (FDA 1998). However, an environmental assessment is required only if the estimated environmental concentration of the pharmaceutical at the point of the entry is above 1 µgL−1 (FDA 1998). As EMEA, the
18
FDA also requires environmental assessments for veterinary medicinal products, using a tiered approach. With a view to harmonising the guidelines that govern these environmental impact assessments, the EU, US and Japan elaborated two guidelines: “Environmental Impact Assessment (EIAs) for Veterinary Medicinal Products (VMPs)-Phase I” (EMEA 2000) and “Environmental Impact Assessment for Veterinary Medicinal Products-Phase II Guidance” (EMEA 2005) so that environmental fate and toxicity data obtained could be used to obtain marketing authorisation in all these regions.
In synthesis, the basic principle of Environmental Risk Assessment (ERA) is the comparison of a predicted or measured environmental concentration (PEC or MEC) of a substance with a predicted, no effect concentration (PNEC), the concentration at which no effects on environmental organisms are expected to occur. If the PEC or MEC of a substance is higher than or equal to the PNEC, i.e. the risk characterisation ratio is ≥ 1, and thus an unacceptable risk for the environment is indicated, either a refined ERA with improved data is conducted or a risk management with appropriate measures has to be realised. PECs are derived from model calculations, whereas MECs can be determined from monitoring studies. Preference should be given to adequately representative exposure data, the discrypancis between these two approches are discussed in Chapter 5.
2.7 Source and pathways of PhCs
The origins of aquatic pollution by PhCs are derived from diverse sources that can be divided into point sources which include municipal wastewater effluent from STWs, industrial effluent and leachates from waste disposal sites, and non point sources which may consist of agricultural run-off (Figure 2.1.). The principal sources of human pharmaceuticals that discharge into wastewater treatment facilities include hospitals, extended-care facilities, and private households, all of these sources also contribute via the disposal of unused medicines as trash. This occurs through the hospital sewage system for admitted patients and urban wastewaters. Pharmaceuticals applied in veterinary medicin, as growth promoters and for other purposes, are excreted by the animals, usually, it is assumed that emission from pharmaceutical manufacturing and production are low in Europe and north America (Kummerer 2010). Contaminants applied to the soil surface will migrate through the soil zone, the unsaturated zone and the saturated zone in the well established way. This may be the route for components of sewage sludge used as fertilizer.
19 The potential for organic contaminants present in sewage sludge to leach following application to agricultural land was highlighted by (Wilson et al. 1996, Montiero et al.2010).
Figure 2.1. Sources and pathways of pharmaceutical compounds.
Another important pathway is groundwater–surface water interaction. In many instances treated effluent from industrial premises and sewage works is discharged to surface water. This may then infiltrate to groundwater from losing reaches of rivers (Stuart et al., 2012).
2.8 Occurrence and fate of PhCs in wastewaters
Once administered, PhCs are metabolised to varying degrees, and their excreted metabolites and unaltered parent compounds can also undergo further modification due to biological, chemical and physical processes in both sewage treatment facilities and receiving water bodies (Deblonde et al., 2011; Fatta-Kassinos et al., 2011; Miège et al., 2009; Monteiro et al., 2010; Onesios et al., 2009). Municipal wastewater treatment plants (WWTPs) are generally not equipped to deal with complex pharmaceuticals, as they were
20
built and upgraded with the principal aim of removing easily or moderately biodegradable carbon, nitrogen and phosphorus compounds and microbiological organisms, which regularly arrive at the WWTP in concentrations to the order of mg L-1 and at least 106 MPN/100 mL, respectively. PhCs in raw wastewaters are generally in the range of 10-3 – 10-6 mg L-1, in addition, their chemical and physical properties, namely solubility, volatility, adsorbability, absorbability, biodegradability, polarity and stability, vary greatly (Le Minh et al., 2010; Ziylan and Ince, 2011), with obvious repercussions on their behaviour during the treatments and consequently their removal efficiencies.
Indeed, several PhCs have been found in river biota, some at high levels (Rimkus, 1999), thereby evidencing the risk that environmental concentrations of PhCs can be higher than their (PNECs) (Santos et al., 2007; Stuer-Lauridsen et al., 2000), especially in effluent-dominant rivers whose dilution capacity and self-purifying processes are insufficient to temper the risk to aquatic life (Kasprzyk-Horder et al., 2009).
Although much research has been conducted on this topic, studies have generally been limited to single treatment plants. Hence, in order to provide an overview of the findings, a full litereature review is set out, collating data pertaining to 264 WWTPs from various global locations, mostly in Europe. Reflecting the abundance of conventional activated sludge systems (CAS) among existing municipal WWTPs, 244 of them were considered in this study, the remaining 20 plants examined were membrane biological reactors (MBR), included for comparative purposes. Data pertaining to a wide spectrum of PhCs, 118 compounds belonging to 17 different classes distinguished by their function or biological activity, were considered: 23 analgesics/anti-inflammatories, 36 antibiotics, 1 antidiabetic, 1 antifungal, 3 antihypertensives, 1 barbiturate, 12 beta-blockers, 2 diuretics, 9 lipid regulators, 10 psychiatric drugs, 6 receptor antagonists, 4 hormones, 4 beta-agonists, 3 antineoplastics, 1 topical product, 1 antiseptic and 1 contrast agent.
Raw influent and secondary effluent concentrations for the 118 PhCs, and their removal efficiencies observed in CAS and MBRs were reported, the objective being to provide a snapshot of their occurrence and of the efficacy of suspended growth mass biological processes in their removal. Based on the collected data, the average daily mass load (mg/1000 inhabitants/ day) in the secondary effluent for the majority of the compounds under study has been evaluated, ranking them accordingly. The PhCs were then also ranked according to their environmental risk, using a quotient derived from the ratio between their measured concentrations in secondary effluents and their corresponding
21 PNEC. This strategy provides an overview of the situation, clearly identifying a group of compounds in need of more intensive monitoring further to safeguarding the environment.
Compounds are grouped according to their therapeutic class and presented in terms of their chemical formula and molecular weight; literature references are also provided for each (Table 2.2.). In addition, in the Appendix A.1., their main physical and chemical properties (protonation constant as pKa, octanol-water partition coefficient as Log Kow,
solubility Sw, sludge-water distribution coefficient as Log Kd, reaction rate constant kbiol,
molecular charge at pH 7) as well as their molecular structure are provided. The main features of the WWTPs investigated in each study and details of the corresponding experimental campaigns are compiled in Table 2.3. Through the last column of Table 2.2., it is possible to know the previous works investigating the substance under study and then, once known the cited work, through Table 2.3. to know the details of the experimental campaign and the characteristics of the WWTPs under consideration.
Based on the collected literature data, the variability ranges for the concentration of each examined compound in both raw urban influent has been defined (Figures 2.3.-2.8. and Appendix A.2.) and secondary effluent (Figures 2.9.-2.14. and Appendix A.3.), as well as for their corresponding removal efficiencies (Figures 2.16.-2.20. and Appendix A.4.). To complete the analysis of literature data, the percentage partitions, for some of the compounds under study, among biodegradation, sorption onto sludge and occurrence in the secondary effluent are provided (Table 2.4.) as well as removal efficiencies for the different selected PhCs with respect to the sludge retention time of the corresponding biological reactor (referring to CAS in Table 2.5. and MBR in Table 2.6.).
Subsequently, the average daily mass discharged from the secondary biological system was evaluated, where possible, for the examined compounds, and their corresponding risk quotients (average concentration/PNEC) in the secondary effluent (Figures 2.21. and 2.22.). As a whole, the results of these two analyses revealed the most critical compounds in terms of mass load and/or environmental risk.
2.8.1 Mostly Investigated PhCs
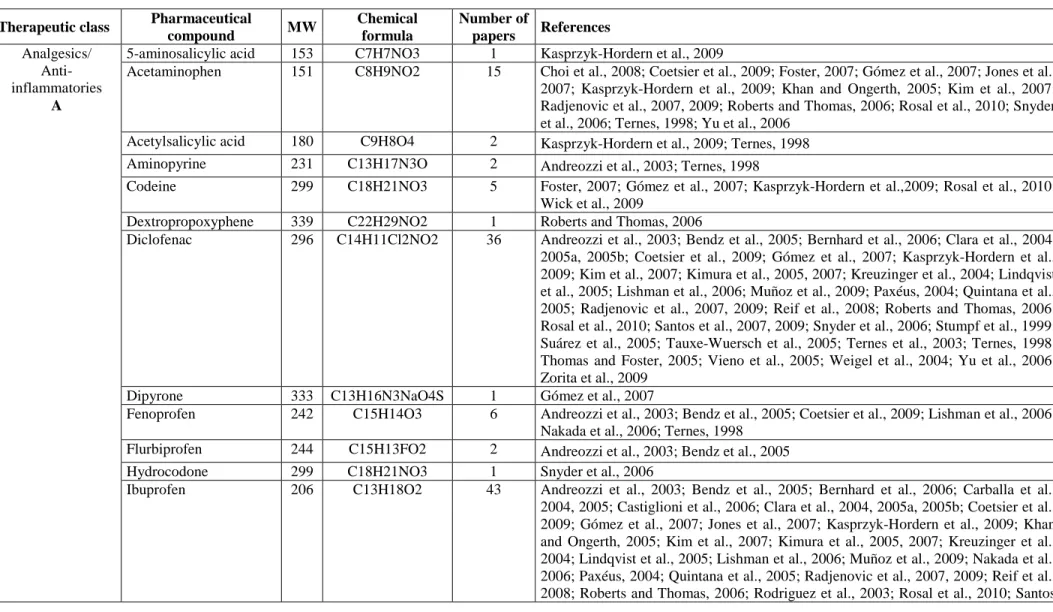
Table 2.2. reports the list of the investigated contaminants, grouped according to their therapeutic class, in addition to their molecular weight (MW) and chemical formula, together with the number and details of the references reviewed. The majority of the
22
compounds mentioned in the various studies are administrated orally, intramuscularly, endovenously or by inhalation, and in few cases on the skin.
An analysis of the data compiled in Appendix A.1., referring to selected PhCs evidences their very different molecular structures, also in terms of basic or acidic functional groups (charge at pH = 7). These, if found on the same molecule (e.g. ciprofloxacin), can cause it to be neutral, cationic, anionic or zwitterionic under different environmental conditions, (Kümmerer, 2009a; Ternes and Joss, 2006) resulting in (very) different behaviours during treatment processes as it will be discussed later.
2.8.2 Main features of the mostly investigated wastewater treatment plants (WWTPs)
Table 2.3. lists the main features of the WWTPs investigated in each study (second column), as well as the details of the experimental campaigns (sampling mode, number of samples, observation period, number of investigated PhCs). 244 CAS systems (242 full-scale and 2 pilot plants) and 20 MBRs (all pilot plants) situated in various world locations were included in this study: 68 % of the WWTPs are situated in European countries (Spain, Germany, Italy, Switzerland, Sweden, Austria, UK, Finland, France, Greece and Denmark), 14 % in the Americas (USA, Canada and Brazil), 14 % in Asia (China, Japan, South Korea and North Korea) and 4 % in Australia.
The raw wastewaters influent to these plants are generally subjected to preliminary treatments (bar screening and grit removal), then primary sedimentation followed by the secondary biomass growth treatment (CAS or MBR, the majority of the latter equipped with ultrafiltration or, in a few cases microfiltration, membranes). This final step usually included denitrification-nitrification and carbon removal processes, and in some cases simultaneous precipitation of phosphate by the addition of Fe salts. CAS operates at a HRT ranging from 2-24 h and at a SRT generally equal to 2-20 d with some exceptions, while MBR at a HRT of 7-15 h (with few exceptions) and at a SRT equal to 15-80 d (with a few exceptions). Figure 2.2. shows the historical development of the activated sludge process: from CAS for BOD removal to MBR and MBBR for enhancing the quality of the final effluent and upgrading the existing CAS maintaining the same footprint or reducing it.
23 Figure 2.2. Historical development of the activated sludge process: from CAS for BOD removal to MBR and MBBR for enhancing the quality of the final effluent and upgrading the existing CAS maintaining the same footprint or reducing it.
In general, chemical analysis of PhCs was performed on 24-h composite water samples, quite often flow-proportional, thereby avoiding the risk of under- or over-estimating the average daily concentrations in the wastewater. Experimental investigations were mainly based on a number of samples ranging between 3 and 12. Few studies collected multiple data sets for each sampling point. Water samples were generally taken in dry days in order to avoid dilution of the influent in case of combine sewage and due to parasite streams and dilution of the effluent caused by washout of the biological tanks.
BOD removal Phosphate precipitation Nitrification Nitrification Denitrification Enhanced biological P removal SRT = 8-12 d SRT = 10-15 d SRT = 14-20 d SRT = 2-4 d SRT > 20 d Enhanced quality of the effluent
Activated sludge tank Sec. clarifier
Influent Effluent
Waste sludge
Fe, Al Nitrification tank
Influent Sec. clarifier Effluent Waste sludge Nitrification Fe, Al Influent Denitrification Sec. clarifier Effluent Waste sludge
Anaerobic Anoxic Nitrification Sec. clarifier
Influent Effluent
Waste sludge
Anaerobic Anoxic Nitrification Membrane Tank
Influent Permeate Waste sludge SRT = 14-20 d A B C D E (MBR) F (MBBR) WWTP upgrading Anoxic Nitrification Sec. clarifier Influent Anaerobic grid Effluent Waste sludge carrier
24
Table 2.2. Pharmaceutical compounds examined, grouped according to their therapeutical class. For each substance, chemical formula and molecular weight (MW) are provided as well as number of papers and references dealing with it.
Therapeutic class Pharmaceutical
compound MW Chemical formula Number of papers References Analgesics/ Anti-inflammatories A
5-aminosalicylic acid 153 C7H7NO3 1 Kasprzyk-Hordern et al., 2009
Acetaminophen 151 C8H9NO2 15 Choi et al., 2008; Coetsier et al., 2009; Foster, 2007; Gómez et al., 2007; Jones et al., 2007; Kasprzyk-Hordern et al., 2009; Khan and Ongerth, 2005; Kim et al., 2007; Radjenovic et al., 2007, 2009; Roberts and Thomas, 2006; Rosal et al., 2010; Snyder et al., 2006; Ternes, 1998; Yu et al., 2006
Acetylsalicylic acid 180 C9H8O4 2 Kasprzyk-Hordern et al., 2009; Ternes, 1998 Aminopyrine 231 C13H17N3O 2 Andreozzi et al., 2003; Ternes, 1998
Codeine 299 C18H21NO3 5 Foster, 2007; Gómez et al., 2007; Kasprzyk-Hordern et al.,2009; Rosal et al., 2010; Wick et al., 2009
Dextropropoxyphene 339 C22H29NO2 1 Roberts and Thomas, 2006
Diclofenac 296 C14H11Cl2NO2 36 Andreozzi et al., 2003; Bendz et al., 2005; Bernhard et al., 2006; Clara et al., 2004, 2005a, 2005b; Coetsier et al., 2009; Gómez et al., 2007; Kasprzyk-Hordern et al., 2009; Kim et al., 2007; Kimura et al., 2005, 2007; Kreuzinger et al., 2004; Lindqvist et al., 2005; Lishman et al., 2006; Muñoz et al., 2009; Paxéus, 2004; Quintana et al., 2005; Radjenovic et al., 2007, 2009; Reif et al., 2008; Roberts and Thomas, 2006; Rosal et al., 2010; Santos et al., 2007, 2009; Snyder et al., 2006; Stumpf et al., 1999; Suárez et al., 2005; Tauxe-Wuersch et al., 2005; Ternes et al., 2003; Ternes, 1998; Thomas and Foster, 2005; Vieno et al., 2005; Weigel et al., 2004; Yu et al., 2006; Zorita et al., 2009
Dipyrone 333 C13H16N3NaO4S 1 Gómez et al., 2007
Fenoprofen 242 C15H14O3 6 Andreozzi et al., 2003; Bendz et al., 2005; Coetsier et al., 2009; Lishman et al., 2006; Nakada et al., 2006; Ternes, 1998
Flurbiprofen 244 C15H13FO2 2 Andreozzi et al., 2003; Bendz et al., 2005
Hydrocodone 299 C18H21NO3 1 Snyder et al., 2006
Ibuprofen 206 C13H18O2 43 Andreozzi et al., 2003; Bendz et al., 2005; Bernhard et al., 2006; Carballa et al., 2004, 2005; Castiglioni et al., 2006; Clara et al., 2004, 2005a, 2005b; Coetsier et al., 2009; Gómez et al., 2007; Jones et al., 2007; Kasprzyk-Hordern et al., 2009; Khan and Ongerth, 2005; Kim et al., 2007; Kimura et al., 2005, 2007; Kreuzinger et al., 2004; Lindqvist et al., 2005; Lishman et al., 2006; Muñoz et al., 2009; Nakada et al., 2006; Paxéus, 2004; Quintana et al., 2005; Radjenovic et al., 2007, 2009; Reif et al., 2008; Roberts and Thomas, 2006; Rodriguez et al., 2003; Rosal et al., 2010; Santos