BOARD COMPOSITION AND
FAMILY FIRMS’ PROFITABILITY.
DO GENERATIONAL STAGE AND
PERFORMANCE LEVEL MATTER?
Annalisa Sentuti
Carlo Bo University of Urbino, Italy
Gail Denisse Chamochumbi Diaz
Carlo Bo University of Urbino, Italy
Francesca Maria Cesaroni
Carlo Bo University of Urbino, Italy Received: June 10, 2020 Accepted: July 14, 2020 Online Published: July 27, 2020
Abstract
This article examines the relationship between board composition and family firms’ performance. Namely, by adopting the theoretical framework of socio-emotional wealth and analyzing a sample of Italian medium-sized family firms, we investigate how the presence of non-family directors affects their financial performance, considering the generational stage as a moderating variable. Findings suggest that a higher presence of non-family directors has a less positive effect on first-generation family firms than in later generations of family firms. Furthermore, by adopting a quantile regression, results show that this effect is more striking in low-performing family businesses than in high.
Keywords: Family Businesses; Board of directors; Firm performance; Non-family directors; Corporate governance; Generational stage; First-generation family firms; Quantile regression
1. Introduction
Family firms are the prevalent form of business organizations across the globe (Zellweger, 2017). These companies are characterized by a deep and broad involvement of family members in ownership, governance, and management across generations (Chua et al., 1999). Many scholars maintain that the extent to which the owner family can affect firms’ profitability mainly relies on the family’s involvement in governance systems and decision-making (Sciascia & Mazzola, 2008; Kellermanns et al., 2012), while its involvement in business ownership is considered less important (Sacristan-Navarro et al., 2011).
This fact raises questions about the most effective composition of governance systems in family firms. A crucial decision that owner families have to take, especially when the business grows and managing it becomes more complex, concerns the possible involvement of non-family directors (Sciascia et al., 2014). In fact, this decision implies that non-family members should share business controlling and decision-making with non-family directors. Bearing in mind that the board of directors is the main structure of corporate governance (Lane et al., 2006; Nordqvist et al. 2014), several scholars have examined how its composition may influence family firms’ profitability (Kowalewski et al., 2010; Mazzi, 2011; Mazzola et al., 2013; Minichilli et al., 2016; Mustapha et al., 2017; Calabrò et al., 2020; Fernàndez-Temprano & Tejerina-Gaite, 2020). To date, conflicting results have emerged. Indeed, prior research suggests that the presence of non-family directors can be beneficial (Anderson & Reeb, 2004; Voordeckers et al., 2007; Minichilli et al., 2009; Wright & Kellermanns, 2011; Basco & Voordeckers, 2015; Corbetta et al., 2017; Arzubiaga et al., 2018), detrimental (Lee, 2006), or neutral (Kowalewski et al., 2010; Mazzola et al., 2013; Minichilli et al., 2016) to family firms’ performance. Thus, how the involvement of non-family directors can affect family firms’ profitability is still unclear (Kowalewski et al., 2010; Mazzola et al., 2013; Minichilli et al., 2016; O’Boyle et al., 2012; Pintado & Requejo, 2015), and the research gap is still unfilled. This reality is especially true concerning non-listed small and medium-sized family firms (Arzubiaga et al., 2018; Garcia et al., 2019), as existing studies mostly consider big and listed companies. Moreover, many scholars compare family and non-family businesses and implicitly consider family firms a homogeneous group (Chua et al., 2012; Daspit et al., 2018), thus failing to capture the effects of their heterogeneity on financial performance.
To fill this gap, this study focuses on private medium-sized family firms and investigates the relationship between board composition and family firms’ performance. In carrying out such analysis, our starting point is that family businesses are not a homogeneous group. Apart from the different levels of family involvement in family firms’ governance and management (Nordqvist et al., 2014), one of the main sources of heterogeneity within family firms is the generational stage (Daspit et al., 2018). Family firms in different generational stages can show profound differences in business goals, strategic behaviors, decision-making processes, management style, openness, and trust towards outside managers and directors (Kellermanns & Eddleston, 2006; Gomez-Mejia et al., 2011; Cruz & Nordqvist, 2012; Sciascia et al., 2014; Arrondo-García et al., 2016; Garcia et al., 2019). Therefore, we believe that including family firms’ generational stage in the analysis allows us to go into greater depth in exploring the effect of family/non-family members’ involvement in family firms’ governance and its relationship with firms’ performance.
In our analyses, we have adopted the Socio-Emotional Wealth (SEW) perspective (Gomez-Mejia et al., 2007; Gomez-(Gomez-Mejia et al., 2010; Gomez-(Gomez-Mejia et al., 2011), assuming that the aim of preserving affective endowments changes over generations (Berrone et al., 2012). It is higher in first-generation family businesses (more oriented to non-financial goals) and lower in multigenerational family businesses (more interested in financial goals) (Sciascia et al., 2014). According to this perspective, we believe that the involvement of non-family directors on family business boards could produce different effects depending on whether the family firm is a first or subsequent generation. Notably, we posit that non-family directors' presence could have a lower benefit when the founder generation is in charge because of the existence of differences in terms of priorities and objectives between family and non-family members.
Moreover, we argue that the moderating effect of the generational stage on the relationship between non-family directors and financial performance may vary across financial performance levels (low or high). This occurs because when the family firm achieves high performance, the family owners perceive that the SEW preservation is ensured (Zellweger, 2017), so conflicts
with non-family directors are less likely to arise. Conversely, if the family firm experiences low performance, conflicts between family and non-family directors may arise, especially in first-generation family firms. On the contrary, these conflicts are less likely to occur in later-generation family firms, which are less oriented towards SEW and, therefore, more willing to take drastic decisions to protect financial performance, which is considered a priority. For that reason, we hypothesize that the influence of non-family directors can change not only with regard to the generational stage but also the distribution of family firms’ financial performance. We have tested our hypotheses on a sample of 219 Italian medium-sized family firms. Mid-sized companies have been widely neglected in research on family firms’ performance and board of directors. That is why our focus is on this important yet under-researched segment of companies. Our findings confirm that in first-generation family firms, the positive effect of non-family directors is more limited than in later generation family firms. Furthermore, by adopting a quantile regression, results show that this effect is more striking in low-performing family business than in high-performing ones.
This study makes four theoretical contributions. First, we show that the involvement of non-family directors is not a universal panacea for all family firms because these firms are not a homogeneous universe. Notably, the involvement of non-family directors is less effective in first-generation family firms and particularly in those with low performance. Second, our study underlines the importance of performance level as a factor that can deeply affect the relationships between non-family directors involvement and family firms’ financial performance. Third, we further knowledge about professionalization (Bassani & Cattaneo, 2020) and possible variables that can shape the success of this critical process for medium-sized family businesses. Finally, from a methodological perspective, this study confirms the usefulness of the quantile regression to evaluate the effects of non-family directors on firms’ performance further.
In the remainder of the article, we describe our theoretical framework, develop our hypotheses (Section 2), and present the research method, sample selection process, and the definition variables (Section 3). Then, we show our results and robustness tests (Section 4), ending with the discussion and conclusions (Section 5).
2. Theoretical framework and hypothesis development
The SEW perspective represents an all-encompassing approach that captures the “affective endowments” of family owners, including the family's desire to exercise their authority, the enjoyment of family influence, the maintenance of clan membership within the firm, the appointment of trusted family members to important roles, the retention of a strong family identity, and the continuation of the family dynasty (Gomez-Mejia et al., 2007; Berrone et al., 2012). From this perspective, the uniqueness of family firms is given by the importance attached to non-economic objectives (emotional and social needs of the family) in influencing family firms’ decision-making and strategic choices (Gomez-Mejia et al., 2011). The fundamental priority of a family business is to maintain family control over the company, acting conservatively, and avoid business decisions that may jeopardize business continuity, even if it means giving up higher performance (Gomez-Mejia et al., 2007).
Within the SEW perspective, the generational stage of family firms assumes a crucial role and is considered one of the most important sources of heterogeneity among family firms (Gomez-Mejia et al., 2007; Gomez-Mejia et al., 2010; Gomez-Mejia et al., 2011). Sentiments, emotions, and relationships within the family controlling a firm may vary from one firm to another and, within each firm, from one moment to another over time (Hoy & Sharma, 2010), as do the aims, values, and perceptions of the family owners (Westhead & Howorth, 2006).
Similarly, the need to preserve “affective endowments” in family businesses changes with the passing of generations (Berrone et al. 2012). Thus, not all generations in control have the same level of SEW and pursue the same goals in managing the business.
As affirmed by Arrondo-Garcìa et al. (2016), corporate decisions are contingent on the generation in control. Since first-generation family businesses present a stronger emotional attachment to the firm than multigenerational family businesses, the former are more oriented to non-financial goals and less interested in financial performance (Sciascia et al. 2014). First-generation leaders prioritize their firm’s survival so that they can pass it on to later First-generations (Arrondo-García et al., 2016). In fact, in first-generation firms, one of the most important non-financial aims is trans-generational sustainability, which has major implications for the decision-making process (Astrachan & Jaskiewicz, 2008; Zellweger et al., 2010). The founder generation tries to ensure the company’s stability as much as possible to ensure continuity (Breton-Miller & Miller, 2009). Control, influence, sense of dynasty, and emotional attachment have a stronger weight in the first generations, given these companies’ founder-centric orientation (Berrone et al., 2012).
In this vein, several scholars have claimed that conflicting findings from extant research on family/non-family members’ involvement in governance structure and a firm’s profitability can be explained by considering the generational stage of the business (Arosa et al., 2010; García-Ramos & García-Olalla, 2011; Chua et al., 2012; Sciascia et al., 2014; Maseda et al., 2015; Arrondo-Garcia et al., 2016; Blanco-Mazagatos et al., 2016; García-Ramos et al., 2017). The generational stage is also recognized as a key factor in influencing business performance (Cucculelli & Micucci, 2008; Garcia-Castro & Aguilera, 2014; Sciascia et al., 2014; García-Ramos et al., 2017; Miller et al., 2017).
According to these arguments, and in line with the SEW viewpoint, we posit that the generation in control can act as a moderator in the relationship between board composition and family firm’s financial performance. In fact, in first-generation family firms, the involvement of non-family directors may be in conflict with first-generation priorities, as the latter care more about preserving their SEW while non-family directors “might only focus on business performance without taking into consideration family objectives” (Gómez et al., 2016). In a first-generation family firm, the leader’s orientation towards non-financial goals (preserving SEW, even at the expense of financial performance) could be in contrast with non-family directors’ priorities, as the latter are less attached to the business and more oriented to maximizing financial goals (Breton-Miller & Miller, 2013).
Consequently, in a first-generation family firm, a stronger agreement on objectives and priorities is expected in a board of directors entirely or mainly composed of family members rather than in a board with a high presence of non-family directors. When family members mainly sit on the board, quicker and less conflicting decisions are expected, with a positive effect on the firm’s performance. Hence, in first-generation family firms, the positive effect of non-family directors diminishes because of potential conflicts, which may arise with family members and slow down the decision-making processes to the detriment of financial performance. On the other hand, when the business is managed by subsequent generations— typically less concerned about preserving SEW—conflicts between family and non-family directors are less likely, and greater harmony in the boardroom will benefit the company’s financial performance.
In light of these arguments, we assume that non-family directors’ presence interacts with the generational stage to influence family firm’s financial performance. Thus, we propose the following hypothesis:
Hp1. In first-generation family firms, the positive effect of non-family directors on business performance is limited than in later generations.
We believe, furthermore, that this effect could vary across business performance levels. Specifically, we argue that the relationship between board composition (e.g., presence of family/non-family directors) and family firms’ performance can change according to the firm’s performance level (poor performance or high performance). From a theoretical point of view, the SEW paradigm provides an effective explanation of why priorities, behaviors, and choices of owner families change according to the company’s level of performance. According to this paradigm, family businesses consider the preservation of “affective endowments” their priority, which has a substantial impact on strategic decision-making. However, Zellweger (2017) argues that family firms can alter their scale of priorities (financial vs. non-financial goals) depending on the circumstances the firm is facing (e.g., low or high performance). In other words, according to the degree of vulnerability perceived in terms of SEW, family members are more or less inclined to alter their attitudes and strategic decisions to protect the firm and safeguard their SEW.
In conditions of financial well-being—that is, when the company achieves high performance—family owners are less likely to modify their behavior and strategic decision making (i.e., it is more likely that the board of directors will not have to take drastic decisions that generate conflicts) because high performance guarantees not only the stability and survival of the firm but also the maintenance of their SEW.
Vice versa, in conditions of low performance, the preservation of “affective endowments” (Berrone et al. 2012) may be threatened, which then puts the survival of the firm at risk and hence the maintenance of the SEW. According to Berrone et al. (2012), poor performance poses a twofold threat: possible financial distress for the family, especially if family members have invested most of their money in one organization, and the risk of losing their SEW, if they have to sell or close the company. This vulnerability creates a strong sense of uncertainty and financial instability. Therefore, under this threat, the family members may change their priorities to restore the financial well-being of the firm and thereby preserve the SEW (Zellweger, 2017).
However, we argue that, especially in first-generation family firms, non-financial goals do not disappear, and family business owners may experience a great sense of pressure in simultaneously pursuing both financial performance recovery and SEW preservation. Dealing with poor performance can require radical and/or extreme decisions, and first-generation family directors (more oriented towards finding a balance between financial recovery and SEW preservation) might come into conflict with possible non-family directors (mainly oriented towards performance recovery). For instance, non-family directors may press to dismiss some employees to reduce costs and improve financial performance. Nevertheless, first-generation family directors may be less willing to do this as it could compromise the family firm’s relationship with employees and its corporate social responsibility, which are both crucial concerning the preservation of their SEW (Berrone et al., 2012).
The trade-off between the conflicting perspectives of family and non-family directors could slow down the decision-making processes and the strategic behavior of the business. Thus, the benefits stemming from the involvement of non-family directors in first-generation family firms may prove to be less significant in the case of low-performing firms than high-performing ones.
From a methodology point of view, the prior empirical literature has commonly studied the relationship between board composition and financial performance, by taking for granted that the effect of this relationship is always constant across the distribution outcomes. However,
some scholars (Arrondo-Garcia et al., 2016; Conyon & He, 2017) in governance studies made a call to analyze the differential effect that could take place at different levels of performance.
In this context, we have introduced the performance level to understand whether the influence of non-family members’ involvement in the board can change along with the distribution of family firm’s financial performance. In doing so, we agree with scholars who posit that the effects of specific governance features (e.g., the composition of a board of directors) on a firm’s performance can vary across the distribution of the outcome variable (Conyon & He, 2017).
This perspective implies that the effects of the board’s composition on a family firm’s performance should be analyzed, not only considering the generational stage (first generation or otherwise) but also the business’s level of performance. Thus, in contrast to what has been assumed in previous studies—where the effect of board composition is considered constant across the performance distribution—our hypothesis is as follows:
Hp2. The moderating effect of the generational stage on the relationship between non-family directors and financial performance varies across performance levels.
3. Research method: model, sample, data, and variables
3.1 Model
To test our Hp1, we have adopted the ordinary least squares (OLS) estimator. Specifically, we ran the following conditional mean regression model:
𝑌𝑖𝑡 = 𝛼 + 𝛽𝐺𝑖𝑡+ 𝛾𝑋𝑘,𝑖𝑡+ 𝜀𝑖𝑡 (Hp1)
Where Yit represents the dependent variable, in our case, financial firm performance in year t. The term G indicates our main independent variables of interest. Particularly, these are measured by the percentage of non-family members on the board, generation in control, and the interaction term between the previous two. Lastly, X is a set of control variables (all variables are defined below).
Results from OLS regression were further investigated using quantile regression. The rationale behind this choice is that OLS regression does not allow us to take into account that the relationship between board composition and family firms’ performance can change according to the firm’s performance level. In fact, OLS regression only predicts the average— conditional mean—relationship between an input variable X and outcome quantity Y. Therefore, in most analyses on this topic, the effect of board composition is considered constant across the distribution of performance.
Quantile regression can be applied to predict single parts of the distribution of an outcome variable, named quantiles (Koenker & Gilbert, 1978), and offers two main advantages. First, quantile estimates are less likely to be influenced by extreme data points. Second, as suggested by Conyon and He (2017), the effects of specific governance features (independent variable) can vary across the distribution of the outcome variable (dependent), and adopting a quantile regression allows for a more comprehensive picture of that relationship. Several scholars in governance studies have highlighted advantages stemming from the use of quantile regression (Arrondo-Garcia et al., 2016; Conyon & He, 2017) and have suggested using such a method to overcome the contradictory results obtained so far when adopting OLS regression (Arosa et al., 2016; Conyon & He, 2017). That is why we believe that adopting quantile regression can make
a significant contribution to further knowledge on the relationship between board composition and family firms’ performance.
In line with these arguments, we have used quantile regression to test our Hp2, arguing that the moderating effect of the generational stage can vary along with the distribution of financial performance. Namely, the Hp2 has been tested using the following quantile regression to estimate conditional quantile functions (Koenker & Gilbert, 1978):
𝑄𝜏= 𝛼𝜏+ 𝛽𝜏𝐺𝑖𝑡+ 𝛾𝜏𝑘𝑋𝑘,𝑖𝑡+ 𝜀𝑖𝑡 (Hp2)
Qτ represents the τth quantile regression function. In this study, we have estimated the 25th (Q25), median (Q50), and 75th (Q75) percentiles of the performance distribution. More specifically, firms with low performance are located in the first quantile (Q25), while high-performance firms are located in the last quantile (Q75). The interpretation of the results derived from the application of the quantile regression is similar to an OLS estimator. However, three different coefficients are obtained (Q25, median, Q75), which represent in detail the relationship between financial performance (dependent variable) and the covariates (independent variables).
3.2. Sample and data collection
Research on the relationship between board composition and family firms’ performance mainly focuses on large and listed firms (Bammens et al., 2011), even though the majority of family firms worldwide are small and medium-sized, unlisted companies. Only a few studies have analyzed small family businesses (Westhead & Howorth, 2006; Sciascia & Mazzola, 2008; Mazzola et al., 2013; Sciascia et al., 2014), while mid-sized companies are completely neglected. That is why this paper focuses on private and medium-sized family businesses. We aim to shed light on this important yet under-researched segment of companies. Indeed, medium-sized businesses represent a very important class of business, which has been playing an increasingly important role in many countries in the last decades, such as Italy (Ciambotti & Palazzi, 2015; Songini et al., 2015; Coltorti et al., 2017), because of their ability to contribute to innovation, employment, exports, and the growth of the Italian economy.
Moreover, medium-sized firms present some distinctive features that significantly differentiate them from large and publicly traded companies, such as lower use of management techniques and mechanisms, less professionalization, and less involvement of independent managers and directors. When it comes to board composition and its effect on firms’ performance, considering medium-sized family firms is particularly important as results from previous studies concerning the boards of large family businesses can hardly be extended to medium-sized family businesses. In fact, small family firms usually only include family members on the boards, but when the business grows and proceeds through its life cycle, managing the company becomes more complex, new and more qualified skills are required, and the involvement of non-family members becomes necessary. However, the presence of non-family directors is not always beneficial for the performance of family firms as a mix of family/non-family members on the board and in the management team is not always able to produce the desired effects (Lee, 2006; Daspit et al., 2018). It is, therefore, important to understand the conditions and variables that can favor or hinder the ability of non-family directors to contribute to the improvement of the performance of family businesses.
Our sample covers private medium-sized family firms located in Central Italy. Following the definition presented by the European Union Commission Recommendation in 2003, we have classified a firm as medium-sized when it has more than 50 employees but less than 250 and generates annual sales between 10 and 50 million euros. According to the definition of
Central Italy provided by the Italian Institute of Statistics (Istat), we have collected data from the Marche, Lazio, Tuscany, and Umbria regions. Central Italy is a particularly interesting area for analysis because of the significant presence of medium-sized family businesses (Mediobanca & Unioncamere, 2015).
Family businesses were identified considering companies in which a family holds a share of capital that allows it to control the company. Specifically, we have classified a firm as a family business when an individual or a family (two or more family members) hold more than 50% of equity (Minichilli et al., 2010; Naldi et al., 2013). Since there is no official database of Italian family businesses, we have adopted a manual procedure to classify companies as family or non-family businesses, conducting an in-depth review of the ownership structure of the selected firms. The kinship among shareholders was ascertained based on their surnames (Arosa et al., 2010; Corbetta et al. 2015). This procedure is widely shared and applied in the empirical research on family business and have been adopted, bearing in mind that it could lead to an underestimated sample. To minimize the measurement bias, in some cases, we also used information found in the media, company websites, etc.
The final data set is composed of 219 family firms. Data were collected in 2012, and two data sources merged: the AIDA database to extract the sample and collect financial information (ROA, Ebitda margin, etc.) and the reports from the Italian Chamber of Commerce to obtain information about the structure of the boards of directors and the ownership. STATA software was used for data analysis.
3.3. Definition of variables
To test our hypotheses, we have applied a financial performance measure as the dependent variable, namely, return on assets (ROA), expressed as earnings before interests and taxes divided by total assets. It has frequently been considered particularly suitable for analyzing firm profitability (Arrondo-Garcia et al., 2016; Minichilli et al., 2016; Sciascia et al., 2014). To robustness check, we have also considered the Ebitda margin, which is equal to earnings before interest, tax, depreciation, and amortization (Ebitda), divided by the overall turnover. This margin is a sound proxy indicator of the firm’s ability to generate cash flow through its core business (Granata & Chirico, 2010; Dolenc et al., 2012; Cesaroni et al., 2017).
This analysis checked the following independent variables: Non-family board, Generational stage, and interaction term: Non-family board x Gen stage. Non-family board measures the percentage of non-family members on the board of directors and is defined as the number of non-family directors vis-à-vis the total number of directors (Lee, 2006; Arosa et al., 2010; Mazzola et al., 2013; Sciascia et al., 2013). We have used a 25-year cut-off point to capture generational effects following prior family business research (Gersick et al., 1997; Arrondo-Garcia et al., 2016; Blanco-Mazagatos et al. 2016; Gottardo & Moisello, 2017). The generational stage has been codified as a dummy variable: code 1, first-generation family firms under 25 years old; 0, later generations family firms 25 years old or older. Although this proxy has been used in previous family business studies, we have discussed this as a limitation in the conclusions. To identify the moderating generational effect between non-family directors and financial performance, we have calculated the interaction between the generational stage and non-family board (Non-family board x Generational stage).
To guarantee a suitable model and take account of other possible reasons for the differing performance of family firms, a number of control variables have been analyzed on the basis of previous empirical research. We have considered the Family ownership variable by using the percentage of equity owned by the family since family involvement in ownership represents an important heterogeneous factor in family firms (Daspit et al., 2018), which may influence performance (Sciascia & Mazzola 2008; Sciascia et al., 2012; Sciascia et al., 2013; Arzubiaga
et al., 2018). We have also included the Past performance variable, calculated by using the revenues from the previous three years and coded in a multi-categorical variable: constant, increase, or decrease. The reason for including this variable is that, as widely recognized in literature, past performance can affect present financial performance (Cucculelli et al., 2016; Minichilli et al., 2016). Moreover, we have considered the Family CEO variable because, as extant studies have pointed out, the family CEOs may influence the firm’s behaviors (Umans et al., 2020) and performance (Corbetta & Salvato, 2004; Minichilli et al., 2016). The family nature of the CEOs has been determined by checking the surname with that of the controlling family and measured by a dummy variable, with a value of 1 if a family member leads the company, and 0 otherwise. Another governance-level factor that has been considered is the variable of women on the board, calculated as the ratio between the total number of women on the board of directors and the total number of directors. This factor takes into account the potential influence of women directors on financial performance (Minichilli et al., 2016; Poletti-Hughes & Briano-Turrent, 2019; Samara et al., 2019; Terjesen et al., 2009).
Finally, we checked for other, more traditional drivers of business performance commonly used in empirical studies (Arosa et al., 2010; Mazzola et al., 2013; Sciascia et al., 2013; Ansari et al., 2014; Blanco-Mazagatos et al. 2016; Cucculelli et al., 2016; Minichilli et al., 2016; Cavaco et al., 2017; Garcia-Ramos et al., 2017): company size (Total assets) by using the natural logarithm of the book value of total assets; debt level (Financial independence) by adopting the ratio of equity divided by total assets; and the industry (Industry) by using dummy variables based on the Italian industrial sectors (Ateco, 2007): code 1 for manufacturing firms; 0, otherwise.
4. Results
4.1. Descriptive analysis
Table 1 presents descriptive statistics for the analyzed variables providing mean, median, standard deviation, and median differences between first-generation and later generation family firms. Concerning firm size, measured by total assets, as expected, first-generation family businesses are smaller than later generation businesses, and this difference is statistically significant. In regard to the debt level, the median value of the financial independence indicator is higher for later generations of family firms than first-generation ones. In other words, later generations family firms seem to be more able to finance their own activity autonomously. Regarding non-family members’ involvement in the board of directors (Non-family board), what emerges is a limited presence of non-family members in the governance of both first and later generation firms. The family involvement in ownership (Family ownership), as predictable in small-medium sized businesses, appears to be strongly concentrated in the hands of the family. In both cases (first-generation and later generations family firms), the median presence of family is almost 100% of the total equity. Concerning the presence of women in governance (Women board), women’s involvement in the board of directors remains very low both for first and later generations.
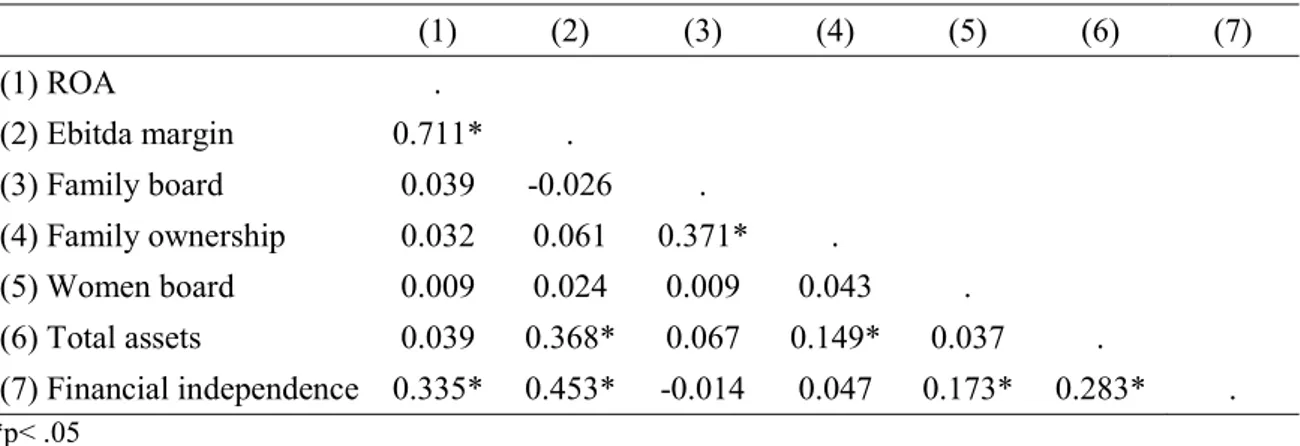
Concerning performance indicators, later generations outperformed first-generation family firms, both in terms of Return on assets (ROA) and the Ebitda margin, and this difference is always statistically significant. Table 2 shows the correlations among the variables used in the present analysis. Multicollinearity is not an issue. Moreover, the absence of multicollinearity among the independent variables is confirmed by variance inflation factors (VIF) obtained through the OLS regression analyses, which never exceed 3 (the recommended threshold) (Myers, 1990).
Table 1 – Descriptive statistics
Variables First-generation (1) Later generation (0) Difference Mean Median S.D. Mean Median S.D. (median) Total assets 20234.28 20501.39 10584.36 24796.52 21801.77 12953.28 -1300.38** Fin. independence 0.288 0.228 0.185 0.377 0.321 0.216 -0.093*** Non-family board 0.325 0.292 0.356 0.200 0 0.283 0.292** Family ownership 0.891 1 0.176 0.887 0.994 0.155 -0.006 Women board 0.169 0 0.242 0.198 0 0.241 0.000 Ebitda margin 0.057 0.049 0.054 0.083 0.069 0.068 -0.020*** ROA 0.029 0.024 0.075 0.051 0.032 0.067 -0.008* N. firms 67 152
***, ** and * indicate significance at the 1%, 5%, and 10% levels, respectively. Table 2 – Correlation matrix
(1) (2) (3) (4) (5) (6) (7) (1) ROA . (2) Ebitda margin 0.711* . (3) Family board 0.039 -0.026 . (4) Family ownership 0.032 0.061 0.371* . (5) Women board 0.009 0.024 0.009 0.043 . (6) Total assets 0.039 0.368* 0.067 0.149* 0.037 . (7) Financial independence 0.335* 0.453* -0.014 0.047 0.173* 0.283* . *p< .05 4.2. Findings
Table 3 presents results for the OLS and quantile regression by considering our main dependent variable (ROA) and the robustness dependent variable (Ebitda margin).
Concerning our first hypothesis —“In first-generation family firms, the positive effect of non-family directors on business performance is limited than in later generations”—results from OLS regression support our assumption. They show that the generational stage moderates the relationship between board composition and financial performance. Particularly, the presence of non-family directors has a positive effect on the performance of later-generation firms (Non-family board: β= 0.052, p< .05). However, this positive effect is diminished in first-generation family firms (the moderating effect: Non-family board X Gen stage, β= -0.100, p< .001). These findings were confirmed by the same model but with the robustness dependent variable (Ebitda margin, β=- 0.086, p < .01). Our results also show that the coefficient of the Generational stage, which represents the effect of passing from one generation to another on financial performance when no external member is involved in the board, does not show significant influence.
Regarding the control variables included in the models–Family ownership, Family CEO, Women Board, Past performance, Total assets, Financial independence, and Industry–the following results were obtained. Concerning family involvement in ownership, it is not possible to establish any relationship between the variable in question and firm performance. Also, regarding Family CEOs and women directors, no relationship with financial outcome appears. Concerning Past performance, as reasonably expected, if the performance during the past three
years showed an increase, current performance is positively influenced. Firm size (Total assets) seems to have a negative influence on family firms’ performance. Moreover, a higher level of financial independence has a positive effect on profitability. Lastly, no relationship was found between manufacturing family firms and performance.
Summing up, our findings suggest that the generation in control represents an important factor of heterogeneity of family firms. As we hypothesized, the generational stage leads to a moderating effect on the relationship between board composition and financial performance.
Specifically, the positive moderating effect is less powerful in first-generation family firms than in later ones. In other words, the presence of non-family members on the board produces lower benefits in terms of financial performance when the founder generation controls the family firm.
Quantile regression was used to test our second hypothesis “The moderating effect of the generational stage on the relationship between non-family directors and financial performance varies across performance levels”. As mentioned above, the interpretation of the findings is similar to that of OLS regression, but for each term, we have more coefficients to interpret: the 25th, the median, and the 75th quantile. They represent—from the lowest to the highest—the different points across the outcome variable distribution (ROA, Ebitda margin).
Overall results from quantile regression confirm previous findings obtained by OLS regression; however, those results indicate a clear difference across performance distribution.
Regarding the interaction term (Non-family board X Gen stage), results in table 4 support our second hypothesis. The moderating effect of the generational stage varies throughout the different levels of performance (ROA). Particularly, this effect emerges as negative and significant in the first quantile (β=-.048, p< .01) when the performance is low; and in the second quantile, although less significant, (β=-.043, p< .10) when performance is median. In the third quantile, at high performance, no significant effect is apparent. In other words, findings demonstrate that the positive effect on financial performance of non-family members in governance, which emerged in the case of later-generations firms, is diminished for first-generation family firms, specifically in family businesses with low performance. In another point of outcome distribution, the third quantile (75th), no influence appears. Thus, taking into account the different levels of a firm’s financial performance, the moderating effect of the generational stage is not homogeneous across the range of distribution of return on assets.
Furthermore, the effect of the Non-family board variable is positively and statistically significant in the second quantile alone (β= .034, p < .10). This variable indicates that a greater presence of non-family members on the board positively influences performance in the case of later-generation family firms, but this effect proves more significant in the median quantile rather than in the case of lower performance (first quantile) or higher performance (third quantile).
As regards the generational stage variable, findings do not show a significant influence across the distribution of performance.
In addition, regarding the control variables, the findings for Family ownership, Family CEO, Women board, Past performance, Total assets, Financial independence, and Industry show a different effect across performance distribution. For instance, ROA has a negative relationship with the firm-size measured as the logarithm of total assets at the 75th quantile. Past performance, if increased in the last three years, positively affects the current financial performance at the median and 75th quantile. Return on assets has a positive relationship with Financial independence at the 25th, median, and 75th quantile. The sector has a positive relationship with both profitability indicators (ROA and Ebitda margin) at the 25th and median quantile, while other control variables such as Family ownership, Family CEO, and Women boards are not found to be statistically significant at any point in the performance distribution.
Variables OLS Q25 Q50 Q75 Q25 Q50 Q75 Non-family board 0.052** 0.054** 0.015 0.034* 0.049 0.0252** 0.029* 0.045 (0.026) (0.022) (0.013) (0.018) (0.032) (0.012) (0.016) (0.029) Generational stage 0.010 0.008 0.004 0.001 0.005 -0.0035 0.013 0.005 (0.012) (0.009) (0.008) (0.11) (0.019) (0.007) (0.009) (0.017) Non-family board X Gen stage -0.100*** -0.086*** -0.048*** -0.043* -0.062 -0.046*** -0.064*** -0.063 (0.039) (0.026) (0.018) (0.026) (0.046) (0.017) (0.023) 0.040 Family ownership 0.004 0.006 -0.006 0.003 -0.016 -0.002 -0.009 0.004 (0.030) (0.025) (0.018) (0.026) (0.045) (0.017) (0.023) (0.040) Family Ceo 0.013 0.006 0.008 0.014 0.000 0.011 -0.003 -0.000 (0.013) (0.012) (0.008) (0.010) (0.018) (0.007) (0.009) (0.016) Women board 0.001 -0.004 -0.008 -0.017 -0.001 -0.002 -0.018 0.004 (0.018) (0.018) (0.011) (0.016) (0.028) (0.011) (0.014) (0.025) Past performance increasing 0.035*** 0.020** 0.007 0.0194** 0.029* 0.004 0.013 0.013 (0.010) (0.009) (0.006) (0.009) (0.017) (0.006) (0.008) (0.014) decreasing 0.012 0.021*** -0.011 0.017 0.015 0.0148* 0.023** 0.012 (0.013) (0.013) (0.009) (0.013) (0.023) (0.008) (0.011) (0.020) Total assests -0.023** 0.021*** -0.008 -0.012 -0.025* 0.0087* 0.012* 0.030** (0.011) (0.006) (0.005) (0.008) (0.013) (0.005) (0.007) (0.012) Financial independence 0.118*** 0.116*** 0 .029** 0.060*** 0.121*** 0.042*** 0.075*** 0.140*** (0.026) (0.028) (0.014) (0.019) (0.035) (0.013) (0.018) (0.031) Industry 0.016 0.006 0.018*** 0.018** 0.018 0 .026*** 0.019** 0.011 (0.010) (0.013) (0.006) (0.009) (0.016) (0.006) (0.008) (0.014) F statistics 4.20*** 8.51*** - - - - R-squared 0.244 0.348 - - - - Pseudo R-squared - - 0.100 0.093 0.175 0.191 0.192 0.236 N 219 219 219 219 219 219 219 219
To draw more robust conclusions, next, we explored the relationship between the term of interaction (Non-family board X Gen stage) and the Ebitda margin as the outcome variable. At the 25th and median quantile, we identified a negative and significant relationship (β= -.046, p < .01; β= -.064, p < .01 respectively) between the term of interaction (Non-family board X Gen stage) and the outcome variable Ebitda margin. It is important to highlight that this relationship does not emerge in the subsequent quantile, 75th. This indicates that the combined effect of the generational stage and non-family members’ involvement is not found in the case of high-performance family firms (i.e., those located in the third quantile of outcome distribution). The results allowed us to confirm previous analyses obtained with the main dependent variable, ROA.
In summary, findings show that a higher presence of non-family members on the board of directors has a less positive effect (called the negative moderating effect) in the case of first-generation family firms by comparison with later first-generations. Furthermore, this effect is more striking in low-performing family businesses than in high-performing ones.
Finally, to verify the reliability of the results, some robustness tests were performed. We re-estimated our main model using the Ebitda margin, which is equal to earnings before interest, tax, depreciation, and amortization (Ebitda), divided by the overall turnover. This margin is a sound proxy indicator of the firm’s ability to generate cash flow through its core business (Granata & Chirico, 2010; Dolenc et al., 2012; Cesaroni et al., 2017). Findings for OLS regression and quantile regression report a similar consistency with the main model applied.
5. Discussion and conclusions
This study examines the relationship between board composition and family firms’ performance, considering the generational stage as a moderating variable. Specifically, adopting the theoretical framework of SEW and investigating a sample of Italian medium-sized family firms, we have analyzed how the presence of non-family directors affects the performance of first-generation or later-generation family businesses. Empirical findings suggest that a higher presence of non-family directors has a less positive effect on firms’ financial performance in the case of first-generation family firms than in later generations. Furthermore, by adopting a quantile regression, we have demonstrated that this effect is more striking in low-performing family businesses than in high-performing ones.
Our findings show that the involvement of non-family members in the boards produces different effects depending on the generation in charge. In first-generation family firms, the family directors’ willingness to preserve SEW (Gomez-Mejia et al., 2007; Gomez-Mejia et al., 2010; Gomez-Mejia et al., 2011; Berrone et al., 2012) could be in contrast with the priority of non-family directors, less attached to the business and more oriented to increasing financial performance (Le Breton-Miller & Miller, 2013). This contrast is diminished in later generation family firms as they are characterized by a lower emphasis on SEW preservation and a stronger commitment to increase financial performance (Sciascia et al. 2014). These arguments explain why non-family directors generate a more limited benefit on first generation family firms’ profitability than on later generations.
Furthermore, our findings show that the moderating effect of the generational stage on the relationship between non-family directors and financial performance varies across financial performance levels and is more impressive in low-performing businesses than in high-performing ones. The reason is that when the family firm achieves high performance, family owners perceive that SEW preservation is ensured (Zellweger, 2017), and radical and/or extreme decisions (e.g., dismissing employees), which could create conflicts between family and non-family directors, are not needed. On the contrary, when the family firm faces low
performance, non-family directors might press for drastic decisions to recover financial performance, but family directors, especially in first-generation family firms, may be less willing to assume those decisions to preserve the SEW. The trade-off between the conflicting perspectives of family and non-family directors could slow down decision-making processes and the strategic behavior of the business, thus explaining why the benefit of non-family directors on financial performance is lower in low-performing family firms than in high-performing ones.
Our findings contribute to family business literature in four ways.
First, our analysis suggests that the relationship between board composition and family firm’s performance is not univocal, given family firms heterogeneity in terms of the generational stage. Specifically, the SEW theoretical framework has helped us to identify situations in which the involvement of non-family directors may be more or less beneficial for family firms. From this perspective, we have discussed the role of the generational stage as a key moderating variable, and we have also shown that the moderating effect changes according to the performance level. Thus, we have furthered knowledge about family firms and board composition effectiveness by explaining that the involvement of non-family directors is less effective in first-generation family firms, especially in those with low performance. Previous research has provided mixed results on this subject, as different authors have suggested that non-family directors’ involvement can be beneficial (Anderson & Reeb, 2004; Voordeckers et al., 2007; Minichilli et al., 2009; Wright & Kellermanns, 2011; Basco & Voordeckers, 2015; Corbetta et al., 2017; Arzubiaga et al., 2018), detrimental (Lee, 2006), or neutral (Kowalewski et al., 2010; Mazzola et al., 2013; Minichilli et al., 2016) to family firms’ performance. However, existing studies have mostly considered big and listed companies (Bammens et al., 2011), while private mid-sized family firms have been completely neglected (Arzubiaga et al., 2018). Furthermore, they have mostly implicitly considered family firms as a homogeneous group (Chua et al., 2012; Daspit et al., 2018), ignoring how their heterogeneity may influence financial performance. In this regard, our study confirms that heterogeneity matters and helps to explain why previous research on this topic has given very conflicting results.
Second, our study is one of the first to underline the importance of performance level as a factor that can influence the relationships between family/non-family directors and firm performance consequently. In this regard, results from the quantile regression show that the influence of non-family directors changes along with the distribution of financial performance and is less beneficial in first-generation family firms that face low performance than in those with high performance. Consequently,in addition to the level of family involvement in family firms’ governance and management (Nordqvist et al., 2014) and generational stage (Daspit et al., 2018), the performance level should be considered another important source of heterogeneity within family firms.
Third, we have furthered knowledge on medium-sized family businesses and the possible consequences of non-family directors in their governance structure. Medium-sized family firms have been largely neglected in previous studies on this topic, despite their increasing relevance in most economies, like Italy (Ciambotti & Palazzi, 2015; Songini et al., 2015; Coltorti et al., 2017). Professionalization is a critical process for those firms, as they often experience growing participation of external managers in governance and management structure. Thus, knowing the variables that can shape the success of this process is of great importance (Bassani & Cattaneo, 2020; Sandu, 2020), and our results provide important suggestions by proving that the involvement of non-family directors does not always generate the expected beneficial effects on performance.
Finally, from a methodological point of view, this paper confirms the usefulness of the quantile regression in evaluating the effects of non-family directors on firms’ financial
performance. This method has effectively allowed us to observe that the effects of non-family directors vary across the distribution of financial performance. Conyon and He (2017) called for greater use of this analysis method to explore other potential reasons, explaining the conflicting results in the relationship between governance structure and family firms' performance. We have responded to this call, and the results from our analysis have helped to shed new light on the application of this statistical method when analyzing this subject.
From a practical point of view, our study may prove very useful to founders, owners, and CEOs of family businesses as it offers valuable indications to guide choices related to the composition of corporate governance bodies and the involvement of non-family directors. Even if professionalization of family firms is generally considered a necessary process to improve firms’ performance and encourage its growth, our analysis shows that the involvement of non-family directors may not always be beneficial to the firms as other variables—namely the generational stage and the performance level—can affect such result. This important result sheds new light on corporate governance mechanisms that occur in family businesses, especially when they are in a transition phase from small to medium size. In other words, the proper valorization of the external professionals involved in a firm strongly depends on the cultural context in which they operate. Family members should, therefore, remodel their mentality and attitude towards external subjects to avoid conflicts which, in the worst case, may cause non-family directors to leave and the consequent depletion of resources and competencies needed for the firm’s growth (Sentuti et al., 2020). Practitioners and advisors should take due account of these findings in their consulting work with family firms.
This study is not free from limitations, which reveal stimulating avenues for future research. First, our analysis is based on data referring to a restricted geographical area. Although this area is particularly suitable for our analysis, given the high presence of medium-sized family businesses, our findings suffer from generalization limits. Therefore, future studies should examine larger areas, both in Italy and other countries, to verify the validity of the results obtained. It would also be interesting to replicate our analysis in countries with different features, especially from the cultural point of view. In fact, the importance of family, the strength of family ties, and the relationship between the owner family and the business are all factors that can influence the results that emerged from our analysis. Thus, replicating such analysis in other geographical areas could be useful for understanding the effect of cultural variables. Second, our analysis is based on data referring to just one year. Although we introduced the “Past performance” control variable to increase the robustness of the results, further research could be performed using a panel analysis. Other limitations concern the independent variables used in our analysis. We defined the generational stage using a rough proxy based on a 25-year cut-off point. This proxy has been used in previous studies (Gottardo & Moisello, 2017). Moreover, we tested the sensitivity of our findings using an alternative threshold of 30 years (Fernandez & Nieto, 2005). However, we are aware that this approach may be seen as a limitation. Therefore, future research could use the generation running the business to test the moderator effect of the generational stage. Moreover, to obtain a more nuanced picture of the relationship between board composition and family business performance, the analysis could be enriched by including other variables that could affect the effectiveness of the board and thus influence the company’s performance. In particular, the percentage of affiliated/unaffiliated outsiders and the CEO duality/non-duality (Corbetta & Salvato, 2004) could be considered.
References
1. Anderson, R.C., & Reeb, D.M. (2004). Board composition: balancing family influence in S&P 500 firms. Administrative Science Quarterly, 49(2), 209-237.
2. Ansari, I. F., Goergen, M., & Mira, S. (2014). The determinants of the CEO successor choice in family firms. Journal of Corporate Finance, 28, 6-25.
3. Arosa, B., Iturralde, T., & Maseda, A. (2010). Outsiders on the board of directors and firm performance: Evidence from Spanish non-listed family firms. Journal of Family Business Strategy, 1(4), 236-245.
4. Arrondo-García, R., Fernández-Méndez, C., & Menéndez-Requejo, S. (2016). The growth and performance of family businesses during the global financial crisis: The role of the generation in control. Journal of Family Business Strategy, 7(4), 227-237.
5. Arzubiaga, U, Kotlar, J., De Massis, A., Maseda, A., & Iturralde, T. (2018). Entrepreneurial orientation and innovation in family SMEs: Unveiling the (actual) impact of the Board of Directors. Journal of Business Venturing, 33(4), 455-469.
6. Astrachan, J. H., & Jaskiewicz, P. (2008). Emotional returns and emotional costs in privately held family businesses: Advancing traditional business valuation. Family Business Review, 21(2), 139-149.
7. Bammens Y., Voordeckers, W., & Van Gils A. (2011). Boards of directors in family businesses: a literature review and research agenda. International Journal of Management Reviews, 13(2), 134-152.
8. Barontini, R., & Caprio, L. (2006). The effect of family control on firm value and performance: Evidence from continental Europe. European Financial Management, 12(5), 689-723.
9. Basco, R., & Voordeckers, W. (2015). The relationship between the board of directors and firm performance in private family firms: A test of the demographic versus behavioral approach. Journal of Management & Organization, 21(4), 411-435.
10. Bassani, G., & Cattaneo, C. (2020), Professionalization and managerialization in family firms: A still open issue. In Leotta A. (ed.) Management Controlling and Governance of Family Businesses: Theoretical Insights and Empirical Evidence from Italy. Switzerland: Springer.
11. Berrone, P., Cruz, C., & Gómez-Mejía, L.R. (2012). Socioemotional wealth in family firms: Theoretical dimensions, assessment approaches, and agenda for future research. Family Business Review, 25(3), 258-279.
12. Blanco-Mazagatos, V., De Quevedo-Puente, E., & Delgado-García, J. B. (2016). How agency conflict between family managers and family owners affects performance in wholly family-owned firms: A generational perspective. Journal of Family Business Strategy, 7(3), 167-177.
13. Breton‐Miller, L., & Miller, D. (2009). Agency vs. stewardship in public family firms: A social embeddedness reconciliation. Entrepreneurship Theory and Practice, 33(6), 1169-1191.
14. Breton‐Miller, L., & Miller, D. (2013). Socioemotional wealth across the family firm life cycle: A commentary on “Family Business Survival and the Role of Boards”. Entrepreneurship Theory and Practice, 37(6), 1391-1397.
15. Calabrò, A., Torchia, M., Jimenez, D. G., & Kraus, S. (2020). The role of human capital on family firm innovativeness: the strategic leadership role of family board members.
International Entrepreneurship and Management Journal.
16. Cavaco, S., Crifo, P., Rebérioux, A., & Roudaut, G. (2017). Independent directors: Less informed but better selected than affiliated board members? Journal of Corporate Finance, 43, 106-121.
17. Cesaroni, F. M., Chamochumbi, D., & Sentuti, A. (2017). Firm performance and economic crisis: Family versus non-family businesses in Italy. African Journal of Business Management, 11(11), 229-240.
18. Chua, J.H., Chrisman, J.J., & Sharma, P. (1999). Defining the family firm by behavior. Entrepreneurship Theory and Practice, 23(4), 19-39.
19. Chua, J. H., Chrisman, I. J., Steier, I. P., & Rau, S. B. (2012). Sources of heterogeneity in family firms: An introduction. Entrepreneurship Theory and Practice, 36(6), 1103-1113. 20. Ciambotti, M., & Palazzi, F. (2015). Medie imprese italiane: un'indagine sui valori
d’impresa. Piccola Impresa/Small Business, (1), 10-30.
21. Clarysse, B., Knockaert, M., & Lockett, A. (2007). Outside Board Members in High Tech Start-ups. Small Business Economics, 29(3), 243-259.
22. Collin, S. O. Y., & Ahlberg, J. (2012). Blood in the boardroom: Family relationships influencing the functions of the board. Journal of Family Business Strategy, 3(4), 207-219. 23. Coltorti, F., Resciniti, R., Tunisini, A., & Varaldo, R. (Eds.) (2013). Mid-sized
Manufacturing Companies: The New Driver of Italian Competitiveness. Switzerland: Springer.
24. Conyon, M. J., & He, L. (2017). Firm performance and boardroom gender diversity: A quantile regression approach. Journal of Business Research, 79, 198-211.
25. Corbetta, G., Minichilli, A., Quarato, F. (2015). Observatory on all the medium-sized and large family controlled companies in Italy, Bocconi University.
26. Corbetta, G., Minichilli, A., & Quarato, F. (2017). Observatory on all the medium-sized and large family controlled companies in Italy, Bocconi University.
27. Corbetta, G., & Salvato, C. A. (2004). The board of directors in family firms: One size fits all? Family Business Review, 7(2), 119-134.
28. Cruz, C., & Nordqvist, M. (2012), Entrepreneurial orientation in family firms: a generational perspective. Small Business Economics, 38(1), 33-49.
29. Cucculelli, M., & Micucci, G. (2008). Family succession and firm performance. Evidence from Italian family firms. Journal of Corporate Finance, 14, 17-31.
30. Cucculelli, M., Le Breton-Miller, I., & Miller, D. (2016). Product innovation, firm renewal and family governance. Journal of Family Business Strategy, 7(2), 90-104.
31. Daspit, J. J., Chrisman, J. J., Sharma, P., Pearson, A. W., & Mahto, R. V. (2018). Governance as a Source of Family Firm Heterogeneity. Journal of Business Research, 84, 293-300.
32. Dolenc, P., Grum, A., & Laporsek, S. (2012). The effect of financial/economic crisis on firm performance in Slovenia-A micro level, difference-in-differences approach. Montenegrin Journal of Economics, 8(2), 207-222.
33. Fernández-Temprano, M. A., & Tejerina-Gaite, F. (2020). Types of director, board diversity and firm performance. Corporate Governance: The International Journal of Business in Society, 20(2), 324-342.
34. Ferreira, D. (2010). Board diversity. In: Anderson, R., Baker, H.K. (Eds.), Corporate Governance: A Synthesis of Theory, Research, and Practice, 225-242. Hoboken, NJ: John Wiley & Sons.
35. Gabrielsson, J. (2007). Boards of directors and entrepreneurial posture in medium-size companies: Putting the board demography approach to a test. International Small Business Journal, 25(5), 511-537.
36. Gabrielsson, J., & Huse, C. (2005). Outside directors in SME board: A call for theoretical reflections. Corporate Board: Roles, Duties & Composition, 1(1), 28-37.
37. García, A. M., Jainaga, T. I., de Castro, G. A., Boulkeroua, L., & Cooper, S. (2019). Family board ownership, generational involvement and performance in family SMEs: a test of the S-shaped hypothesis. European Journal of Management and Business Economics, 28(3), 285-300.
38. Garcia-Castro, R., & Aguilera, R. V. (2014). Family involvement in business and financial performance: A set-theoretic cross-national inquiry. Journal of Family Business Strategy, 5(1), 85-96.
39. García-Ramos, R., Díaz-Díaz, B., & García-Olalla, M. (2017). Independent directors, large shareholders and firm performance: the generational stage of family businesses and the socioemotional wealth approach. Review of Managerial Science, 11(1), 119-156.
40. Gersick, K. E., Davis, J. A., Hampton, M. M., & Lansberg, I. (1997). Generation to generation: Life cycles of the family business. Boston, MA: Harvard Business School Press.
41. Gomez-Mejia, L. R., Cruz, C., Berrone, P., & De Castro, J. (2011). The bind that ties: Socioemotional wealth preservation in family firms. Academy of Management Annals, 5(1), 653-707.
42. Gómez, M., Isaac, J., Gómez Betancourt, G. E., & Betancourt Ramírez, J. B. (2016). Board of director in the family business and its impact on socioemotional wealth. Revista Espacios. Retrieved from http://repositorio.cuc.edu.co/handle/11323/1142
43. Gomez-Mejia, L. R., Makri, M., & Larraza Kintana, M. (2010). Diversification decisions in family-controlled firms. Journal of Management Studies, 47(2), 223-252.
44. Gottardo, P., & Moisello, A. M. (2017). Socioemotional wealth and probability of financial distress. African Journal of Business Management, 11(13), 285-292.
45. Granata, D., & Chirico, F. (2010). Measures of value in acquisitions: family versus nonfamily firms. Family Business Review, 23(4), 341-354.
46. Gόmez-Mejia, L. R., Haynes, K. T., Nunez-Nickel, M., Jacobson, K. J. L., & Moyano-Fuentes, J. (2007). Socioemotional wealth and business risks in family-controlled firms: Evidence from Spanish olive oil mills. Administrative Science Quarterly, 52(1), 106-137. 47. Hoy, F., & Sharma, P. (2010). Entrepreneurial family firms. New York, NY: Prentice Hall. 48. Huse, M. (2005). Accountability and creating accountability: a framework for exploring behavioural perspectives of corporate governance. British Journal of Management, 16 (Suppl.), 65-79.
49. Iacono, M. P., Martinez, M., Mercurio, L., & Mangia, G. (2013). Exploring the relationship between governance, Power of control and organizational conflict: a survey on small and medium Italian family firms. Piccola Impresa/Small Business, (1), pp. 33-55
50. Kellermanns, F. W., Eddleston, K. A. (2006). Corporate Entrepreneurship in Family Firms: A Family Perspective, Entrepreneurship theory and practice, 30(6), 809-830.
51. Kellermanns, F. W., Eddleston, K. A., Sarathy, R., & Murphy, F. (2012). Innovativeness in family firms: a family influence perspective. Small Business Economics, 38(1), 85-101. 52. Koenker, R., & Gilbert, B. (1978). Regression quantiles. Econometrica, 46(1), 33-50. 53. Kowalewski, O., Talavera O., & Stetsyuk, I. (2010). Influence of family involvement in
management and ownership on firm performance. Family Business Review, 23(1) 45-59. 54. Lane, S., Astrachan, J., Keyt, A., & McMillan, K. (2006). Guidelines for family business
boards of directors. Family Business Review, 19(2), 147-167.
55. Lee, J. (2006). Family firm performance: Further evidence. Family Business Review, 19 (2), 103-114.
56. Maseda, A., Iturralde, T., Arosa, B. (2015). Impact of Outsiders on Firm Performance over Different Generations of Family-Owned SMEs. Journal of Small Business Management, 53(4), 1203-1218.
57. Mazzi, C. (2011). Family business and financial performance: Current state of knowledge and future research challenges. Journal of Family Business Strategy, 2(3), 166-181. 58. Mazzola, P., Sciascia, S., & Kellermanns, F. W. (2013). Non-linear effects of family
sources of power on performance. Journal of Business Research, 66(4), 568-574.
59. Mediobanca & Unioncamere (2015). Le medie imprese industriali italiane 2005-2014, Mediobanca Ufficio Studi.
60. Minichilli, A., Brogi, & M., Calabrò A. (2016). Weathering the storm: Family ownership, governance, and performance through the financial and economic crisis. Corporate Governance: An International Review, 24(6), 552-568.
61. Minichilli, A., Corbetta, G., & MacMillan, I. (2010). Top management teams in family controlled companies: ‘Familiness’, ‘faultliness’, and their impact on financial performance. Journal Management Studies, 47(2), 205-222.
62. Minichilli, A., Zattoni, A., & Zona, F. (2009). Making boards effective: An empirical examination of board task performance. British Journal of Management, 20(1), 55-74. 63. Muñoz-Bullon, F., Sanchez-Bueno, M. J., & Suárez-González, I. (2017). Diversification
decisions among family firms: The role of family involvement and generational stage. Business Research Quarterly, 21(1), 39-52.
64. Mussolino, D., & Calabrò, A. (2014). Paternalistic leadership in family firms: Types and implications for intergenerational succession. Journal of Family Business Strategy, 5(2), 197-210.
65. Mustapha, Y. I., & Nafiu, A. I. (2017). Relationship Between Board Structure Variables And Performance Of Listed Manufacturing Firms In Nigeria. The International Journal of Economic Behavior-IJEB, 7(1), 131-147.
66. Myers, R.H. (1990). Classical and modern regression with applications, 2nd ed. PWS-Kent, Boston.
67. Naldi, L., Cennamo, C., Corbetta, G., & Gómez-Mejía, L. (2013). Preserving Socioemotional Wealth in Family Firms: Asset or Liability? The Moderating Role of Business Context. Entrepreneurial Theory Practice, 37(6), 1341-1360.
68. Nordqvist, M., Sharma, P., & Chirico, F. (2014). Family firm heterogeneity and governance: A configuration approach. Journal of Small Business Management, 52(2), 192-209.
69. O’Boyle Jr E.H., Pollack J.M., & Rutherford, M.W. (2012). Exploring the relation between family involvement and firms financial performance: A meta-analysis of main and moderator effects. Journal Business Venturing, 27(1), 1-18.
70. Poletti-Hughes, J., & Briano-Turrent, G. C. (2019). Gender diversity on the board of directors and corporate risk: A behavioural agency theory perspective. International Review of Financial Analysis, 62, 80-90.
71. Sacristan-Navarro, M., Gomez-Anson, S., & Cabeza-Garcia, L. (2011). Family ownership and control, the presence of other large shareholders, and firm performance: Further evidence. Family Business Review, 24(1), 71-93.
72. Samara, G., Jamali, D., & Lapeira, M. (2019). Why and how should SHE make her way into the family business boardroom? Business Horizons, 62(1), 105-115.
73. Sandu, P. (2019). A framework of family business professionalization. International Journal of Entrepreneurship, 23(1), 1-8.
74. Sciascia, S., & Mazzola, P. (2008). Family involvement in ownership and management: Exploring nonlinear effects on performance. Family Business Review, 21(4), 331-345.