Abstract.
– OBJECTIVE: Severe Acute Respi-ratory Syndrome Coronavirus (SARS-CoV-2) in-fection may yield a hypercoagulable state with fibrinolysis impairment. We conducted a sin-gle-center observational study with the aim of analyzing the coagulation patterns of inten-sive care unit (ICU) COVID-19 patients with both standard laboratory and viscoelastic tests. The presence of coagulopathy at the onset of the in-fection and after seven days of systemic antico-agulant therapy was investigated.PATIENTS AND METHODS: Forty consecutive SARS-CoV-2 patients, admitted to the ICU of a Uni-versity hospital in Italy between 29th February and 30th March 2020 were enrolled in the study, pro-viding they fulfilled the acute respiratory distress syndrome criteria. They received full-dose antico-agulation, including Enoxaparin 0.5 mg·kg-1 sub-cutaneously twice a day, unfractionated Hepa-rin 7500 units subcutaneously three times daily, or low-intensity Heparin infusion. Thromboelas-tographic (TEG) and laboratory parameters were measured at admission and after seven days.
RESULTS: At baseline, patients showed ele-vated fibrinogen activity [rTEG-Ang 80.5° (78.7 to 81.5); TEG-ACT 78.5 sec (69.2 to 87.9)] and an in-crease in the maximum amplitude of clot strength [FF-MA 42.2 mm (30.9 to 49.2)]. No alterations in time of the enzymatic phase of coagulation [CKH-K and CKH-R, 1.1 min (0.85 to 1.3) and 6.6 min (5.2 to 7.5), respectively] were observed. Absent lysis of
the clot at 30 minutes (LY30) was observed in all the studied population. Standard coagulation pa-rameters were within the physiological range: [INR 1.09 (1.01 to 1.20), aPTT 34.5 sec (29.7 to 42.2), an-tithrombin 97.5% (89.5 to 115)]. However, plasma fi-brinogen [512.5 mg·dl-1 (303.5 to 605)], and D-di-mer levels [1752.5 ng·ml-1 (698.5 to 4434.5)], were persistently increased above the reference range. After seven days of full-dose anticoagulation, aver-age TEG parameters were not different from base-line (rTEG-Ang p = 0.13, TEG-ACT p = 0.58, FF-MA p = 0.24, CK-R p = 0.19, CKH-R p = 0.35), and a per-sistent increase in white blood cell count, platelet count and D-dimer was observed (white blood cell count p < 0.01, neutrophil count p = 0.02, lympho-cyte count p < 0.01, platelet count p = 0.13 < 0.01, D-dimer levels p= 0.02).
CONCLUSIONS: SARS-CoV-2 patients with acute respiratory distress syndrome show el-evated fibrinogen activity, high D-dimer levels and maximum amplitude of clot strength. Plate-let count, fibrinogen, and standard coagulation tests do not indicate a disseminated intravascu-lar coagulation. At seven days, thromboelasto-graphic abnormalities persist despite full-dose anticoagulation.
Key Words:
Coronavirus, Respiratory insufficiency, Hemostasis, Blood coagulation, Critical care, Pneumonia, Throm-bosis, Infection, Critical illness.
M.G. BOCCI
1, R. MAVIGLIA
1, L.M. CONSALVO
1, D.L. GRIECO
1, L. MONTINI
1,2,
G. MERCURIO
1, G. NARDI
3, L. PISAPIA
1, S.L. CUTULI
1, D.G. BIASUCCI
1, C. GORI
4,
R. ROSENKRANZ
5, E. DE CANDIA
2,6, S. CARELLI
1, D. NATALINI
1,
M. ANTONELLI
1,2, F. FRANCESCHI
1,21
Dipartimento di Scienze dell’Emergenza, Anestesiologiche e della Rianimazione, Fondazione Policlinico
Universitario A. Gemelli IRCCS, Rome, Italy
2
Università Cattolica del Sacro Cuore, Rome, Italy
3
Unità Operativa di Anestesia e Rianimazione, Ospedale “Infermi”, Rimini, Italy
4
Unità Operativa Semplice Dipartimentale Shock e Trauma, Azienda Ospedaliera San Camillo Forlanini,
Rome, Italy
5
IsTerre, Institut des Sciences de la Terre, Grenoble University, Gières, France
6
Dipartimento di Diagnostica per Immagini, Radioterapia, Oncologia ed Ematologia, Fondazione
Policlinico Universitario A. Gemelli IRCCS, Rome, Italy
Thromboelastography clot strength profiles and
effect of systemic anticoagulation in COVID-19
acute respiratory distress syndrome:
Abbreviations
SARS-CoV-2, Severe Acute Respiratory Syndrome-Coro-navirus-2; ARDS, Acute respiratory distress syndrome; DVT, Deep Venous Thrombosis; COVID-19, Coronavi-rus Disease 19; VTE, Venous Thromboembolism; aPTT, Activated Partial Thromboplastin Time; PT, prothrombin time; INR, International Normalized Ratio; TEG, Throm-boelastography; SOFA, Sequential Organ Failure Assess-ment score; DIC, Disseminated Intravascular Coagulation; BMI, Body Mass Index; ROTEM, Rotational Throm-boelastometry; LMWH, Low Molecular Weight Heparin; UFH, Unfractionated Heparin; PCR, Polymerase Chain Reaction; IRB, Institutional Review Board; STROBE, Strengthening the Reporting of Observational Studies in Epidemiology; ISTH, International Society on Thrombo-sis and HemostaThrombo-sis; ICU, Intensive Care Unit; CK, Kaolin TEG; CKH, Kaolin TEG with heparinase; rTEG, Rapid TEG; CFF, TEG functional fibrinogen; R, Time to Fibrin Formation; K, angle constant; α, angle; MA, maximal clot strength; LY30, percentage decrease in amplitude at 30 minutes post-MA; KDE, Kernel Density Estimate; IQR, Interquartile Range; SD, Standard Deviation; WBC, White Blood Cell Count; TF, Tissue Factor
Introduction
Severe Acute Respiratory Syndrome
Corona-virus 2 (SARS-CoV-2) can cause severe
inter-stitial lung disease and acute respiratory distress
syndrome (ARDS), needing ventilatory support
and admission to the intensive care unit
1,2.
Mi-crovascular thrombosis is a hallmark of ARDS,
and patients with SARS-CoV-2 commonly show
overproduction of early response
pro-inflamma-tory cytokines, hypercoagulation, and markedly
elevated D-dimer levels
3. Although these findings
are associated with poor prognosis, data suggest
that anticoagulant therapy may be beneficial, as
observed in patients with sepsis
4-10. Klok et al
11evaluated the incidence of the composite outcome
of symptomatic acute pulmonary embolism,
deep-vein thrombosis (DVT), ischemic stroke,
myocar-dial infarction or systemic arterial embolism in
184 SARS-CoV-2 positive patients admitted to
the ICU. They found thrombotic complications
occurred in 31% of those receiving standard
ve-nous thromboembolism (VTE) prophylaxis. In a
multicenter retrospective analysis of 187 patients,
Shah et al
12found an incidence of 43.3% of
pul-monary embolism and DVP, and 13.3% of arterial
thrombotic events. Maatman et al
13observation-al anobservation-alysis on 240 SARS-CoV-2 positive patients
hypothesized that the standard VTE
prophylax-is might be inadequate in preventing
thrombot-ic complthrombot-ications in severe Coronavirus Disease
19 (COVID-19). A typical feature of COVID-19
syndrome is a severe impairment of the
fibrino-lytic process with an increase in D-dimer levels,
associated with an increase in thromboembolic
events
14. Standard coagulation tests, such as
ac-tivated partial thromboplastin time (aPTT), and
prothrombin time (PT), are not useful in
identify-ing hypercoagulability, and do not explore
plate-let function and fibrinolysis. In addition,
fibrino-gen levels and absolute platelet count provide no
information about their functionality.
Viscoelastic whole blood tests may detect
co-agulation abnormalities that are not detectable
by conventional tests
15-17. Thromboelastography
(TEG) provides useful information about
hyper-coagulability, assesses clot lysis, and
dissemi-nated intravascular coagulation (DIC)
18.
Obser-vational studies
12,14,19-27involving small cohorts
have shown that thromboelastography is reliable
in identifying hypercoagulability and fibrinolysis
shutdown in COVID-19 patients.
TEG
®6s (Haemonetics, Braintree, MA, USA),
a new generation of TEG devices, was introduced
recently
28-31. Lloyd-Donald et al
32demonstrated in
a small group of critically ill patients that TEG
®6s
generates similar results to the TEG
®5000 model.
Although several studies have already
investi-gated the coagulation assessment of COVID-19
patients, it is still unclear how coagulation
chang-es can affect or reflect the course of the COVID-19
disease.
We conducted a prospective observational
study to assess the effects of seven-day full-dose
systemic anticoagulation on coagulation
parame-ters investigated by standard and
thromboelasto-graphic methods in a cohort of patients with
AR-DS due to COVID-19.
Patients and Methods
In this single-center prospective
observa-tional study, consecutive patients who were
ad-mitted to ICU with respiratory failure and with
a confirmed molecular diagnosis (a positive real
time polymerase chain reaction for viral RNA)
of COVID-19 via an upper or lower respiratory
tract specimen were considered for enrolment in
this study. Patients admitted between 29
thFeb-ruary-30
thMarch 2020 at a University hospital
in Italy were included provided they fulfilled the
ARDS criteria
33,
received full-dose
anticoagu-lation (Enoxaparin 0.5 mg·kg
-1subcutaneously
twice a day, unfractionated heparin 7500 units
subcutaneously three times daily, or
low-inten-(K angle, represents the propagation phase and
measures the rate of clot formation), maximum
amplitude (MA, represents the overall stability
of the clot), and amplitude at 30 minutes (LY30,
represents the fibrinolysis phase and measures
the percentage decrease in amplitude at 30
min-utes post-MA).
Based on the increasing evidence
11-13,37,38of
a hypercoagulable state and a very high
inci-dence of thromboembolic events in COVID-19
patients, our institutional protocols advise
ini-tiation of full-dose systemic anticoagulation at
admission to ICU (Enoxaparin 0.5 mg·kg
-1sub-cutaneous twice daily, unfractionated heparin
7500 units subcutaneously three times daily, or
low-intensity heparin infusion). Dosages and
duration of anticoagulant therapy were recorded.
Statistical Analysis
Normal distribution of continuous variables was
assessed by the Kolmogorov-Smirnov test and the
Shapiro-Wilk test. Continuous variables with
nor-mal distribution were presented as mean ± standard
deviation (SD) and were compared using Student’s
t-test; continuous variables with non-normal
dis-tribution were presented as median (Interquartile
range, IQR) and were compared by the
non-para-metric Mann-Whitney test. Categorical variables
were presented as numbers (percentages) and were
compared across groups using the χ
2or Fisher’s
ex-act test, as appropriate. A two-sided p-value < 0.05
was considered statistically significant in the final
analysis. The analysis of the results of the TEG
®6s
traces was performed, and the distribution
densi-ty of data was analyzed using the Kernel Densidensi-ty
Estimate (KDE). Data comparing differences in
TEG
®6s parameters after seven days are presented
as box plots. Statistical analysis was performed
us-ing Stata/IC 16.0.
The majority of studies adopt TEG
®5000 or
ROTEM, resulting in insufficient data available
on results obtained from TEG
®6s in SARS-CoV-2
infection. Although the sample size was not
cal-culated, our minimal study sample size per group
is sufficient for a pilot study. Julius
39confirms that
a minimum of 12 subjects per group is sufficient
for a pilot study.
Results
Forty consecutive COVID-19 patients with
ARDS were enrolled in the study. Clinical and
laboratory baseline characteristics of the study
sity heparin infusion). Patients with one or more
of the following criteria were excluded: history
of cirrhosis; preexistent coagulation or
hemo-stasis disorders; active malignancy; Body Mass
Index (BMI) < 20; supplemental steroid therapy;
thrombocytopenia with a platelet count less than
150x10
9·l
-1; anti-platelet medications or vitamin K
agonists at the time of ICU admission.
Ethical approval for this study was provided
by the local Institutional Review Board, and
in-formed consent was obtained according to
com-mittee recommendations. This study is reported
following the reporting guidelines for a cohort
study by Strengthening the Reporting of
Obser-vational Studies in Epidemiology (STROBE).
Procedures
Within the first 24 hours of ICU admission,
de-mographic and clinical data were recorded, and
blood samples for routine standard
hematologi-cal parameters were obtained in vacutainer tubes
from an arterial line. Two blood citrate samples
(3 ml, sodium citrate solution, Vacuette
®Blood
Tubes) were also collected for the laboratory
stan-dard coagulation tests (aPTT, INR, D-dimer
lev-els, Antithrombin) and TEG
®6s assessment.
DIC score per International Society on
Throm-bosis and Haemostasis (ISTH) criteria
34,35, and
Sequential Organ Failure Assessment (SOFA)
36score, were calculated for each patient on
admis-sion to ICU.
All laboratory tests were repeated seven days
after initial analysis, unless patients were
dis-charged or deceased.
TEG
®6s assays consisted in: Kaolin TEG (CK),
which describes the intrinsic pathway activation
and can assess the overall coagulation function;
Kaolin TEG with heparinase (CKH) which
neu-tralizes the effects of heparin and can assess the
presence of heparin or heparinoids; Rapid TEG
(rTEG), which describes both the intrinsic and
ex-trinsic pathway using both kaolin and tissue
fac-tor (TF); TEG functional fibrinogen (CFF), which
uses TF as a coagulation activator and GpIIb/IIIa
inhibitors to neutralize platelet function in order
to measure the fibrinogen contribution to clot
for-mation.
The TEG parameters include reaction time
(R, time to fibrin formation, represents the
ini-tiation phase and measures the time of latency
from the start of the test to initial fibrin
for-mation), clot formation time (K, represents
am-plification phase and measures the time taken
to achieve 20 mm of clot strength), angle or α
show a specific state of hypercoagulation [7.1
min (IQR 5.2 to 8.1) and 6.6 min (IQR 5.2-7.5)]
whereas the distribution in percentiles towards
a hypercoagulation pattern was evident by
ex-amining the FF-MA [42.2 mm (IQR 30.9 to
49.2)], rTEG-Ang [80.5° (IQR 78.7 to 81.5)],
and TEG-ACT [78.5 sec (IQR 69.2 to 87.9)]
(Table I). Absent lysis of the clot at 30 minutes
(LY30) was observed in all the studied
popula-tion, independently from the outcome (Table I
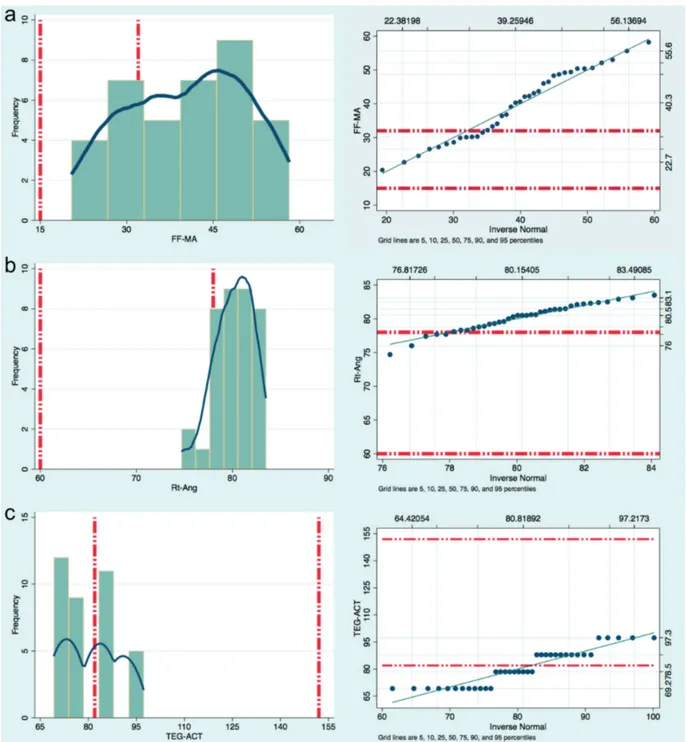
and Table II). By comparing the distribution in
percentiles with the Kernel Density Estimate,
the value peaks of all the measured parameters
showed a hypercoagulation pattern (Figure 1).
The angle and maximal clot strength amplitude
of the different types of TEG
®6s tests have at
least 50% of the values distributed above the
standard limit, and the distribution of
TEG-ACT values show more than 75% of the values
below the average values. Altogether, these
da-ta were suggestive of a prothrombotic pattern
(Table II).
Seven-Day Follow-Up
White blood cell (WBC) count (7.79x10
9·l
-1(IQR 6 to 12.25) vs. 11.36x10
9·l
-1(IQR
9.86-15.89), p < 0.01), platelet count (IQR 177.5x10
9·l
-1(155 to 250) vs. 260.5x10
9·l
-1(IQR 214 to 413), p
< 0.001), neutrophil count (IQR 6.56x10
9·l
-1(3.73
to 10.72) vs. 8.83x10
9·l
-1(IQR 8.11 to 11.73), p =
0.02), lymphocyte count (IQR 0.73x10
9·l
-1(0.47
to 1.09) vs. 1.16x10
9·l
-1(IQR 0.62 to 1.54), p <
0.01), and D-dimer levels (IQR 1034.5 ng·ml
-1(628 to 3762) vs. 5330 ng·ml
-1(IQR 2187 to
15800), p = 0.02) were significantly increased
after seven days in the 26 patients with the
sev-en-day follow-up blood samples available. We
also noticed a decrease in lactate dehydrogenase
(LDH) (IQR 451.5 U·l
-1(361 to 554) vs. 364.5
U·l
-1(IQR 298 to 425), p = 0.01), and aPTT (34.9
sec (IQR 29.2 to 42.5) vs. 31.4 sec (IQR 28.1 to
36), p < 0.05). No infections were described for
these patients during the first seven days. These
data were collected in 26 patients (Table III).
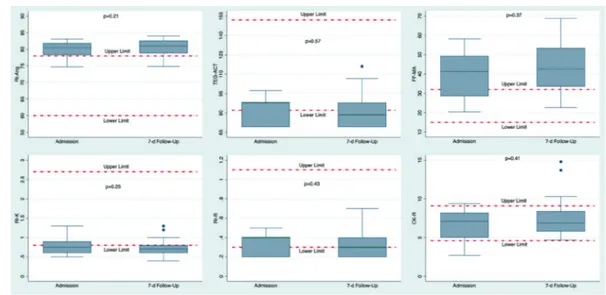
TEG
®6s parameters and variables do not
significantly differ at seven-day follow-up, and
after a week of full-dose systemic
anticoagula-tion, confirming a state of hypercoagulability
explained by the distribution above the normal
range of angle and maximal clot strength
am-plitude (MA). Anticoagulation, either
enoxa-parin or unfractionated heenoxa-parin, show no
im-pact on TEG patterns at seven days (Figure 2,
Table III).
population are shown in Table I. The median age
was 67.5 (IQR 55 to 77) years old, and 72.5% of
patients were male. The mean SOFA score was
5±2.9, and mean DIC score was 2.9±0.6. Half
(52.5%) of enrolled patients had a coexistent
cardiovascular disease, and 15% a respiratory
disease. Orotracheal intubation was required for
72.5% of patients, and median P
aO
2/F
iO
2ratio
at
admission was 190 (IQR 149.5 to 221.5), which
identify a moderate ARDS per Berlin criteria
32.
All patients received full-dose systemic
anti-coagulation with Enoxaparin or unfractionated
Heparin. All patients had a TEG
®6s assessment
at admission, and we could perform a second
as-sessment at 7 days in 26 patients.
The patients were subsequently stratified based
on the outcome at 28 days after admission to ICU.
Patients with the worst outcome were older [77 years
old (IQR 75 to 80) vs. 57 years old (IQR 48 to 67),
p < 0.01], had more cardiovascular [14 (82.4%) vs.
7 (30.4%), p < 0.01] and respiratory comorbidities
[6 (35.3%) vs. 0 (0%), p < 0.01], had lower S
pO
2on
ICU admission [96% (IQR 95 to 98) vs. 98% (IQR
97 to 99), p < 0.01], and higher levels of D-dimer
[3762 ng·ml
-1(IQR 1464 to 6045) vs. 851 ng·ml
-1(IQR 530 to 2714), p < 0.01]. Mean SOFA (7±2.4
vs. 4±2.7, p < 0.01) and DIC (3.2±0.4 vs. 2.7±0.7, p
< 0.01) scores at 28 days were significantly higher
in those patients that died. DIC score in all patients
constantly remained less than five, thus suggesting
that an overt DIC did not develop in our cohort
34,35.
We found two cases of pulmonary embolism, and
one of these patients died within the first 28 days
after admission to ICU.
Standard Coagulation Tests
The platelet count, aPTT and INR have not
shown any coagulation abnormality in our
pop-ulation [193.5x10
9·l
-1(IQR 163 to 281), aPTT 34.5
sec (IQR 29.7 to 42.2), 1.09 (IQR 1.01 to 1.20)]
(Table I). D-dimer levels were increased in the
study population, with a median value of 1752.5
ng·ml
-1(IQR 698.5 to 4434.5).
Thromboelastography
The TEG
®6s traces of 40 consecutive
pa-tients were analyzed. Table II describes the
percentage of deviation from the normal range
for each value in our studied cohort of patients
at the moment of ICU admission. The second
TEG
®6s determination, performed after 7 days
of anticoagulant treatment, was available for
26 patients (Table III). On admission to ICU,
the distribution of CK-R and CKH-R did not
Table I. Clinical and laboratory characteristics of the study population.
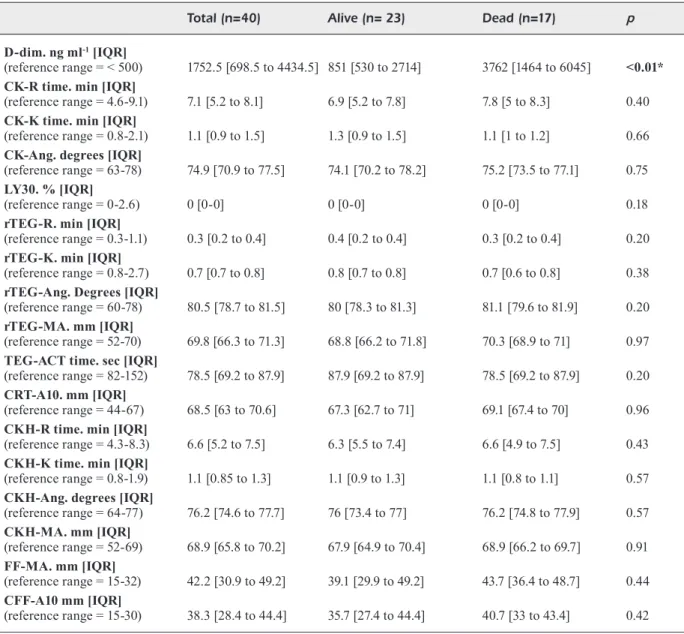
Total (n=40) Alive (n= 23) Dead (n=17) p
Sex, female. No. (%) 11 (27.5) 6 (26.1) 5 (29.4) >0.99 Age [IQR] 67.5 [55 to 77] 57 [48 to 67] 77 [75 to 80] <0.01* Cardiovascular disease. No. (%) 21 (52.5) 7 (30.4) 14 (82.4) <0.01* Respiratory disease. No. (%) 6 (15) 0 6 (35.3) <0.01* Obesity. No. (%) 3 (7.5) 2 (8.7) 1 (5.9) >0.99 Renal disease. No. (%) 2 (5) 0 2 (11.8) 0.18 Diabetes. No. (%) 3 (7.5) 2 (8.7) 1 (5.9) >0.99 FiO2. Ratio [IQR] 0.55 [0.5 to 0.6] 0.6 [0.5 to 0.6] 0.5 [0.5 to 0.6] 0.97
OTI. No. (%) 29 (72.5) 15 (65.2) 14 (82.4) 0.23 SpO2. % [IQR] 98 [96 to 98.5] 98 [97 to 99] 96 [95 to 98] <0.01* PaO2/FiO2. Ratio [IQR] 190 [149.5 to 221.5] 196 [178 to 232] 152 [134 to 193] 0.048* SpO2/FiO2. Ratio [IQR] 174 [161.5 to 197] 165 [163 to 198] 188 [160 to 196] 0.64 PaCO2. mmHg [IQR] (reference range = 35-48) 36 [32 to 41] 35 [32 to 44] 36 [32 to 39.7] 0.90 Lac. mmol l-1 [IQR]
(reference range = 0.5-1.6) 1.1 [1 to 1.6] 1.1 [1 to 1.4] 1.1 [0.9 to 1.8] 0.97 pH [IQR] (reference range = 7.35-7.45) 7.42 [7.36 to 7.46] 7.42 [7.38 to 7.44] 7.43 [7.34 to 7.47] 0.65 HR, bpm [IQR] 79 [66 to 86.5] 79 [66 to 87] 79 [69 to 86] 0.52 MAP, mmHg [IQR] 79.5 [77.5 to 86] 82 [78 to 89] 79 [77 to 81] 0.08 Darunavir/Ritonavir. No. (%) 7 (17.5) 6 (26.1) 1 (5.9) 0.21 Lopinavir/Ritonavir. No. (%) 30 (75) 16 (69.6) 14 (82.4) 0.47 Antibiotics. No. (%) 36 (90) 21 (91.3) 15 (88.2) >0.99 Sarilumab. No. (%) 4 (10) 4 (17.4) 0 0.12 Tocilizumab. No. (%) 7 (17.5) 7 (30.4) 0 0.01* DIC score. Mean ± SD 2.9 ± 0.6 2.7 ± 0.7 3.2 ± 0.4 <0.01* SOFA score. Mean ± SD 5 ± 2.9 4 ± 2.7 7 ± 2.4 <0.01* WBC count. X 109 l-1 [IQR]
(reference range = 4-10) 8.54 [5.98 to 12.68] 7.54 [4.9 to 10.6] 11.08 [6.43 to 15.26] 0.12 Neutrophil count. X 109 l-1 [IQR]
(reference range = 1.5-7) 7.39 [3.99 to 10.91] 6.2 [3.73 to 9.09] 9.75 [5.7 to 12.12] 0.10 Lymphocyte count. X 109 l-1 [IQR]
(reference range = 1.5-3) 0.77 [0.49 to 1.14] 0.85 [0.61 to 1.27] 0.6 [0.38 to 0.84] 0.08 CRP. mg l-1 [IQR] (reference range < 5) 160.1 [74.55 to 193.15] 94.8 [41.9 to 185.6] 182 [152.5 to 212] 0.02* PCT. ng ml-1 [IQR] (reference range < 0.5) 0.23 [0.11 to 0.57] 0.17 [0.09 to 0.8] 0.23 [0.19 to 0.29] 0.30 LDH. U l-1 [IQR] (reference range < 250) 463 [344.5 to 566] 441 [317 to 530] 547 [407 to 656] 0.12 aPTT. sec [IQR]
(reference range = 20-38) 34.5 [29.7 to 42.2] 33.7 [28.7 to 44.8] 35.4 [31.3 to 41.9] 0.46 INR. Ratio [IQR]
(reference range = 0.8-1.2) 1.09 [1.01 to 1.20] 1.07 [1 to 1.15] 1.11 [1.03 to 1.21] 0.29 Fib. mg dl-1 [IQR]
(reference range = 200-400) 512.5 [303.5 to 605] 487 [385 to 596] 557 [428 to 756] 0.37 Platelet count. x 109 l-1 [IQR]
(reference range = 150-450) 193.5 [163 to 281] 228 [165 to 347] 185 [161 to 250] 0.34 AT. % [IQR]
(reference range = 70-140) 97.5 [89.5 to 115] 100 [94 to 120] 90 [75 to 104] 0.02*
Table I. (Continued). Clinical and laboratory characteristics of the study population.
Total (n=40) Alive (n= 23) Dead (n=17) p
D-dim. ng ml-1 [IQR]
(reference range = < 500) 1752.5 [698.5 to 4434.5] 851 [530 to 2714] 3762 [1464 to 6045] <0.01* CK-R time. min [IQR]
(reference range = 4.6-9.1) 7.1 [5.2 to 8.1] 6.9 [5.2 to 7.8] 7.8 [5 to 8.3] 0.40 CK-K time. min [IQR]
(reference range = 0.8-2.1) 1.1 [0.9 to 1.5] 1.3 [0.9 to 1.5] 1.1 [1 to 1.2] 0.66 CK-Ang. degrees [IQR]
(reference range = 63-78) 74.9 [70.9 to 77.5] 74.1 [70.2 to 78.2] 75.2 [73.5 to 77.1] 0.75 LY30. % [IQR]
(reference range = 0-2.6) 0 [0-0] 0 [0-0] 0 [0-0] 0.18 rTEG-R. min [IQR]
(reference range = 0.3-1.1) 0.3 [0.2 to 0.4] 0.4 [0.2 to 0.4] 0.3 [0.2 to 0.4] 0.20 rTEG-K. min [IQR]
(reference range = 0.8-2.7) 0.7 [0.7 to 0.8] 0.8 [0.7 to 0.8] 0.7 [0.6 to 0.8] 0.38 rTEG-Ang. Degrees [IQR]
(reference range = 60-78) 80.5 [78.7 to 81.5] 80 [78.3 to 81.3] 81.1 [79.6 to 81.9] 0.20 rTEG-MA. mm [IQR]
(reference range = 52-70) 69.8 [66.3 to 71.3] 68.8 [66.2 to 71.8] 70.3 [68.9 to 71] 0.97 TEG-ACT time. sec [IQR]
(reference range = 82-152) 78.5 [69.2 to 87.9] 87.9 [69.2 to 87.9] 78.5 [69.2 to 87.9] 0.20 CRT-A10. mm [IQR]
(reference range = 44-67) 68.5 [63 to 70.6] 67.3 [62.7 to 71] 69.1 [67.4 to 70] 0.96 CKH-R time. min [IQR]
(reference range = 4.3-8.3) 6.6 [5.2 to 7.5] 6.3 [5.5 to 7.4] 6.6 [4.9 to 7.5] 0.43 CKH-K time. min [IQR]
(reference range = 0.8-1.9) 1.1 [0.85 to 1.3] 1.1 [0.9 to 1.3] 1.1 [0.8 to 1.1] 0.57 CKH-Ang. degrees [IQR]
(reference range = 64-77) 76.2 [74.6 to 77.7] 76 [73.4 to 77] 76.2 [74.8 to 77.9] 0.57 CKH-MA. mm [IQR] (reference range = 52-69) 68.9 [65.8 to 70.2] 67.9 [64.9 to 70.4] 68.9 [66.2 to 69.7] 0.91 FF-MA. mm [IQR] (reference range = 15-32) 42.2 [30.9 to 49.2] 39.1 [29.9 to 49.2] 43.7 [36.4 to 48.7] 0.44 CFF-A10 mm [IQR] (reference range = 15-30) 38.3 [28.4 to 44.4] 35.7 [27.4 to 44.4] 40.7 [33 to 43.4] 0.42 Data are expressed as median [Interquartile Range, IQR], Frequencies No. (%). DIC and SOFA scores are expressed as mean ± standard deviation (± SD). Abbreviations: OTI, orotracheal intubation; LAC, lactates; HR, heart rate; MAP, mean arterial pressure; DIC, disseminated intravascular coagulation; SOFA, sequential organ failure assessment; WBC, white blood cell; CRP, c-reactive protein; PCT, procalcitonin; LDH, lactate dehydrogenase; FIB, fibrinogen; AT, Antithrombin; D-dim, D-dimer; R, reaction time; K, coagulation time; ANG, angle; MA, maximum amplitude; CK, citrated recalcified kaolin-activated blood; rTEG, rapid thromboelastography; ACT, kaolin-activated clotting time; CRT, citrated recalcified kaolin and tissue factor activated blood; A10, amplitude 10 minutes after clotting time; CKH, citrated recalcified kaolin-activated blood treated with heparinase; FF, functional fibrinogen; CFF, citrated functional fibrinogen; LY30, the percentage decrease in amplitude at 30 minutes post-MA.
Discussion
Several reports have been published focusing
particularly on the impact of SARS-CoV-2 on
coagulation and thromboembolic complications.
Most of the published studies consist of local
experiences involving small cohorts of patients.
Nowadays, there is increasing interest regarding
the potential role of viscoelastic testing as an
es-sential diagnostic tool to better understand the
pathophysiology of COVID-19. Of thirteen
pub-lished studies, six
19-24chose ROTEM technology,
other six
12,14,25-27,40TEG
®5000, and only Salem et
al
41chose TEG
®6s to perform the viscoelastic
as-sessment. In this study, we use TEG
®6s, a novel
and validated device, to perform
thromboelas-tographic analysis in COVID-19 critically ill
patients. For the first time, a second assessment
at seven-days in 26 out of 40 patients, was
per-formed.
We found that TEG
®6s patterns of COVID-19
patients are characterized by an increased
am-plification phase (MA) in the functional
fibrino-gen analysis and an increase in angle values in
the rTEG. Activated clotting time (TEG-ACT) in
rTEG was also reduced
41. Elevated maximal clot
Figure 1. KDE, Frequency and Plot graphs. a-b: KDE plus Frequency and Plot graphs showing the distribution of the major-ity of rTEG-Ang and FF-MA values above the upper limits of the normal range. c: Frequency distribution and KDE showing the majority of frequency and density of ACT-TEG values below the lower limit of its normal range. Rt is equivalent to rTEG.firmness in functional fibrinogen analysis is
con-sistent with the results of previous studies where
ROTEM technology was adopted
19-22,27. Although
previous authors
42-46studying TEG profiles in
critically ill patients have proposed elevated
max-imum amplitude as a marker of
hypercoagulabil-ity, our results are not strong enough to suggest
the presence of an evident prothrombotic state.
Brill et al
47showed that a hypercoagulable
throm-boelastography, defined as low R, angle or MA
above the reference range, was associated with a
higher rate of DVT (15.6% vs. 8%; p = 0.039) in a
large study on trauma patients. The combination
of the three values was statistically significant
48.
Recently, Panigada et al
26analyzed CKH patterns
in a series of 24 patients and described a global
decrease in R and K values. However, consistent
with the findings by Salem et al
41where TEG
®6s
patterns in a population of 52 Sars-CoV-2 positive
patients were analyzed, we did not fully confirm
Panigada et al’s
26conclusions regarding CKH-R
and CKH-K, as they were in the normal range in
our population.
As already discussed by previous studies
20-23,
conventional coagulation tests and platelet count
were normal in our cohort of patients. Moreover,
plasma fibrinogen and D-dimer levels were
per-sistently increased above the reference range, and
LY30 remained 0%. Together, higher D-dimer
and fibrinogen levels, the absence of clot lysis at
30 minutes, and the observed increase in
maxi-mum amplitude, are hallmarks of a state of
im-paired fibrinolysis. In a recent study on trauma
pa-tients, Cotton et al
48on trauma patients, describe
a relation between fibrinolysis shutdown, a
pro-found alteration in fibrinolytic processes, and an
increased risk of thrombotic complications. This
evidence is also confirmed in the retrospective
analysis on 52 patients by Salem et al
41. In trauma
patients, high D-dimer levels and low LY30
al-ready represent criteria to define fibrinolysis
shut-down. Wright et al
14investigated on 44 COVID-19
patients to identify the patients at higher risk of
thromboembolic complications. They correlated
the thrombotic events with a complete fibrinolysis
shutdown, defined by LY30 of 0% and D-dimer
levels > 2600 ng·ml
-1. In our study, the population
with the worst outcome at 28 days presented a
complete fibrinolysis shutdown, according to and
in agreement of the criteria suggested by Wright
et al
14,
with an LY30 of 0% and a median D-dimer
level of 3762 ng·ml
-1(IQR 1464 to 6045).
Different hypotheses have been made to
ex-plain high D-dimer levels in SARS-CoV-2
infec-tion. Some authors
49suggest that, due to the long
half-life of D-dimer, they do not reflect the current
fibrinolytic activity. Gall et al
50hypothesized that
low fibrinolysis with high D-dimer levels reflects
a fibrinolytic process that is not measurable by
viscoelastic methods, what they called an “occult
hyperfibrinolysis”. Ibañez et al
19proposed a third
hypothesis: intra-alveolar fibrin deposition is a
common finding in COVID-19 pneumonia and,
due to the alveolar damage, alveolar epithelial
Figure 2. TEG®6s parameters at admission and seven-day follow-up. Box-and-whisker plots at admission to ICU and atsev-en-day follow up of rTEG-Ang, FF-MA and ACT-TEG in the study population. Dotted lines indicate upper and lower reference ranges. Rt is equivalent to rTEG.
cells could be induced to produce urokinase. This
determines that the lungs could be the potential
source of D-dimer, coexisting with the systemic
hypofibrinolytic state.
Although D-dimer was high, contrary to the
study by Tang et al
51and consistently with other
experiences, DIC score per ISTH criteria remain
lower than 4, with no evidence for consumption
coagulopathy
12,14,19,23-25.
Our results support the hypothesis presented
by Yuriditsky et al
25that fibrinogen and platelet
have a massive impact on the
thromboelastogra-phy profiles in COVID-19 syndrome. It is crucial
to better understand if conventional
anticoagu-lation can be useful to prevent thromboembolic
events. All the patients included in this study
re-ceived full-dose systemic anticoagulant from ICU
admission (Enoxaparin 0.5 mg·kg
-1subcutaneous
twice daily, unfractionated Heparin 7500 units
subcutaneously three times daily, or
low-intensi-ty heparin infusion). No changes were found in
conventional coagulation teats or TEG variables,
after seven days of anticoagulant therapy.
Nougier et al
21investigated fibrinolytic activity
and thrombin generation in 48 COVID-19
crit-ically ill patients. In their brief report, they
hy-pothesized that the coagulopathy could be due to a
type of major inflammatory syndrome, in light of
high levels of fibrinogen and Factor VIII. At
sev-en-day follow-up, we found a significant increase
in white blood cell count, lymphocyte count and
platelet count (Table III). Immunomodulatory
ef-fect of anticoagulants has been discussed in the
literature, and we cannot exclude that the increase
in circulating blood cells could be due to UFH or
LMWH
52.
COVID-19 viscoelastic profiles appear
compa-rable to those obtained from patients affected by
the chronic inflammatory disease, and this is also
supported by the evidence of an increase in
mark-ers of systemic inflammation, such as platelet
count and D-dimer levels at seven-day follow-up.
To detect this, Turk et al
53investigated the
pres-ence of a prothrombotic state in patients affected
by chronic inflammatory syndromes and also
de-scribed a higher incidence of thrombotic arterial
and venous events.
Klok et al
11and Shah et al
12reported, in
COVID-19 patients, a rate of thrombotic events of
31% and 43.3%, respectively. We observed only
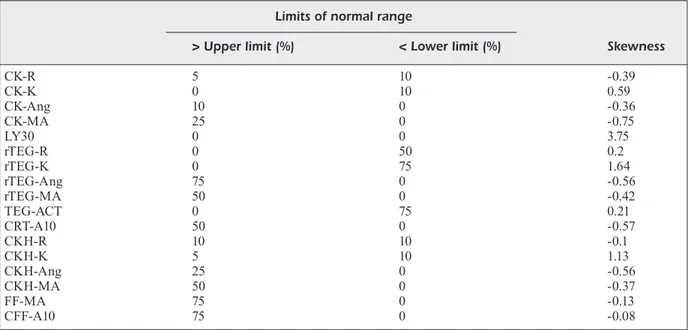
Table II. Percentages of observed values above upper limits or below lower limits. Limits of normal range
> Upper limit (%) < Lower limit (%) Skewness
CK-R 5 10 -0.39 CK-K 0 10 0.59 CK-Ang 10 0 -0.36 CK-MA 25 0 -0.75 LY30 0 0 3.75 rTEG-R 0 50 0.2 rTEG-K 0 75 1.64 rTEG-Ang 75 0 -0.56 rTEG-MA 50 0 -0.42 TEG-ACT 0 75 0.21 CRT-A10 50 0 -0.57 CKH-R 10 10 -0.1 CKH-K 5 10 1.13 CKH-Ang 25 0 -0.56 CKH-MA 50 0 -0.37 FF-MA 75 0 -0.13 CFF-A10 75 0 -0.08
Negative skewness indicates a left shift of data distribution above upper limits of normal range; positive skewness indicates a right shift of values’ distribution below lower limits of normal range. Abbreviations: R, reaction time; K, coagulation time; ANG, angle; MA, maximum amplitude; CK, citrated recalcified kaolin-activated blood; rTEG, rapid thromboelastography; ACT, activated clotting time; CRT, citrated recalcified kaolin and tissue factor activated blood; A10, amplitude 10 minutes after clotting time; CKH, citrated recalcified kaolin-activated blood treated with heparinase; FF, functional fibrinogen; CFF, citrated functional fibrinogen; LY30, the percentage decrease in amplitude at 30 minutes post-MA.
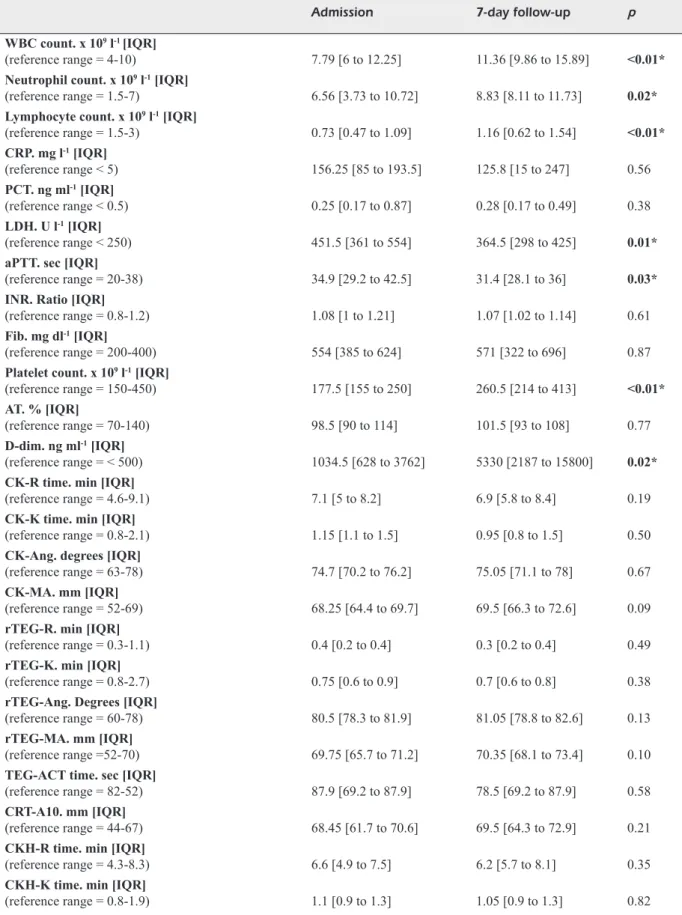
Table III. Laboratory characteristics of the study population assessed at admission and seven-day follow-up (n=26). Admission 7-day follow-up p
WBC count. x 109 l-1 [IQR]
(reference range = 4-10) 7.79 [6 to 12.25] 11.36 [9.86 to 15.89] <0.01* Neutrophil count. x 109 l-1 [IQR]
(reference range = 1.5-7) 6.56 [3.73 to 10.72] 8.83 [8.11 to 11.73] 0.02* Lymphocyte count. x 109 l-1 [IQR]
(reference range = 1.5-3) 0.73 [0.47 to 1.09] 1.16 [0.62 to 1.54] <0.01* CRP. mg l-1 [IQR] (reference range < 5) 156.25 [85 to 193.5] 125.8 [15 to 247] 0.56 PCT. ng ml-1 [IQR] (reference range < 0.5) 0.25 [0.17 to 0.87] 0.28 [0.17 to 0.49] 0.38 LDH. U l-1 [IQR] (reference range < 250) 451.5 [361 to 554] 364.5 [298 to 425] 0.01* aPTT. sec [IQR]
(reference range = 20-38) 34.9 [29.2 to 42.5] 31.4 [28.1 to 36] 0.03* INR. Ratio [IQR]
(reference range = 0.8-1.2) 1.08 [1 to 1.21] 1.07 [1.02 to 1.14] 0.61 Fib. mg dl-1 [IQR]
(reference range = 200-400) 554 [385 to 624] 571 [322 to 696] 0.87 Platelet count. x 109 l-1 [IQR]
(reference range = 150-450) 177.5 [155 to 250] 260.5 [214 to 413] <0.01* AT. % [IQR]
(reference range = 70-140) 98.5 [90 to 114] 101.5 [93 to 108] 0.77 D-dim. ng ml-1 [IQR]
(reference range = < 500) 1034.5 [628 to 3762] 5330 [2187 to 15800] 0.02* CK-R time. min [IQR]
(reference range = 4.6-9.1) 7.1 [5 to 8.2] 6.9 [5.8 to 8.4] 0.19 CK-K time. min [IQR]
(reference range = 0.8-2.1) 1.15 [1.1 to 1.5] 0.95 [0.8 to 1.5] 0.50 CK-Ang. degrees [IQR]
(reference range = 63-78) 74.7 [70.2 to 76.2] 75.05 [71.1 to 78] 0.67 CK-MA. mm [IQR]
(reference range = 52-69) 68.25 [64.4 to 69.7] 69.5 [66.3 to 72.6] 0.09 rTEG-R. min [IQR]
(reference range = 0.3-1.1) 0.4 [0.2 to 0.4] 0.3 [0.2 to 0.4] 0.49 rTEG-K. min [IQR]
(reference range = 0.8-2.7) 0.75 [0.6 to 0.9] 0.7 [0.6 to 0.8] 0.38 rTEG-Ang. Degrees [IQR]
(reference range = 60-78) 80.5 [78.3 to 81.9] 81.05 [78.8 to 82.6] 0.13 rTEG-MA. mm [IQR]
(reference range =52-70) 69.75 [65.7 to 71.2] 70.35 [68.1 to 73.4] 0.10 TEG-ACT time. sec [IQR]
(reference range = 82-52) 87.9 [69.2 to 87.9] 78.5 [69.2 to 87.9] 0.58 CRT-A10. mm [IQR]
(reference range = 44-67) 68.45 [61.7 to 70.6] 69.5 [64.3 to 72.9] 0.21 CKH-R time. min [IQR]
(reference range = 4.3-8.3) 6.6 [4.9 to 7.5] 6.2 [5.7 to 8.1] 0.35 CKH-K time. min [IQR]
(reference range = 0.8-1.9) 1.1 [0.9 to 1.3] 1.05 [0.9 to 1.3] 0.82 Table continued
two cases of pulmonary embolism, and no
evi-dence of deep venous thrombosis was found.
However, some limitations of this study should
be noted. First, this is a small single-center study.
Despite the fact that we enrolled consecutive
pa-tients trying to avoid possible selection bias, the
number remains limited. We observed a lower
incidence of thromboembolic events, and this can
be due mainly to the fact that we do not perform
routinely computed tomography pulmonary
an-giogram or ultrasound assessments. On the other
hand, our cohort of patients was limited compared
to the population included in the study by Klok et
al
11and Shah et al
12. We could not compare the
re-sults with a control group, and only in 26 patients
the follow-up analysis was available. TEG
®6s
al-lows easily to perform more tests with a single
blood sample and a single cartridge, eliminating
the bias of the pre-analytic phase but has got limits.
As seen in the study published by Lloyd-Donald et
al
32TEG
®6s and TEG
®5000 are interchangeable,
except for some apparent bias in MA (difference
5.2 mm) and difference in LY30 (0.61%).
Conclusions
TEG
®6s, a novel device, allowed us to study
the fibrinogen contribution to clot formation
through TEG functional fibrinogen, an essential
tool that is not available using TEG
®5000. For
the first time we assessed the impact of a
full-dose systemic anticoagulation on viscoelastic
parameters. An integrated approach allows the
identification of fibrinolysis shutdown in the
early phases of the infectious disease. This
pat-tern is not characterized by platelet, fibrinogen,
and coagulation factors consumption that are
typical of DIC. On the contrary,
hypofibrino-lysis together with increased D-dimer values
are typical hallmarks of this disease. Whether
these abnormalities are predictive for
throm-botic events as part of an inflammatory process
is an interesting hypothesis which needs
fur-ther ad hoc designed studies. Chow et al
54, in a
recent large retrospective study, suggested that
aspirin use may be associated with improved
outcomes in hospitalized COVID-19 patients.
Unfortunately, we have no data on the effects
of routinely given antiplatelets medications in
COVID-19 syndrome in our center. As a
conse-quence, there is a great need to investigate the
effect of antiplatelets and other antithrombotic
medications, as low molecular weight heparin
and unfractionated heparin show no effects.
Ethics Approval and Consent to Participate
The study protocol was approved by the local review board (Ethics Committee at Fondazione Policlinico Universitar-io A. Gemelli IRCCS, protocol id number 3146), and in-formed consent was obtained for each individual enrolled in the study.Conflict of Interest
The Authors declare that they have no conflict of interests. Data are expressed as median [Interquartile Range, IQR]. Abbreviations: WBC, white blood cell; CRP, c-reactive protein; PCT, procalcitonin; LDH, lactate dehydrogenase; FIB, fibrinogen; AT, Antithrombin; D-dim, D-dimer; R, reaction time; K, coagulation time; ANG, angle; MA, maximum amplitude; LY30, percentage of lysis 30 minutes after MA was finalized; CK, citrated recalcified kaolin-activated blood; RT, rapid thromboelastography; ACT, activated clotting time; CRT, citrated recalcified kaolin and tissue factor activated blood; A10, amplitude 10 minutes after clotting time; CKH, citrated recalcified kaolin-activated blood treated with heparinase; FF, functional fibrinogen; CFF, citrated functional fibrinogen.
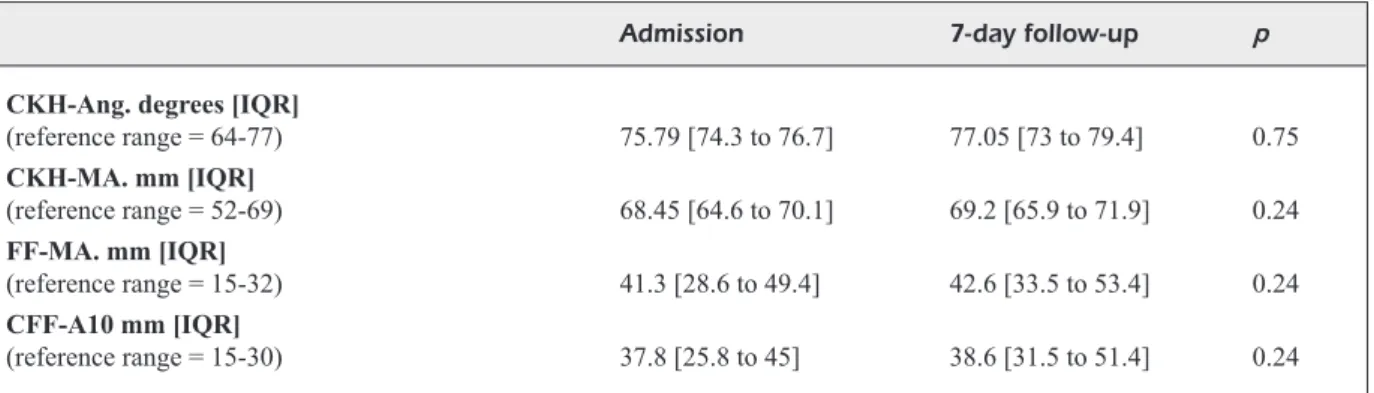
Table III. (Conintued). Laboratory characteristics of the study population assessed at admission and seven-day follow-up (n=26).
Admission 7-day follow-up p
CKH-Ang. degrees [IQR]
(reference range = 64-77) 75.79 [74.3 to 76.7] 77.05 [73 to 79.4] 0.75 CKH-MA. mm [IQR] (reference range = 52-69) 68.45 [64.6 to 70.1] 69.2 [65.9 to 71.9] 0.24 FF-MA. mm [IQR] (reference range = 15-32) 41.3 [28.6 to 49.4] 42.6 [33.5 to 53.4] 0.24 CFF-A10 mm [IQR] (reference range = 15-30) 37.8 [25.8 to 45] 38.6 [31.5 to 51.4] 0.24
Funding
No funding support was received towards this work.
Authors’ Contributions
MGB, LMC, CG, and LP designed the study, developed the protocol and drafted the first version of the manuscript; LM, SLC and GM provided professional input on the protocol development and methodology; RM, DLG, DGB performed the statistical analysis; ED and SC provided professional ex-pertise in the analysis of TEG®6s results; DN, RR, GN, FF and MA provided professional expertise in the writing pro-cess of the paper and in the critical analysis of the results. All authors comply with the ICMJE recommendations: a) all authors provided a substantial contribution to concep-tion and design, acquisiconcep-tion of data, or analysis and inter-pretation of data; b) all authors drafted the article or revised it critically for important intellectual content; c) all authors have given final approval of the version to be published, and d) all authors agreed to be accountable for all aspects of the work thereby ensuring that questions related to the accura-cy or integrity of any part of the work are appropriately in-vestigated and resolved..
Acknowledgements
Thanks to Mirjana Rasovic and Zanij Noruzi for revising the manuscript for the English language.
References
1) Mousavizadeh L, GhaseMi s. Genotype and pheno-type of COVID-19: their roles in pathogenesis. J Microbiol Immunol Infect 2020 Mar 31. doi: 10.1016/j.jmii.2020.03.022. Online ahead of print. 2) zhu N, zhaNG d, WaNG W, Li X, YaNG B, soNG J,
zhao X, huaNG B, shi W, Lu R, Niu P, zhaN F, Ma X, WaNG d, Xu W, Wu G, Gao GF, TaN W. a novel Coronavirus from patients with pneumonia in Chi-na, 2019. N Engl J Med 2020; 382: 727-733. 3) ToMasheFski JF JR, davies P, BoGGis C, GReeNe R, zaPoL
WM, Reid LM. The pulmonary vascular lesions of the adult respiratory distress syndrome. Am J Pathol 1983; 112: 112-126.
4) FuNG sY, YueN ks, Ye zW, ChaN CP, JiN dY. A tug-of-war between severe acute respiratory syndrome coronavirus 2 and host antiviral defence: lessons from other pathogenic viruses. Emerg Microbes Infect 2020; 9: 558-570.
5) RoBRiqueT L, GueRY B, FouRRieR F. Pulmonary coag-ulopathy as a new target in therapeutic studies of acute lung injury or pneumonia. Crit Care Med 2006; 34: 2510-2511.
6) YiN s, huaNG M, Li d, TaNG N. Difference of co-agulation features between severe pneumonia induced by SARS-CoV2 and non-SARS-CoV2. J Thromb Thrombolysis 2020; 1-4. doi: 10.1007/ s11239-020-02105-8. Online ahead of print.
7) aNGus dC, vaN deR PoLL T. Severe sepsis and septic shock. N Engl J Med 2013; 369: 840-851. 8) BakhTiaRi k, MeiJeRs JC, de JoNGe e, Levi M.
Pro-spective validation of the International Society of Thrombosis and Haemostasis scoring system for disseminated intravascular coagulation. Crit Care Med 2004; 32: 2416-2421.
9) osTRoWski sR, WiNdeLøv Na, iBseN M, haase N, PeRN-eR a, JohaNssoN Pi. Consecutive thrombelastogra-phy clot strength profiles in patients with severe sepsis and their association with 28-day mortali-ty: a prospective study. J Crit Care 2013; 28: 317. e1-11. doi: 10.1016/j.jcrc.2012.09.003.
10) GRasseLLi G, ToNeTTi T, PRoTTi a, LaNGeR T, GiRaRdis M, BeLL aNi G, LaFFeY J, CaRRaFieLLo G, CaRsaNa L, RizzuTo C, zaNeLL a a, sCaRaviLLi v, PizziLLi G, GRie-Co dL, di MeGLio L, de PasCaLe G, LaNza e, MoNTe-duRo F, zoMPaToRi M, FiLiPPiNi C, LoCaTeLLi F, CeCCo-Ni M, FuMaGaLLi R, Nava s, viNCeNT JL, aNToNeLLi M, sLuTskY as, PeseNTi a, RaNieRi vM; collaborators. Pathophysiology of COVID-19-associated acute respiratory distress syndrome: a multicentre prospective observational study. Lancet Respir Med 2020; S2213-2600(20)30370-2.
11) kLok Fa, kRuiP MJha, vaN deR MeeR NJM, aRBous Ms, GoMMeRs daMPJ, kaNT kM, kaPTeiN FhJ, vaN PaasseN J, sTaLs MaM, huisMaN Mv, eNdeMaN h. In-cidence of thrombotic complications in critically ill ICU patients with COVID-19. Thromb Res 2020; 91: 145-147.
12) shah a, doNovaN k, MChuGh a, PaNdeY M, aaR-oN L, BRadBuRY Ca, sTaNWoRTh sJ, aLikhaN R, vaaR-oN kieR s, MaheR k, CuRRY N, shaPiRo s, RoWLaNd MJ, ThoMas M, MasoN R, hoLLaNd M, hoLMes T, WaRe M, GuRNeY s, MCkeChNie sR. Thrombotic and haemor-rhagic complications in critically ill patients with COVID-19: a multicentre observational study. Crit Care 2020; 24: 561.
13) MaaTMaN Tk, JaLaLi F, FeizPouR C, douGLas a 2Nd, MC-GuiRe sP, kiNNaMaN G, haRTWeLL JL, MaaTMaN BT, kReuTz RP, kaPooR R, RahMaN o, zYRoMski NJ, Mea-GheR ad. Routine venous thromboembolism pro-phylaxis may be inadequate in the hypercoagu-lable state of severe Coronavirus disease 2019. Crit Care Med 2020; 48: e783-e790. doi: 10.1097/ CCM.0000000000004466.
14) WRiGhT FL, voGLeR To, MooRe ee, MooRe hB, WohLaueR Mv, uRBaN s, NYdaM TL, MooRe Pk, MCiN-TYRe RC JR. Fibrinolysis shutdown correlation with thromboembolic events in severe COVID-19 in-fection. J Am Coll Surg 2020; 231: 193-203. 15) JohaNssoN Pi, sTeNsBaLLe J, viNdeLøv N, PeRNeR a,
esPeRseN k. Hypocoagulability as evaluated by thrombelastography, at admission to the ICU is associated with increased 30-day mortality. Blood Coagul Fibrinolysis 2010; 21: 168-174. 16) MüLLeR MC, MeiJeRs, JCM, vRooM MB, JuFFeRMaNs
NP. Utility of thromboelastography and/or throm-boelastometry in adults with sepsis: a systematic review. Crit Care 2014; 18: R30.
17) haase N, osTRoWski sR, WeTTeRsLev J, LaNGe T, MøLLeR Mh, Tousi h, sTeeNseN M, PoTT F, søe-JeNseN P, NieLseN J,
hJoRTRuP PB, JohaNssoN Pi, PeRNeR a. Thromboelastog-raphy in patients with severe sepsis: a prospective cohort study. Intensive Care Med 2014; 41: 77-85. 18) CeCCoNi M, evaNs L, LevY M, Rhodes a. Sepsis and
septic shock. Lancet 2018; 392: 75-87.
19) iBañez C, PeRdoMo J, CaLvo a, FeRRaNdo C, ReveRTeR JC, Tassies d, BLasi a. High D dimers and low global fibri-nolysis coexist in COVID19 patients: what is going on in there? J Thromb Thrombolysis 2020; 1-5. doi: 10.1007/s11239-020-02226-0. Online ahead of print. 20) CoLLeTT LW, GLuCk s, sTRiCkLaNd RM, Reddi BJ.
Eval-uation of coagulation status using viscoelastic testing in intensive care patients with coronavi-rus disease 2019 (COVID-19): an observation-al point prevobservation-alence cohort study. Aust Crit Care 2020; S1036-7314(20)30254-X. doi: 10.1016/j. aucc.2020.07.003. Online ahead of print.
21) NouGieR C, BeNoiT R, siMoN M, desMuRs-CLaveL h, MaRCoTTe G, aRGaud L, david Js, BoNNeT a, NeGRi-eR C, daRGaud Y. Hypofibrinolytic state and high thrombin generation may play a major role in SARS-COV2 associated thrombosis. J Thromb Haemost 2020; 10.1111/jth.15016. doi: 10.1111/ jth.15016. Online ahead of print.
22) CoRRêa Td, CoRdioLi RL, CaMPos GueRRa JC, CaLdiN da siLva B, dos Reis RodRiGues R, de souza GM, MideGa T, CaMPos N, CaRNeiRo B, CaMPos F, GuiMaRaes h, Ma-Tos G, aRaNda v, FeRRaz L. The hypercoagulability state of COVID-19 ICU patients is characterized by impaired endogenous anticoagulation and de-creased fibrinolysis. Research Square 2020; doi: 10.21203/rs.3.rs-47465/v1.
23) PavoNi v, GiaNeseLLo L, Pazzi M, sTeRa C, MeCoNi T, FRiGieRi FC. Evaluation of coagulation function by rotation thromboelastometry in critically ill patients with severe COVID-19 pneumonia. J Thromb Thrombolysis 2020; 50: 281-286.
24) sPiezia L, BosCoLo a, PoLeTTo F, CeRRuTi L, TiBeRio i, CaMPeLLo e, NavaLesi P, siMioNi P. COVID-19-related severe hypercoagulability in patients admitted to Intensive Care Unit for acute respiratory failure. Thromb Haemost 2020; 120: 998-1000.
25) YuRidiTskY e, hoRoWiTz JM, MeRChaN C, ahuJa T, BRosNahaN sB, MCvoY L, BeRGeR Js. Thromboelas-tography profiles of critically ill patients with Coro-navirus disease 2019. Crit Care Med 2020; 48: 1319-1326.
26) PaNiGada M, BoTTiNo N, TaGLiaBue P, GRasseLLi G, No-veMBRiNo C, ChaNTaRaNGkuL v, PeseNTi a, PeYvaNdi F, TRiPodi a. Hypercoagulability of COVID-19 patients in Intensive Care Unit. A report of thromboelas-tography findings and other parameters of hemo-stasis. J Thromb Haemost 2020; 1738-1742. 27) MoRTus JR, MaNek se, BRuBakeR Ls, LooR M, CRuz
Ma, TRauTNeR BW, RoseNGaRT Tk. Thromboelasto-graphic results and hypercoagulability syndrome in patients with Coronavirus disease 2019 who are critically ill. JAMA Netw Open 2020; 3: e2011192. 28) quaRTeRMaN q, shaW M, JohNsoN i, aGaRWaL s. Intra-
and inter-centre standardization of thromboelas-tography (TEG®). Anaesthesia 2014; 69: 883-890.
29) BLasio e, PeLLeGRiNi C, FedeRiCo a, RoCCo v, FuMi M, PaNCioNe Y, saLe s, LiBeRTi d. Coagulation support algorithm with rapid TEG and functional fibrin-ogen TEG in critical bleeding: more results and less time. Crit Care 2015; 19: P352.
30) haNs Ga, BesseR MW. The place of viscoelastic testing in clinical practice. Br J Haematol 2016; 173: 37-48.
31) GuRBeL Pa, BLideN kP, TaNTRY us, MoNRoe aL, MuRe-saN aa, BRuNNeR Ne, LoPez-esPiNa CG, deLMeNiCo PR, CoheN e, Raviv G, hauGeN dL, eReTh Mh. First re-port of the point-of-care TEG: A technical valida-tion study of the TEG-6S system. Platelets 2016; 27: 642-649.
32) LLoYd-doNaLd P, ChuRiLov L, zia F, BeLLoMo R, haRT G, MCCaLL P, MåRTeNssoN J, GLassFoRd N, WeiNBeRG L. Assessment of agreement and interchangeability between the TEG5000 and TEG6S thromboelas-tography haemostasis analyzers: a prospective validation study. BMC Anesthesiol 2019; 19: 45. 33) aRds deFiNiTioN Task FoRCe, RaNieRi vM, RuBeNFeLd
Gd, ThoMPsoN BT, FeRGusoN Nd, CaLdWeLL e, FaN e, CaMPoRoTa L, sLuTskY as. Acute respiratory distress syndrome: the Berlin Definition. JAMA 2012; 307: 2526-2533.
34) TaYLoR FB, Toh Ch, hooTs Wk, Wada h, Levi M. Scientific Subcommittee on Disseminated Intra-vascular Coagulation (DIC) of the International Society on Thrombosis and Haemostasis (ISTH). Towards definition, clinical and laboratory criteria, and a scoring system for disseminated intravas-cular coagulation. Thromb Haemost 2001; 86: 1327-1330.
35) Toh Ch, hooTs Wk. SSC on Disseminated In-travascular Coagulation of the ISTH. The scor-ing system of the Scientific and Standardisation Committee on Disseminated Intravascular Coag-ulation of the International Society on Thrombosis and Haemostasis: a 5-year overview. J Thromb Haemost 2007; 5: 604-606.
36) viNCeNT JL, MoReNo R, TakaLa J, WiLLaTTs s, de MeN-doNça a, BRuiNiNG h, ReiNhaRT Ck, suTeR PM, ThiJs LG. The SOFA (Sepsis-related Organ Failure As-sessment) score to describe organ dysfunction/ failure. Intensive Care Med 1996; 22: 707-710. 37) BaRNes Gd, BuRNeTT a, aLLeN a, BLuMeNsTeiN M, CLaRk
NP, CukeR a, daGeR We, deiTeLzWeiG sB, eLLsWoRTh s, GaRCia d, kaaTz s, MiNiChieLLo T. Thromboembolism and anticoagulant therapy during the COVID-19 pan-demic: interim clinical guidance from the anticoagula-tion forum. J Thromb Thrombol 2020; 50: 72-81. 37) ChaudhaRY R, kReuTz RP, BLideN kP, TaNTRY us,
GuR-BeL Pa. Personalizing antithrombotic therapy in COVID-19: role of thromboelastography and throm-boelastometry. Thromb Haemost 2020 Jul 17; doi: 10.1055/s-0040-1714217. Online ahead of print. 39) JuLious sa. Sample size of 12 per group rule of
thumb for a pilot study. Pharmaceutical Statistics. 2005; 4: 287-291.
40) sadd C, RoWe T, NazeeF M, koRY P, suLTaN s, FausT h. Thromboelastography to detect
hypercoagula-bility and reduced fibrinolysis in Coronavirus dis-ease 2019 acute respiratory distress syndrome patients. Crit Care Explor 2020; 2: e0192.
41) saLeM N, aTaLLah B, eL NekidY Ws, sadik zG, PaRk WM, MaLLaT J. Thromboelastography findings in critically ill COVID-19 patients. J Thromb Throm-bolysis 2020: 1-5. doi:10.1007/s11239-020-02300-7. Online ahead of print.
42) osTRoWski sR, WiNdeLov Na, iBseN M, haase N, PeR-NeR a, JohaNssoN Pi. Consecutive thromboelastog-raphycclot strength profiles in patients with severe sepsis and their association with 28-day mortality: a prospective study. J Crit Care 2013; 28: 317.e1-11. 43) haLseT Jh, haNsseN sW, esPiNosa a, kLePsTad P. Throm-boelastography. Variability and relation to conven-tional coagulation tests in non-bleeding intensive care unit patients. BMC Anesthesiol 2015; 15: 28. 44) CRoCheMoRe T, CoRRêa Td, LaNCe Md, soLoMoN
C, NeTo as, de CaMPos GueRRa JC, LeLLis Ps, BeRNz LM, NuNes N, MaNCio CM, YokoYaMa aPh, siLva e. Thromboelastometry profile in critically ill pa-tients: A single-center, retrospective, observation-al study. PLoS One 2018; 13: e0192965.
45) MCCRaTh dJ, CeRBoNi e, FRuMeNTo RJ, hiRsh aL, BeN-NeTT-GueRReRo e. Thromboelastography maximum amplitude predicts postoperative thrombotic com-plications including myocardial infarction. Anesth Analg 2005; 100: 1576e1583.
46) haRahsheh Y, duFF oC, ho kM. Thromboelastogra-phy predicts thromboembolism in critically ill coagu-lopathic patients. Crit Care Med 2019; 47: 826-832. 47) BRiLL JB, Badiee J, zaNdeR aL, WaLLaCe Jd, LeWis
PR, sise MJ, BaNsaL v, shaCkFoRd sR. The rate of deep vein thrombosis doubles in trauma patients with hypercoagulable thromboelastography. J Trauma Acute Care Surg 2017; 83: 413-419. 48) CoTToN Ba, MiNei kM, RadWaN za, MaTiJeviC N,
PivaLiz-za e, PodBieLski J, Wade Ce, koPivaLiz-zaR Ra, hoLCoMB JB.
Ad-mission rapid thrombelastography predicts devel-opment of pulmonary embolism in trauma patients. J Trauma Acute Care Surg 2012; 72: 1470-1475. 49) RühL h, BeReNs C, WiNTeRhaGeN a, MüLLeR J,
oLdeN-BuRG J, PöTzsCh B. Label-free kinetic studies of he-mostasis-related biomarkers including D-Dimer using autologous serum transfusion. PLoS One 2015; 10: e0145012.
50) GaLL Ls, vuLLiaMY P, GiLLesPie s, JoNes TF, PieRRe RsJ, BReukeRs se, GaaRdeR C, JuFFeRMaNs NP, MaeGeLe M, sTeNsBaLLe J, JohaNssoN Pi, daveNPoRT Ra, BRohi k. The S100A10 pathway mediates an occult hyper-fibrinolytic subtype in trauma patients. Ann Surg 2019; 269: 1184-1191.
51) TaNG N, Li d, WaNG X, suN z. Abnormal coagulation parameters are associated with poor prognosis in patients with novel coronavirus pneumonia. J Thromb Haemost 2020; 18: 844-847.
52) Li, Xu, Ma, XiaoChuN. The role of heparin in sepsis: much more than just an anticoagulant. Br J Hae-matol 2017; 179: 389-398.
53) TüRk sM, CaNsu dü, Teke hü, kaşiFoğLu T, akaY oM, BiLGiM M, koRkMaz C. Can we predict thrombotic tendency in rheumatoid arthritis? A thromboelas-tographic analysis (with ROTEM). Clin Rheumatol 2018; 37: 2341-2349.
54) ChoW Jh, khaNNa ak, keThiReddY s, YaMaNe d, LeviNe a, JaCksoN aM, MCCuRdY MT, TaBaTaBai a, kuMaR G, PaRk P, BeNJeNk i, MeNakeR J, ahMed N, GLideWeLL e, PResuTTo e, CaiN s, haRidasa N, FieLd W, FoWLeR JG, TRiNh d, JohNsoN kN, kauR a, Lee a, seBasTiaN k, uLRiCh a, Peña s, CaRPeNTeR R, sudhakaR s, uPPaL P, FedeLes BT, saChs a, dahBouR L, TeeTeR W, TaNaka k, GaLvaGNo sM, heRR dL, sCaLea TM, MazzeFFi Ma. Aspirin use is associated with de-creased mechanical ventilation, ICU admission, and in-hospital mortality in hospitalized patients with COVID-19. Anesth Analg 2020; doi: 10.1213/ ANE.0000000000005292. Online ahead of print.