Preliminary thermomechanical analysis of the ALFRED fuel
element – Part 2
Descrittori
Tipologia del documento: Rapporto Tecnico
Collocazione contrattuale: Accordo di programma ENEA-MiSE su sicurezza nucleare e reattori di IV generazione
Argomenti trattati: Reattori nucleari veloci, Tecnologia dei reattori nucleari
Sommario
As a prosecution of the activities on the advancement and refinement of the ALFRED (Advanced Lead-cooled Fast Reactor European Demonstrator) core design, a new line of activities was launched to tackle the thermomechanical aspects of the design. Being a long-term plan, for the first year the activities are focused on the vibrational analysis of the ALFRED fuel pin, with the final aim of developing a sound approach for driving the design and positioning of spacer grids along the bundle of fuel pins so as to prevent detrimental effects possibly due to flow-induced vibrations.
The present report describes the dynamic behavior of a single pin immersed in liquid lead, aimed at investigating possible resonances with the vibrations induced by the fluid.
The study was then extended to a group of seven pins immersed in lead, in order to highlight the mutual influence when they are submitted to a dynamic load. This work is the continuation of the work presented in ADPFISS - LP2 - 140
Note
Autori: A. Poggianti (ENEA)
Copia n. In carico a:
2 NOME
FIRMA
1 NOME
FIRMA
0 EMISSIONE 27/11/2018 NOME A. Poggianti M.Tarantino M. Tarantino FIRMA
Table of Contents
Table of Contents ... 2
1. Introduction ... 3
2. Pin Finite Element Model ... 4
3. Modal analysis ... 7
4. Dynamic analysis of the single pin ... 8
5. Dynamic analysis of the pin immersed in fluid ... 14
6. Dynamic analysis of a group of pins immersed in fluid ... 21
7. Conclusion and next step ... 30
1. Introduction
This work is aimed at investigating the dynamic characteristic of the ALFRED fuel pins immersed into liquid lead, using a Finite Element Model that was implemented in the Abaqus code.
Abaqus [1] is a suite of powerful engineering simulation programs, based on the finite elements method that can solve problems ranging from relatively simple linear analyses to the most challenging nonlinear simulations. Abaqus contains an extensive library of elements that can model virtually any geometry. It has an equally extensive list of material models that can simulate the behavior of most typical engineering materials. Designed as a general-purpose simulation tool, Abaqus can be used to study more than just structural (stress/displacement) problems. It can simulate problems in such diverse areas as heat transfer, mass diffusion, thermal management of electrical components (coupled thermal-electrical analyses), acoustics, soil mechanics (coupled pore fluid-stress analyses), piezoelectric analysis and fluid dynamics.
In the first part of the present work [2], a modal analysis on the single pin was performed in order to study its dynamic characteristic: natural frequencies and modal shapes. The behavior of the pin immersed in liquid lead at 440°C is then studied to simulate the environmental condition inside the core: natural frequencies and dynamic behavior are again computed and compared with the behavior of the pin immersed in air and water, in order to highlight the influence of the presence of the lead. Then a group of seven pin was modelled to check the influence of neighboring pins on the vibration of a reference one. In this work the higher vibration modes are investigates using a different approach, based on the Fourier analysis, in order to check if possible resonance with the vibration induced by the coolant fluid flow can occur.
These steps are propaedeutic to future work, aimed at the simulation of the entire assembly (127 pins and wrapper) to support the design of the pins support system.
All the geometrical and material data used in this study refer to the available version of the ALFRED core, as taken from [3].
All the analyses were performed using the co-simulation technique provided by Abaqus. The co-simulation technique is a capability for run-time coupling Abaqus analyses each other. The Abaqus co-simulation technique indeed can solve complex fluid-structure interaction (FSI) problems – as those of interest in the present study – by coupling Abaqus/Standard to Abaqus/CFD (a computational fluid dynamics (CFD) analysis program) for the simultaneous solution of the structural domain (Abaqus/Standard) and of the fluid domain (Abaqus/CFD).
2. Pin Finite Element Model
A finite element model (FEM) of the ALFRED pin was implemented using shell elements with the same thickness of the fuel cladding (Figure 1).
Figure 1 – Schematic view of the ALFRED fuel pin (not in scale). The description of the pin reported below is extracted from [3].
The overall length of the ALFRED fuel pin is 145.0 cm. From the outside, the fuel pin is made of a cylindrical cladding tube, sealed at both ends with caps. Within the fuel pin, from the bottom to the top are found:
a cylindrical tube, concentric to the cladding, defining the volume of the gas plenum and sustaining all other internal components;
a cylindrical pellet of thermally-insulating material, to protect the plenum tube from excessive temperatures;
a stack of fuel pellets, representing the active region;
a cylindrical pellet of thermally-insulating material, identical to the lower one, to protect the above structures from excessive temperatures;
a spring, to maintain all internal components in position while allowing their differential thermal expansion with respect to the cladding tube.
Figure 2 - Cross-section of the cladding tube (quotes in [mm], from [1]).
The cladding tube (Figure 2) has an inner diameter of 9.3 mm and a thickness of 0.6 mm, leading to an outer diameter of 10.5 mm. The material of the cladding tube is an advanced austenitic stainless steel of class “15-15Ti”.
The cladding tube is sealed by caps welded at both its ends. Both caps also have the function of connecting the fuel pin to the lower and upper support grids so as to form the bundle.
Both caps are entirely made of an advanced austenitic stainless steel of class “15-15Ti”. The overall length of both caps is 5 cm.
The plenum for collecting the gaseous fission products is defined by a dummy tube (Figure 3) sustaining the stack of fuel and insulator pellets. The tube is 0.5 mm thick, with an inner diameter of 7.0 mm, hence an outer diameter of 8.0 mm. The length of the tube is 550.0 mm. The tube is made of an advanced austenitic stainless steel of class “15-15Ti”.
Figure 3 - Cross-sections of the plenum tube (quotes in [mm]).
The active region is made by a stack of hollowed, cylindrical fuel pellets made of mixed uranium-plutonium oxide. The outer pellet diameter is 9.0 mm, a cylindrical hollow, 2.0 mm in diameter, is also made, coaxial with the pellet itself. A 3D representation and a cross section view of one fuel pellet are given in Figure 4.
Figure 4 - 3D view (cross-cut) of the fuel pellet (quotes in [mm]).
To protect the metallic structures from the hot temperatures reached in the fuel, one pellet made of thermally-insulating material is foreseen at each end of the fuel column.
In order to accommodate the differential thermal expansion of the cladding tube with respect to all the components within it, a spring (Figure 5) is foreseen. Made of an austenitic stainless steel of class “15-15Ti”, it occupies the top 120 mm of the space within the fuel pin, right below the top cap.
Figure 5 - 3D view of spring (quotes in [mm]).
Figure 6. Pin Finite Element model.
The pellets inside the pin are considered just as masses, because their contribution to the pin bending stiffness is negligible. The pellet mass was assigned to the shells used to model the external tube, thus the density of the shell material in the active zone was computed including the pellet mass.
Differently from the previous work [2] it is considered that the plenum tube do not increase the pin bending stiffness in the plenum zone, because the gap between the pin tube and the plenum tube is enough large to avoid contact also in case of relatively large deformation of the pin; thus only the mass of the plenum tube was considered in the model.
The spring is considered merely a mass because it doesn’t affect the bending stiffness of the pin.
The finite elements model of the ALFRED fuel pin is shown in Figure 6. The boundary condition at both ends of the pin is modelled – in this preliminary investigation study – as an encastre.
In this phase it is considered only one spacer, positioned in the plenum region 100 mm far from the active zone.
Spacer
Active zone Plenum
3. Modal analysis
In Table 1, the natural frequencies are reported and, in Figure 7 and Figure 8, the first and the third modal shapes are shown; the second, the fourth, the sixth and the eighth modes, being the pin axial-symmetric, are identical to the first, the third, the fifth and the seventh ones. This values are slightly different from the ones reported in [2] due to the adjustment of the Finite Element model reported in §2.
Table 1. Natural frequencies computed by modal analysis
Mode Frequency [Hz] 1 28.5 2 28.5 3 81.5 4 81.5 5 161 6 161 7 210 8 210
Figure 7. First modal shape.
4. Dynamic analysis of the single pin
In order to investigate the dynamic behavior of the fuel pin when the modal analysis cannot be performed (the modal analysis does not take into account the presence of the fluid around the pin), a different procedure, based on the Fourier analysis was used.
The results (displacement and acceleration) obtained in the time domain with a numerical analysis of the pin, subjected to an excitation, were decomposed in a Fourier series and the amplitudes of each frequency was reported, in arbitrary unit, in a graph, versus the frequency itself. In this way it is possible to identify the natural frequencies, amplified in the output signal.
In order to obtain a scan of the output signal with a resolution able to highlight all the frequencies up to 400 Hz, a sampling rate of 2.5e-4 s was chosen; in this way 10 points for each period are caught at the frequency of 400 Hz. In the output signal 4096 points were selected, that means 1s of acquisition time. The number of the points reported on the frequency axis is about 400; this means that a point, approximately, every 1Hz is reported in the graphs.
In order to check if this method is able to identify the natural frequencies of the pin, a first numerical analysis was performed applying to the pin an acceleration impulse and then it was left to vibrate freely; in the following this kind of analysis will be named “kick” analysis. The results are shown in Figure 9.
The nodes represent six different positions on the pin, chosen trying to identify the points were the amplification is higher; in order to avoid the points were the mode shapes have the lower deformation.
It is evident the presence of a resonance peak around 30Hz. When the scale of the horizontal axis is enlarged (see Figure 10), a better resolution indicates a value of 28.3 Hz, very close to the one computed with the modal analysis.
Figure 10. Fourier analysis of the displacement, enlarged scale.
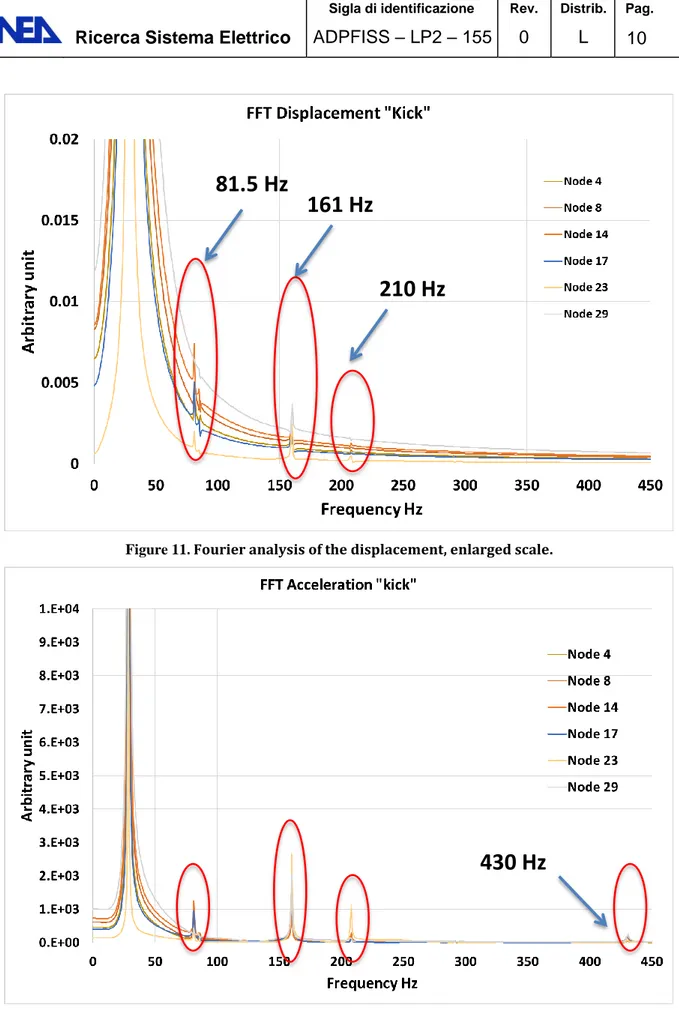
It seems that the only mode highlighted by this procedure is the first one, but, if the vertical axis is enlarged (Figure 11) it is possible to see, even if in not an evident manner, also the higher modes.
Similar results are obtained if the Fourier analysis is performed on the acceleration (Figure 12).
It’s worth noting that the displacement amplifies more efficiently the low frequencies while the acceleration is more efficient in amplifying the higher frequencies.
Comparing the peaks highlighted by the Fourier analysis with the values obtained with the modal analysis it is evident the good agreement of the results, thus confirming the possibility of investigating the higher modes frequencies of the pin by means of this method.
Figure 11. Fourier analysis of the displacement, enlarged scale.
Figure 12. Fourier analysis of the acceleration.
The “kick” analysis is able to put in evidence especially the first natural frequency, because it excites, basically, only it and it is not efficient in amplifying the higher modes. For this reason
81.5 Hz
161 Hz
210 Hz
two other inputs were developed, using different strategies, to excite in a more efficient way higher modes.
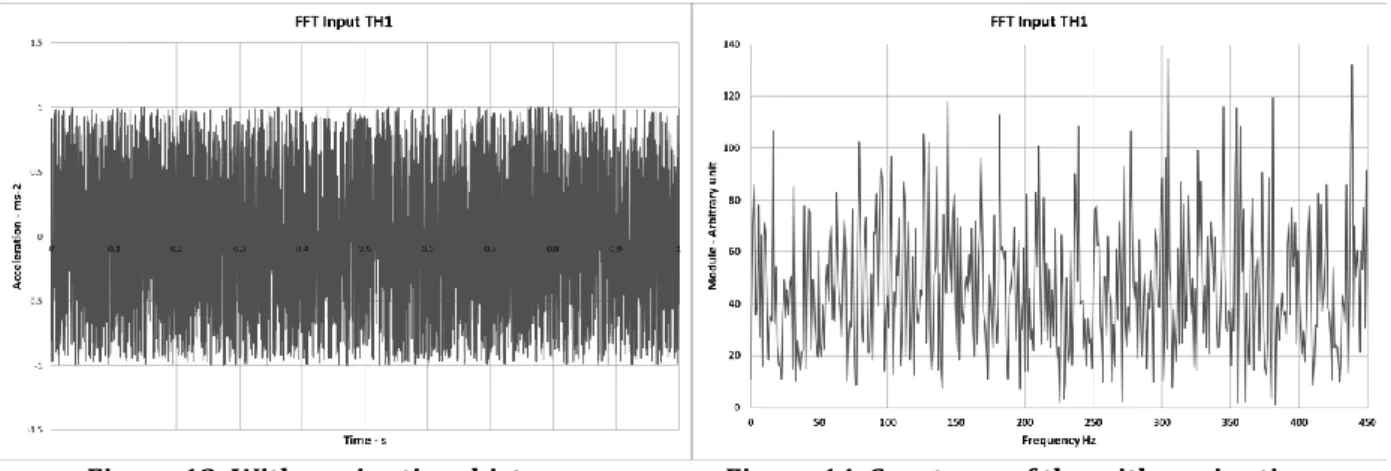
The first input time-history (named “white noise”) was created generating random numbers in the range -1, 1 and assigning to them the values of acceleration, thus obtaining a time history like the one reported in Figure 13. The spectrum of this time-history (Figure 14) indicates that all the frequencies are included but with different amplitudes.
Figure 13. Withe noise time history Figure 14. Spectrum of the withe noise time history
In order to reduce the influence of the spectrum shape, three time-histories were generated and three analyses were performed. The results shown are the average of the ones obtained by the three time-histories.
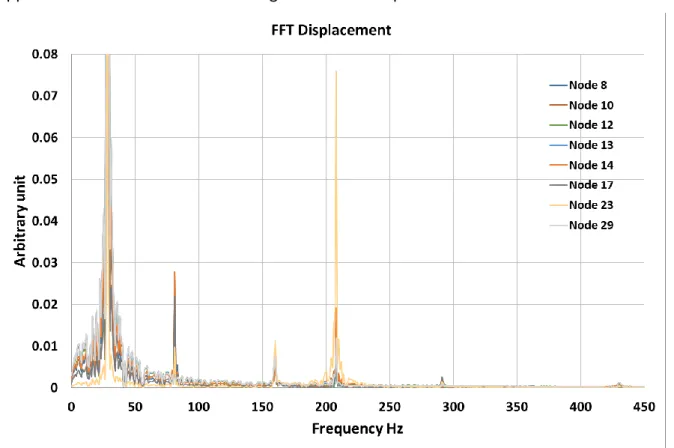
Figure 16. Fourier analysis of the displacement “withe noise” analysis enlarged scale.
Figure 17. Fourier analysis of the acceleration “withe noise” analysis.
It is possible to see that this method is able to put in evidence also the higher frequencies and the results obtained are in a good agreement with the results of the modal analysis.
An alternative method to generate time-histories, to be used in the investigation of the natural frequencies of the pin, is the use of a combination of many sinusoidal excitations with different frequencies in the range 0 – 400 Hz, all with the same amplitude but with casual phases (“sinus” time-history). The result is a time-history like the one shown in Figure 18. The advantage of this type of time-history is that the spectrum (Figure 19) contains all the frequencies with the same amplification, thus the amplification module is constant and all the pin frequencies are excited. For this reason it is not necessary to use different time-history to compensate the differences in the spectral amplification and only one analysis is performed.
Figure 18. Withe noise time history. Figure 19. Spectrum of the withe noise time history.
The results obtained are shown in Figure 20 and Figure 21. It is worth noting that this approach is more efficient in revealing the natural frequencies.
Figure 21. Fourier analysis of the acceleration “sinus” analysis.
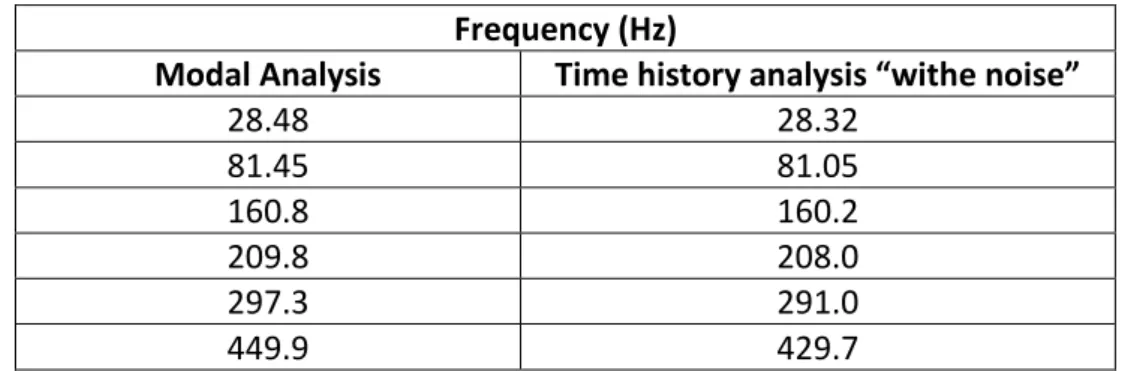
In Table 2 the values computed by means of the modal analysis are compared with the ones obtained with the time-history analysis. It’s worth noting that for the frequency over 400Hz the error is higher, because the sampling rate is too large to catch efficiently the possible resonances (see page 8).
Table 2. Comparison of the natural frequencies computed by modal analysis and by time-history analysis
Frequency (Hz)
Modal Analysis Time history analysis “withe noise”
28.48 28.32 81.45 81.05 160.8 160.2 209.8 208.0 297.3 291.0 449.9 429.7
At the end of this preliminary evaluation it is confirmed that this approach is able to reveal the natural frequencies of the pin and it will be used in the prosecution of the work.
5. Dynamic analysis of the pin immersed in fluid
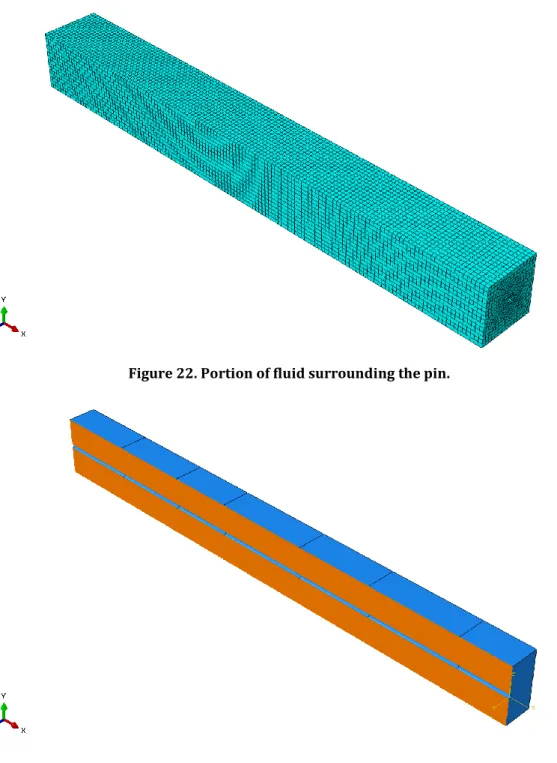
In order to investigate the dynamic behavior of the pin immersed in liquid lead, a new model that includes a portion of the fluid surrounding the pin was implemented. The portion of
fluid considered has the same length of the pin and a square section 150x150 mm (Figure 22 and Figure 23).
Figure 22. Portion of fluid surrounding the pin.
Figure 23. Portion of fluid surrounding the pin – cut view. The fluid around the pin moves parallel to the pin axis at a velocity of 1.5 m/s.
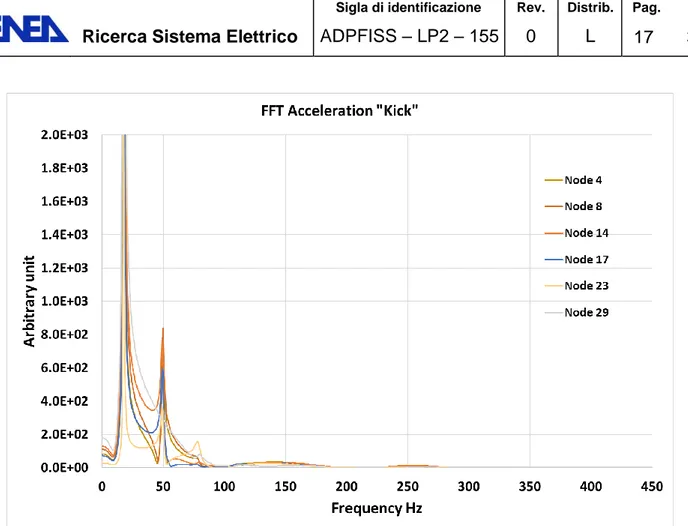
In order to investigate its vibrational behavior, the pin was submitted to the “kick” analysis that is especially able to catch the first natural frequency. The results are reported in Figure 24, Figure 25 and Figure 26, the first natural frequency is 17.6 Hz while the second that appear only in the acceleration is 49.8 Hz.
Figure 24. Fourier analysis of the displacement.
Figure 26. Fourier analysis of the acceleration.
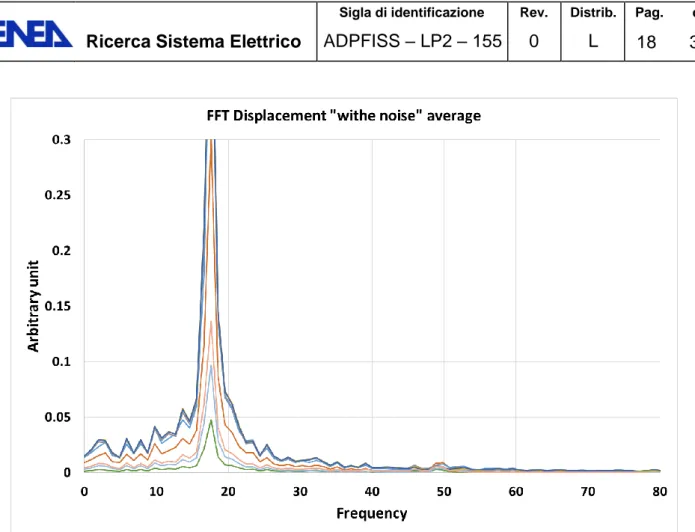
Again the time-history “with noise” is applied and the results, average of three analyses, are shown in the Figure 27, Figure 28 and Figure 29.
Figure 28. Fourier analysis of the displacement, enlarged scale.
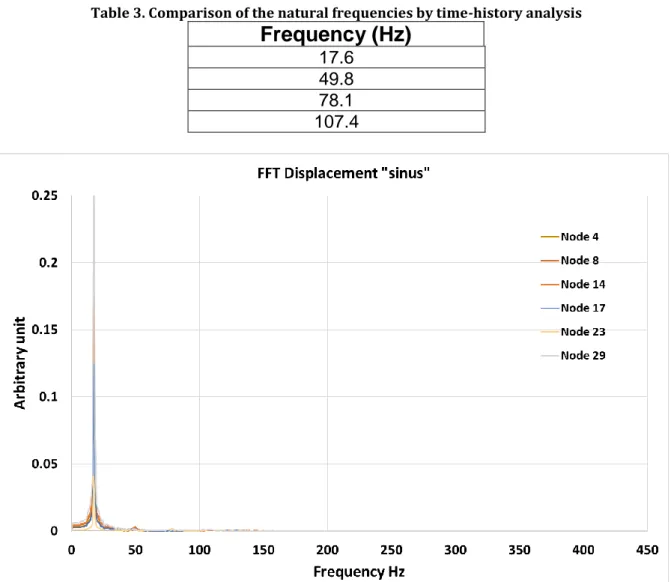
The analysis “with noise” gives more information about the third and fourth frequency and it seems to reveal resonances at about 80 Hz and about 110 Hz, but the results are not clear. The results obtained with the “sinus” analysis are reported in Figure 30, Figure 31 and Figure 32. Also in this case the Fourier analysis does not reveal frequencies higher than 150 Hz, probably because the liquid lead dumps these frequencies.
In Table 3 the results obtained for the pin immersed in liquid lead are reported. As a conclusion it is possible to say that four frequencies up to 107 Hz are revealed, while higher frequencies are completely hidden by the presence of the fluid.
Table 3. Comparison of the natural frequencies by time-history analysis
Frequency (Hz)
17.6 49.8 78.1 107.4
Figure 31. Fourier analysis of the displacement, enlarged scale.
6. Dynamic analysis of a group of pins immersed in fluid
As a further step in the validation of the simulation model and tool, the influence of the surrounding pins on the vibration of a single pin is studied. In order to investigate this problem a group of seven pins was modelled and implemented in the code (left and right frames of Figure 33).
The portion of fluid considered for this case study has the same shape of the wrapper enclosing the bundle [3]. The boundary conditions imposed to the fluid consider the wrapper as rigid body (Figure 34).
As for the cases discussed in the previous section, the acceleration time history “sinus” is applied only to the central pin, which starts moving. The movement is transmitted by the fluid to the adjacent pins and vice versa.
Figure 33. FE model of the pins group (left) and model of the pins group (right).
Figure 34. Portion of fluid surrounding the pin group.
1 2 3 4 5 6
In this case the results report the movement in two directions, parallel to the excitation (Direction 2) and perpendicular to it (Direction 1).
Figure 35. Fourier analysis of the displacement, direction 2.
Figure 37. Fourier analysis of the displacement, direction1 .
Figure 39. Fourier analysis of the acceleration, direction 2.
Figure 41. Fourier analysis of the acceleration, direction 1.
Figure 42. Fourier analysis of the acceleration, direction 1, enlarged scale.
Looking at the results it is difficult to extract the natural frequencies of the central pin. The pin interacts with the other by means of the fluid that transfers energy to the adjacent pins
and the surrounding pins cause a feedback on the central pin generating a chaotic movement. Anyway it is possible to see two possible resonance around 20 Hz and, probably others around 60, 100 and 130 Hz.
In order to confirm that the interaction between the pins, mediated by the fluid, changes the dynamic behavior of the pin bundle, the analysis was repeated applying to all the pins the same time-history. The results are reported in Figure 43, Figure 44, Figure 45 and Figure 46 below.
It can be seen a slight difference in the maximum module values of the frequencies computed, as expected. To underline this fact a comparison is reported in Figure 47, Figure 48, Figure 49 and Figure 50
Figure 44. Fourier analysis of the displacement, direction 1, enlarged scale.
Figure 46. Fourier analysis of the acceleration, direction 1, enlarged scale.
Figure 48. Comparison of single pin loaded-all pin loaded - acceleration, direction 1, enlarged scale.
Figure 49. Comparison of single pin loaded-all pin loaded - displacement, direction 2, enlarged scale.
Figure 50. Comparison of single pin loaded-all pin loaded - displacement, direction 2, enlarged scale.
7. Conclusion and next step
This work must be considered, basically, as preparatory to further analysis to be performed on the fuel element.
Several cases were studied, in which different, progressively complicated, situations have been investigated. Starting from a modal analysis, for which a single pin – isolated for everything else – was considered, one after the other the assumptions were removed. This approach permitted to preserve the capability for expert’s judgment on the validity of the results while moving towards less obvious situations, more and more representative of the real condition of the bundle of fuel pins immersed in flowing lead and enclosed by a wrapper tube.
This work has demonstrated that the co-simulation technique provided by Abaqus is able to numerically simulate the behavior of the pins immersed in liquid lead, subjected to a dynamic load. This provides the aimed confidence on the viability of investigating the effects of flow-induced vibrations by means of Abaqus, hence to substantiate the design of the support system for the bundle of ALFRED pins.
The scheme with the 7 pin needs further investigation, for instance applying to all the pins and the fluid an excitation, simulating a movement of the entire element submitted to an external load, such as for the seismic load.
In the next steps, the entire 127 pin bundle (Figure 51) and the fluid inside the wrapper (Figure 52) will be modeled as requested, and parametric analyses will be performed to drive both the design of the spacer grids and their optimal positioning (number/locations).
Figure 51. Model of the entire bundle Figure 52. Model of the fluid inside the wrapper
References
[1] ABAQUS UNIFIED FEA. SIMULIA. 166 Valley Street. Providence. RI 02909 USA. www.simulia.com
[2] A.Poggianti. Preliminary thermomechanical analysis of the ALFRED fuel element. Technical Report ADPFISS LP2 140, ENEA (2017).
[3] G. Grasso, F. Lodi, M. Sarotto. The current ALFRED core design. Technical Report SICNUC-P000-017 rev. 0, ENEA (2017).