S T U D Y P R O T O C O L
Open Access
International pooled study on diet and
bladder cancer: the bladder cancer,
epidemiology and nutritional determinants
(BLEND) study: design and baseline
characteristics
Maria E. Goossens
1*, Fatima Isa
2, Maree Brinkman
3, David Mak
2, Raoul Reulen
2, Anke Wesselius
4,
Simone Benhamou
5, Cristina Bosetti
6, Bas Bueno-de-Mesquita
7,8,9,10, Angela Carta
11, Md Farouk Allam
12,
Klaus Golka
13, Eric J. Grant
14, Xuejuan Jiang
15, Kenneth C. Johnson
16, Margaret R. Karagas
17, Eliane Kellen
18,
Carlo La Vecchia
19, Chih-Ming Lu
20, James Marshall
21, Kirsten Moysich
21, Hermann Pohlabeln
22, Stefano Porru
11,
Gunnar Steineck
23, Marianne C. Stern
15, Li Tang
21, Jack A. Taylor
24, Piet van den Brandt
25, Paul J. Villeneuve
26,
Kenji Wakai
27, Elisabete Weiderpass
28,29,30,31, Emily White
32, Alicja Wolk
33, Zuo-Feng Zhang
34, Frank Buntinx
1,35and Maurice P. Zeegers
4,35,36Abstract
Background: In 2012, more than 400,000 urinary bladder cancer cases occurred worldwide, making it the 7
thmost
common type of cancer. Although many previous studies focused on the relationship between diet and bladder
cancer, the evidence related to specific food items or nutrients that could be involved in the development of bladder
cancer remains inconclusive. Dietary components can either be, or be activated into, potential carcinogens through
metabolism, or act to prevent carcinogen damage.
Methods/design: The BLadder cancer, Epidemiology and Nutritional Determinants (BLEND) study was set up with the
purpose of collecting individual patient data from observational studies on diet and bladder cancer. In total, data from
11,261 bladder cancer cases and 675,532 non-cases from 18 case
–control and 6 cohort studies from all over the world
were included with the aim to investigate the association between individual food items, nutrients and dietary patterns
and risk of developing bladder cancer.
Discussion: The substantial number of cases included in this study will enable us to provide evidence with large
statistical power, for dietary recommendations on the prevention of bladder cancer.
Keywords: Bladder cancer, Diet, Risk, Pooled analysis
* Correspondence:[email protected]
1Department of General Practice, Katholieke Universiteit Leuven, ACHG-KU
Leuven, Kapucijnenvoer 33, Blok J, bus 7001, 3000 Leuven, Belgium Full list of author information is available at the end of the article
© 2016 The Author(s). Open Access This article is distributed under the terms of the Creative Commons Attribution 4.0 International License (http://creativecommons.org/licenses/by/4.0/), which permits unrestricted use, distribution, and reproduction in any medium, provided you give appropriate credit to the original author(s) and the source, provide a link to the Creative Commons license, and indicate if changes were made. The Creative Commons Public Domain Dedication waiver (http://creativecommons.org/publicdomain/zero/1.0/) applies to the data made available in this article, unless otherwise stated.
Background
In 2012, more than 400,000 urinary bladder cancer (UBC)
cases occurred worldwide, making it the 7th most
com-mon type of cancer [1]. Due to lifetime ongoing
cystosco-pies and recurrent treatment episodes, UBC is the most
expensive malignancy in terms of healthcare expenditure
in the USA and in most Western countries [2, 3]. The
effect of diet in the prevention of UBC could be more
pro-nounced compared to other types of cancer as dietary
components are often excreted through the urine. Dietary
components can either be, or be activated into, potential
carcinogens through metabolism, or act to prevent
car-cinogen damage [4].
Although many previous studies focused on the
rela-tionship between diet and UBC, the evidence related to
specific food items or nutrients that could be involved in
the development of UBC remains inconclusive. The
World Cancer Research Fund (WCRF) concluded in
their most recent WCRF/AICR expert report [5] that
there is some evidence for an decreased risk of bladder
cancer with greater consumption of vegetables, fruit and
tea and strong evidence that drinking water containing
ar-senic increases the risk of bladder cancer. A potential
rea-son for the absence of evidence between specific foods
and nutrients and the risk of UBC is that associations
be-tween cancer risk and dietary intake are usually weak and
most previous studies may have had insufficient sample
size and thus missed adequate statistical power for
de-tailed analyses on individual food items, for subgroup
ana-lyses and for food-food interactions. Pooling of individual
data of existing epidemiological studies on diet and UBC
might therefore be an effective way to increase the current
knowledge on the influences of foods, nutrients and
diet-ary patterns on UBC risk. The influence of occupational
risk and pollutants in the water, such as arsenic, are not
part of this investigation. Occupational risk factors were
identified as risk factors for bladder cancer [6]. However,
as the frequency of having a high-risk occupation is very
low (<3 %) this could not importantly confound the
re-sults. For this reason, the BLEND study as well as most
previous bladder cancer epidemiological studies have not
corrected for occupation in their analyses.
Within the BLadder cancer, Epidemiology and
Nutri-tional Determinants (BLEND) study, we aim to
investi-gate comprehensively the association between individual
food items, nutrients, and dietary patterns and risk of
developing UBC. The results of this study will likely aid
in developing and reviewing current dietary
recommen-dations for the prevention of UBC. In this paper we
re-port on the methodology and baseline characteristics of
the BLEND study.
Methods/design
Included epidemiological studies
Possible eligible epidemiological studies reporting on diet
and UBC have been identified by a computerized search
of Medline (National Library of Medicine, Bethesda,
Maryland) (1966-Sept 2009), and Embase (Elsevier B. V.,
Amderstam, the Netherlands (1974-Sept 2009) using the
medical subject headings (MeSH; National Library of
Medicine, Bethesda, Maryland)
“urinary bladder
neo-plasms” and “risk” and the free-text word “risk”. The
search was restricted to the MeSH term
“humans”. All
articles from peer-reviewed journals, reporting on the
as-sociation between diet and risk of UBC were selected.
Within these articles, we identified the eligible studies that
used a case
–control or a cohort design, had data on diet
and a minimum number of cases of 40 patients. The
prin-cipal investigators of these eligible studies were contacted
and invited to participate in our collaborative project.
There was no restriction about the amount of available diet
items, however, data on confounders, especially, smoking,
had to be available.
Data harmonization
To harmonize our data, a common codebook was
cre-ated based on the Eurocode 2 Core classification version
99/2 [7]. The Eurocode 2 Food Coding System was
ori-ginally developed to serve as a standard instrument for
nutritional surveys in Europe and to serve the need for
food intake comparisons within the European FLAIR
Eurofoods-Enfant Project [8]. The Eurocode 2
classifica-tion System unambiguously defines which types of food
are covered or not within each food category so that the
potential for misclassification is limited. The System
pro-vides coding for food items consumed all over the world.
Coding has been done centrally by the researchers of the
Blend team. One part of the team did the coding, while
the other part of the team checked for possible errors.
Translation of the questionnaires in English was provided
by the principle investigator for studies in other languages.
Apart from the variables on diet, we collected non-dietary
data such as, study design, age, gender, ethnic group,
TNM Classification of Malignant Tumors (TNM),
smok-ing status, smoksmok-ing frequency and duration, and family
history. Each participant was assigned a random and
unique identification number. Analyses were restricted to
adults, i.e. participants younger than 18 years were
ex-cluded. Categorical data have been checked by producing
frequency tables to identify inaccurate coding while
con-tinuous data have been checked performing descriptive
statistics. Possible coding errors and missing data within
the provided data of each study were discussed with the
principal investigator and updated accordingly. Outliers,
defined as values outside the general distribution of the
data, were identified after visual inspection of the resultant
scatterplots and omitted [9].
Baseline characteristics
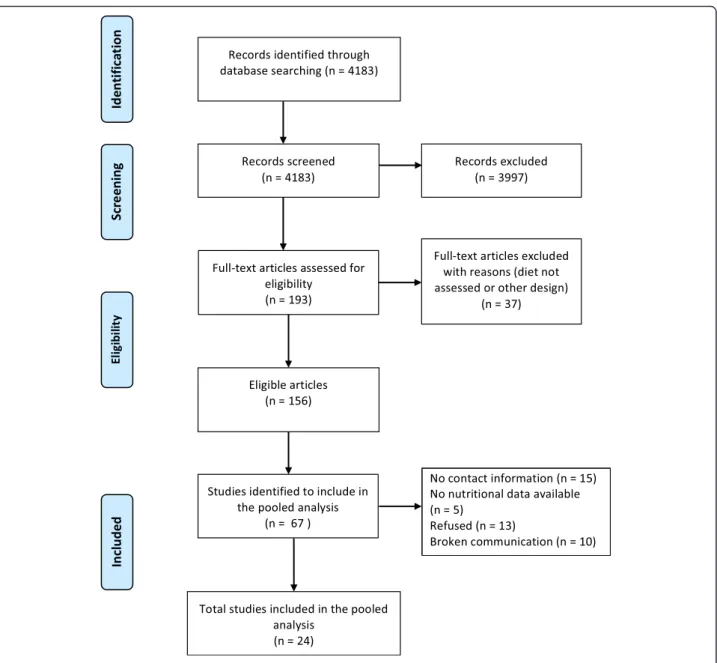
In total 67 potentially eligible studies from 156 retrieved
articles were identified (Fig. 1). Thirty-eight investigators
agreed to participate and 24 [10–34] provided data
(Table 1). Reasons for non-participation after initially
agreement were: no data on diet or the minimum set of
confounders available, the workload that was already too
high and the wish to publish the results on nutrition first
before participating in a pooled study. With some
inves-tigators, we lost communication after initial contact. The
first datasets and codebooks were collected in March
2009 while the last dataset was included in March 2016.
Another two new studies, one case–control and one
cohort study are available for inclusion.
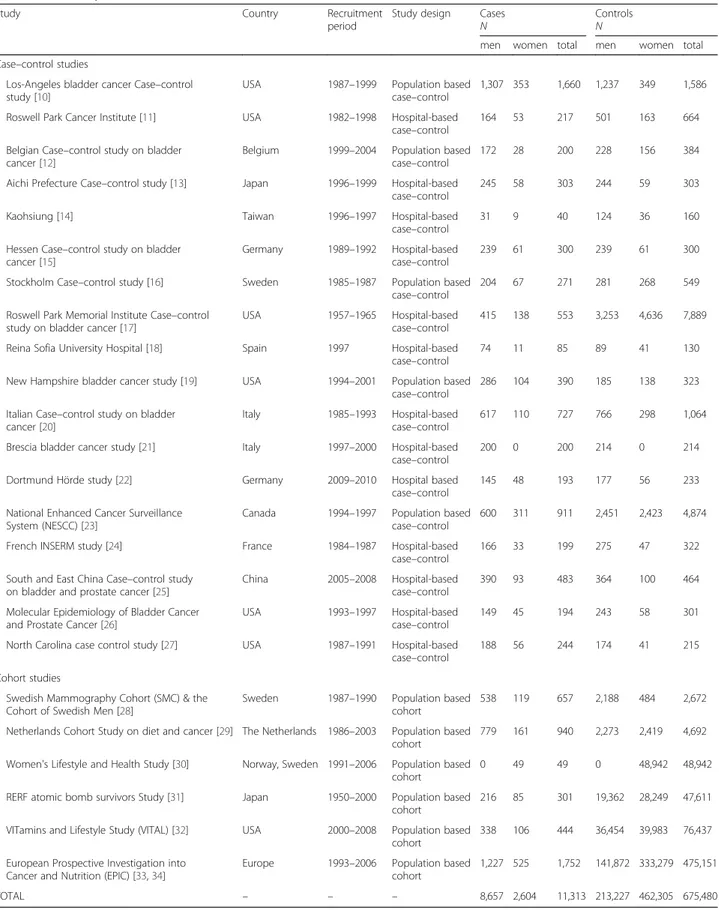
More than 2/3 of the case–control studies [11, 13–15,
17, 18, 20–22, 24–27] had a hospital-based case–control
design. Ten studies [12, 16, 19–21, 24–28] were also
part of the International Bladder Cancer Consortium
that was formed in 2005 as an open scientific forum
for genetic-epidemiologic researchers in the field of
UBC. Most of the studies [12, 15, 16, 18, 20–22, 24,
28–30, 33, 34] were from Europe, eight studies [10,
11, 17, 19, 23, 26, 27, 32] were from the USA and
Canada, and four [13, 14, 25, 31] studies were from
Asia.
After excluding participants with unknown age (n = 5),
unknown case–control status (n = 214) and unknown
smoking status (n = 14,028) data of 686,793 participants
were available for analyses of which 11,261 cases and
675,532 non-cases. The Brescia bladder cancer study [21]
contained only male participants, while the Women’s
Table 1 Characteristics of the studies included in the pooled analysis of the Bladder cancer Epidemiology and Nutritional
Determinants study (BLEND)
Study Country Recruitment
period
Study design Cases N
Controls N
men women total men women total Case–control studies
Los-Angeles bladder cancer Case–control study [10]
USA 1987–1999 Population based case–control
1,307 353 1,660 1,237 349 1,586
Roswell Park Cancer Institute [11] USA 1982–1998 Hospital-based case–control
164 53 217 501 163 664
Belgian Case–control study on bladder cancer [12]
Belgium 1999–2004 Population based case–control
172 28 200 228 156 384
Aichi Prefecture Case–control study [13] Japan 1996–1999 Hospital-based case–control
245 58 303 244 59 303
Kaohsiung [14] Taiwan 1996–1997 Hospital-based
case–control
31 9 40 124 36 160
Hessen Case–control study on bladder cancer [15]
Germany 1989–1992 Hospital-based case–control
239 61 300 239 61 300
Stockholm Case–control study [16] Sweden 1985–1987 Population based case–control
204 67 271 281 268 549
Roswell Park Memorial Institute Case–control study on bladder cancer [17]
USA 1957–1965 Hospital-based case–control
415 138 553 3,253 4,636 7,889
Reina Sofia University Hospital [18] Spain 1997 Hospital-based case–control
74 11 85 89 41 130
New Hampshire bladder cancer study [19] USA 1994–2001 Population based case–control
286 104 390 185 138 323
Italian Case–control study on bladder cancer [20]
Italy 1985–1993 Hospital-based case–control
617 110 727 766 298 1,064
Brescia bladder cancer study [21] Italy 1997–2000 Hospital-based case–control
200 0 200 214 0 214
Dortmund Hörde study [22] Germany 2009–2010 Hospital based case–control
145 48 193 177 56 233
National Enhanced Cancer Surveillance System (NESCC) [23]
Canada 1994–1997 Population based case–control
600 311 911 2,451 2,423 4,874
French INSERM study [24] France 1984–1987 Hospital-based case–control
166 33 199 275 47 322
South and East China Case–control study on bladder and prostate cancer [25]
China 2005–2008 Hospital-based case–control
390 93 483 364 100 464
Molecular Epidemiology of Bladder Cancer and Prostate Cancer [26]
USA 1993–1997 Hospital-based case–control
149 45 194 243 58 301
North Carolina case control study [27] USA 1987–1991 Hospital-based case–control
188 56 244 174 41 215
Cohort studies
Swedish Mammography Cohort (SMC) & the Cohort of Swedish Men [28]
Sweden 1987–1990 Population based cohort
538 119 657 2,188 484 2,672
Netherlands Cohort Study on diet and cancer [29] The Netherlands 1986–2003 Population based cohort
779 161 940 2,273 2,419 4,692
Women's Lifestyle and Health Study [30] Norway, Sweden 1991–2006 Population based cohort
0 49 49 0 48,942 48,942
RERF atomic bomb survivors Study [31] Japan 1950–2000 Population based cohort
216 85 301 19,362 28,249 47,611
VITamins and Lifestyle Study (VITAL) [32] USA 2000–2008 Population based cohort
338 106 444 36,454 39,983 76,437
European Prospective Investigation into Cancer and Nutrition (EPIC) [33,34]
Europe 1993–2006 Population based cohort
1,227 525 1,752 141,872 333,279 475,151
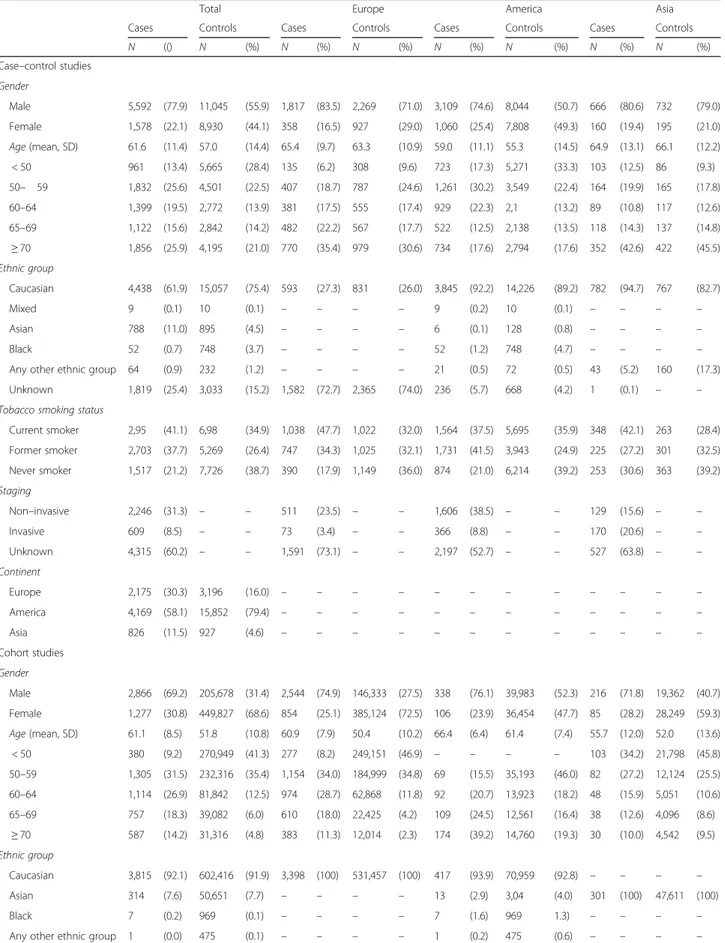
Table 2 Characteristics of the study population of the Bladder cancer Epidemiology and Nutritional Determinants study (BLEND)
Total Europe America Asia
Cases Controls Cases Controls Cases Controls Cases Controls
N (() N (%) N (%) N (%) N (%) N (%) N (%) N (%)
Case–control studies Gender Male 5,592 (77.9) 11,045 (55.9) 1,817 (83.5) 2,269 (71.0) 3,109 (74.6) 8,044 (50.7) 666 (80.6) 732 (79.0) Female 1,578 (22.1) 8,930 (44.1) 358 (16.5) 927 (29.0) 1,060 (25.4) 7,808 (49.3) 160 (19.4) 195 (21.0) Age (mean, SD) 61.6 (11.4) 57.0 (14.4) 65.4 (9.7) 63.3 (10.9) 59.0 (11.1) 55.3 (14.5) 64.9 (13.1) 66.1 (12.2) < 50 961 (13.4) 5,665 (28.4) 135 (6.2) 308 (9.6) 723 (17.3) 5,271 (33.3) 103 (12.5) 86 (9.3) 50– 59 1,832 (25.6) 4,501 (22.5) 407 (18.7) 787 (24.6) 1,261 (30.2) 3,549 (22.4) 164 (19.9) 165 (17.8) 60–64 1,399 (19.5) 2,772 (13.9) 381 (17.5) 555 (17.4) 929 (22.3) 2,1 (13.2) 89 (10.8) 117 (12.6) 65–69 1,122 (15.6) 2,842 (14.2) 482 (22.2) 567 (17.7) 522 (12.5) 2,138 (13.5) 118 (14.3) 137 (14.8) ≥ 70 1,856 (25.9) 4,195 (21.0) 770 (35.4) 979 (30.6) 734 (17.6) 2,794 (17.6) 352 (42.6) 422 (45.5) Ethnic group Caucasian 4,438 (61.9) 15,057 (75.4) 593 (27.3) 831 (26.0) 3,845 (92.2) 14,226 (89.2) 782 (94.7) 767 (82.7) Mixed 9 (0.1) 10 (0.1) – – – – 9 (0.2) 10 (0.1) – – – – Asian 788 (11.0) 895 (4.5) – – – – 6 (0.1) 128 (0.8) – – – – Black 52 (0.7) 748 (3.7) – – – – 52 (1.2) 748 (4.7) – – – –
Any other ethnic group 64 (0.9) 232 (1.2) – – – – 21 (0.5) 72 (0.5) 43 (5.2) 160 (17.3) Unknown 1,819 (25.4) 3,033 (15.2) 1,582 (72.7) 2,365 (74.0) 236 (5.7) 668 (4.2) 1 (0.1) – – Tobacco smoking status
Current smoker 2,95 (41.1) 6,98 (34.9) 1,038 (47.7) 1,022 (32.0) 1,564 (37.5) 5,695 (35.9) 348 (42.1) 263 (28.4) Former smoker 2,703 (37.7) 5,269 (26.4) 747 (34.3) 1,025 (32.1) 1,731 (41.5) 3,943 (24.9) 225 (27.2) 301 (32.5) Never smoker 1,517 (21.2) 7,726 (38.7) 390 (17.9) 1,149 (36.0) 874 (21.0) 6,214 (39.2) 253 (30.6) 363 (39.2) Staging Non–invasive 2,246 (31.3) – – 511 (23.5) – – 1,606 (38.5) – – 129 (15.6) – – Invasive 609 (8.5) – – 73 (3.4) – – 366 (8.8) – – 170 (20.6) – – Unknown 4,315 (60.2) – – 1,591 (73.1) – – 2,197 (52.7) – – 527 (63.8) – – Continent Europe 2,175 (30.3) 3,196 (16.0) – – – – – – – – – – – – America 4,169 (58.1) 15,852 (79.4) – – – – – – – – – – – – Asia 826 (11.5) 927 (4.6) – – – – – – – – – – – – Cohort studies Gender Male 2,866 (69.2) 205,678 (31.4) 2,544 (74.9) 146,333 (27.5) 338 (76.1) 39,983 (52.3) 216 (71.8) 19,362 (40.7) Female 1,277 (30.8) 449,827 (68.6) 854 (25.1) 385,124 (72.5) 106 (23.9) 36,454 (47.7) 85 (28.2) 28,249 (59.3) Age (mean, SD) 61.1 (8.5) 51.8 (10.8) 60.9 (7.9) 50.4 (10.2) 66.4 (6.4) 61.4 (7.4) 55.7 (12.0) 52.0 (13.6) < 50 380 (9.2) 270,949 (41.3) 277 (8.2) 249,151 (46.9) – – – – 103 (34.2) 21,798 (45.8) 50–59 1,305 (31.5) 232,316 (35.4) 1,154 (34.0) 184,999 (34.8) 69 (15.5) 35,193 (46.0) 82 (27.2) 12,124 (25.5) 60–64 1,114 (26.9) 81,842 (12.5) 974 (28.7) 62,868 (11.8) 92 (20.7) 13,923 (18.2) 48 (15.9) 5,051 (10.6) 65–69 757 (18.3) 39,082 (6.0) 610 (18.0) 22,425 (4.2) 109 (24.5) 12,561 (16.4) 38 (12.6) 4,096 (8.6) ≥ 70 587 (14.2) 31,316 (4.8) 383 (11.3) 12,014 (2.3) 174 (39.2) 14,760 (19.3) 30 (10.0) 4,542 (9.5) Ethnic group Caucasian 3,815 (92.1) 602,416 (91.9) 3,398 (100) 531,457 (100) 417 (93.9) 70,959 (92.8) – – – – Asian 314 (7.6) 50,651 (7.7) – – – – 13 (2.9) 3,04 (4.0) 301 (100) 47,611 (100) Black 7 (0.2) 969 (0.1) – – – – 7 (1.6) 969 1.3) – – – –
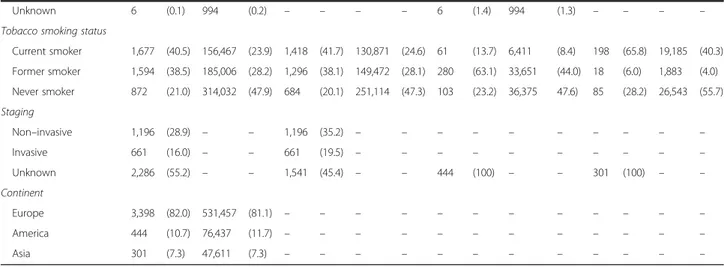
Table 2 Characteristics of the study population of the Bladder cancer Epidemiology and Nutritional Determinants study (BLEND)
(Continued)
Unknown 6 (0.1) 994 (0.2) – – – – 6 (1.4) 994 (1.3) – – – –
Tobacco smoking status
Current smoker 1,677 (40.5) 156,467 (23.9) 1,418 (41.7) 130,871 (24.6) 61 (13.7) 6,411 (8.4) 198 (65.8) 19,185 (40.3) Former smoker 1,594 (38.5) 185,006 (28.2) 1,296 (38.1) 149,472 (28.1) 280 (63.1) 33,651 (44.0) 18 (6.0) 1,883 (4.0) Never smoker 872 (21.0) 314,032 (47.9) 684 (20.1) 251,114 (47.3) 103 (23.2) 36,375 47.6) 85 (28.2) 26,543 (55.7) Staging Non–invasive 1,196 (28.9) – – 1,196 (35.2) – – – – – – – – – – Invasive 661 (16.0) – – 661 (19.5) – – – – – – – – – – Unknown 2,286 (55.2) – – 1,541 (45.4) – – 444 (100) – – 301 (100) – – Continent Europe 3,398 (82.0) 531,457 (81.1) – – – – – – – – – – – – America 444 (10.7) 76,437 (11.7) – – – – – – – – – – – – Asia 301 (7.3) 47,611 (7.3) – – – – – – – – – – – –
Table 3 Number of food items and portion size reported by each study within the Bladder cancer Epidemiology and Nutritional
Determinants study (BLEND)
Study Food items (n) Portion size
Case–control studies
Los-Angeles bladder cancer Case–control study [10] 49 Yes
Roswell Park Cancer Institute [11] 44 Yes
Belgian Case–control study on bladder cancer [12] 788 Yes
Aichi Prefecture Case–control study [13] 107 Yes
Kaohsiung [14] 41 Yes
Hessen Case–control study on bladder cancer [15] 26 No
Stockholm Case–control study [16] 188 Yes
Roswell Park Memorial Institute Case–control study on bladder cancer [17] 64 Yes
Reina Sofia University [18] 17 No
New Hampshire bladder cancer study [19] 121 Yes
Italian Case–control study on bladder cancer [20] 21 No
Brescia bladder cancer study [21] 40 Yes
Dortmund Hörde study [22] 3 Yes
National Enhanced Cancer Surveillance System (NESCC) [23] 69 Yes
French INSERM study [24] 2 No
South and East China Case–control study on bladder and prostate cancer [25] 52 No
Molecular Epidemiology of Bladder Cancer and Prostate Cancer [26] 90 Yes
North Carolina case control study [27] 9 No
Cohort studies
Swedish Mammography Cohort (SMC) & the Cohort of Swedish Men [28] 96 No Netherlands Cohort Study on diet and cancer, the Netherlands, 1986–2003 [29] 150 Yes
Women’s Lifestyle and Health Study [30] 98 Yes
RERF atomic bomb survivors Study [31] 102 No
Vital study [32] 126 Yes
European Prospective Investigation into Cancer and Nutrition (EPIC) [33,34] 260a Yes
a
Dietary intake was assessed by a number of different instruments in the participating countries and the number of different food items varied from 88 (Norway) to 2443 (Sweden)
Lifestyle and Health study consisted of only female
partici-pants. Most of the cases were from America to Europe
while only 10 % were from Asia.
The cases of the European and Asian case–control
stud-ies had the highest male/female ratio (4:1) while their
overall male/female ratio was 3:1 (Table 2). In general,
controls were younger than cases, 57.0 versus 61.6 years
and 51.8 versus 61.1 years, respectively for case–control
studies and cohort studies with an exception for the Asian
case–control studies (66.1 versus 64.9 years). Most of the
participants were Caucasian, whereas only 10 % of the
cases were Asian. In contrast with Asia, where one third
of the cases were never smoker, only one fifth of the cases
never smoked in Europe and USA. Overall, 40 % of the
cases were smokers. Controls had significant less current
and more never smokers than cases. For cohort studies,
nearly half of the controls never smoked. Staging was not
reported in 60 and 70 % respectively for the case–control
and cohort studies.
Although all of the studies used a food frequency
questionnaire (FFQ), the number of food items assessed
varied widely (Table 3). Two studies [22, 24] only asked
three and two specific items (beer, coffee and
decaffein-ated coffee), while others assessed dietary intake in more
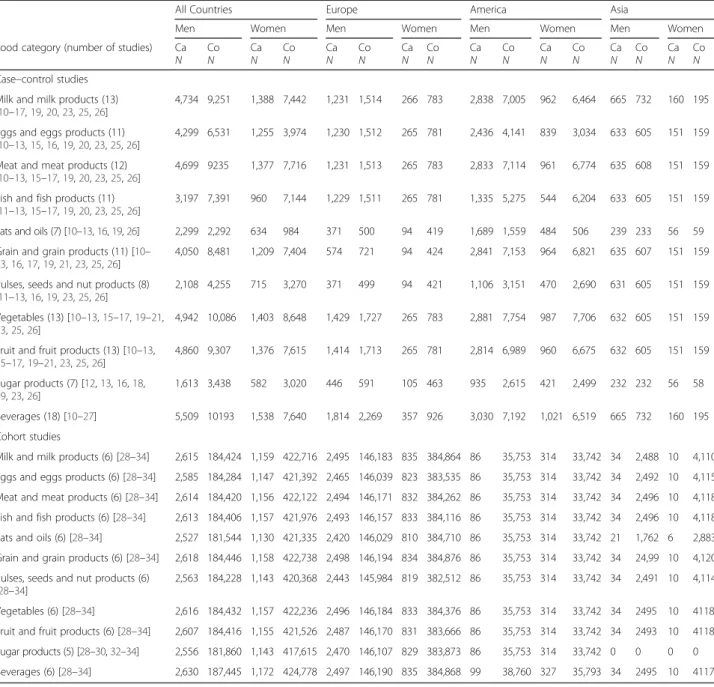
Table 4 Numbers of cases and controls available for each food category included in the Bladder cancer Epidemiology and
Nutritional Determinants study (BLEND)
All Countries Europe America Asia
Men Women Men Women Men Women Men Women
Food category (number of studies) Ca N Co N Ca N Co N Ca N Co N Ca N Co N Ca N Co N Ca N Co N Ca N Co N Ca N Co N Case–control studies
Milk and milk products (13) [10–17,19,20,23,25,26]
4,734 9,251 1,388 7,442 1,231 1,514 266 783 2,838 7,005 962 6,464 665 732 160 195
Eggs and eggs products (11) [10–13,15,16,19,20,23,25,26]
4,299 6,531 1,255 3,974 1,230 1,512 265 781 2,436 4,141 839 3,034 633 605 151 159
Meat and meat products (12) [10–13,15–17,19,20,23,25,26]
4,699 9235 1,377 7,716 1,231 1,513 265 783 2,833 7,114 961 6,774 635 608 151 159
Fish and fish products (11) [11–13,15–17,19,20,23,25,26]
3,197 7,391 960 7,144 1,229 1,511 265 781 1,335 5,275 544 6,204 633 605 151 159
Fats and oils (7) [10–13,16,19,26] 2,299 2,292 634 984 371 500 94 419 1,689 1,559 484 506 239 233 56 59 Grain and grain products (11) [10–
13,16,17,19,21,23,25,26]
4,050 8,481 1,209 7,404 574 721 94 424 2,841 7,153 964 6,821 635 607 151 159
Pulses, seeds and nut products (8) [11–13,16,19,23,25,26]
2,108 4,255 715 3,270 371 499 94 421 1,106 3,151 470 2,690 631 605 151 159
Vegetables (13) [10–13,15–17,19–21,
23,25,26]
4,942 10,086 1,403 8,648 1,429 1,727 265 783 2,881 7,754 987 7,706 632 605 151 159
Fruit and fruit products (13) [10–13,
15–17,19–21,23,25,26] 4,860 9,307 1,376 7,615 1,414 1,713 265 781 2,814 6,989 960 6,675 632 605 151 159 Sugar products (7) [12,13,16,18, 19,23,26] 1,613 3,438 582 3,020 446 591 105 463 935 2,615 421 2,499 232 232 56 58 Beverages (18) [10–27] 5,509 10193 1,538 7,640 1,814 2,269 357 926 3,030 7,192 1,021 6,519 665 732 160 195 Cohort studies
Milk and milk products (6) [28–34] 2,615 184,424 1,159 422,716 2,495 146,183 835 384,864 86 35,753 314 33,742 34 2,488 10 4,110 Eggs and eggs products (6) [28–34] 2,585 184,284 1,147 421,392 2,465 146,039 823 383,535 86 35,753 314 33,742 34 2,492 10 4,115 Meat and meat products (6) [28–34] 2,614 184,420 1,156 422,122 2,494 146,171 832 384,262 86 35,753 314 33,742 34 2,496 10 4,118 Fish and fish products (6) [28–34] 2,613 184,406 1,157 421,976 2,493 146,157 833 384,116 86 35,753 314 33,742 34 2,496 10 4,118 Fats and oils (6) [28–34] 2,527 181,544 1,130 421,335 2,420 146,029 810 384,710 86 35,753 314 33,742 21 1,762 6 2,883 Grain and grain products (6) [28–34] 2,618 184,446 1,158 422,738 2,498 146,194 834 384,876 86 35,753 314 33,742 34 24,99 10 4,120 Pulses, seeds and nut products (6)
[28–34]
2,563 184,228 1,143 420,368 2,443 145,984 819 382,512 86 35,753 314 33,742 34 2,491 10 4,114
Vegetables (6) [28–34] 2,616 184,432 1,157 422,236 2,496 146,184 833 384,376 86 35,753 314 33,742 34 2495 10 4118 Fruit and fruit products (6) [28–34] 2,607 184,416 1,155 421,526 2,487 146,170 831 383,666 86 35,753 314 33,742 34 2493 10 4118 Sugar products (5) [28–30,32–34] 2,556 181,860 1,143 417,615 2,470 146,107 829 383,873 86 35,753 314 33,742 0 0 0 0 Beverages (6) [28–34] 2,630 187,445 1,172 424,778 2,497 146,190 835 384,868 99 38,760 327 35,793 34 2495 10 4117
detail (from 9 [27] to 788 food items [12]). The mean
number of food items per questionnaire was 107 and
132 after exclusion of those studies that reported only
on beverages [14, 22, 24]. Most studies with a FFQ of
more than 40 items had detailed information on dietary
intake of meat, vegetables, fruit and beverages. The use
of a validated FFQ questionnaire was reported in eight
studies [12, 19, 23, 28–30, 32–34], while one study
checked the reproducibility of its FFQ [20]. Most of the
studies assessed portion size, while four studies [12, 28,
29, 33, 34] reported the quantitative intake of food items
in grams. Six studies [10, 19, 28, 30, 32–34] also
pro-vided data on nutrients.
The consumption of beverages was reported in all the
eighteen case–control studies. Five case–control studies
[12, 13, 16, 19, 26] had detailed information for each of
the larger food categories of the Eurocode 2 Food Coding
System, while three studies [11, 23, 25] missed only data
on sugar and/or fat (Table 4). Fat, grains, nuts and sugar
were also missing in another four studies [10, 15, 17, 20].
The six cohort studies [28–34] had detailed information
in each food categories with the exception of the RERF
atomic bomb survivors study [31] which had no data on
sugar intake.
Discussion
The high number of cases (11,261) and controls (675,532)
from 24 epidemiological studies included in the BLEND
study makes the BLEND study the largest dataset on diet
and UBC worldwide. A large sample size provides the
po-tential to analyze in more detail food items rarely
con-sumed [35] and allows delineating the generally weak
association between UBC cancer and dietary intake for food
categories. The advantage of pooling individual data
com-pared to meta-analysis of aggregate data are multiple: it
in-creases the power to detect the effect for food items more
rarely consumed, it allows to adjust for the same
confound-ing factors, gender, age, and smokconfound-ing status, to test for
interaction and to perform subgroup analyses [36, 37].
Demographic data in the BLEND study are consistent
with the IARC CancerBase [1]. The male/female ratio in
our dataset was 3:1. Worldwide the male/female ratio is
3.3:1. Europe is responsible for nearly 40 % of the UBC
cases worldwide while the Asian population account for
28 % of the UBC incidence [1]. In our dataset, 49 % of
the cases are from Europe while only 10 % of the cases
are from Asia. The African and the Eastern
Mediterra-nean region is responsible for only 9 % of the UBC
inci-dence worldwide [1]. These regions are not represented
in our dataset. In America and Europe, more than 90 %
of the UBC cases are transitional cell carcinoma (TCC),
while in Africa, up tot 40 % of the UBC cases can be
squa-mous cell carcinomas (SCC) [38, 39] due to infection with
Schistosoma haematobium (Bilharziasis) [40]. The Egyptian
multi-center case–control study [41] had not yet been
pub-lished when we collected our data. So, pooling of the data
of the different countries is possible because most
industri-alized countries are likely to share the same risk factors for
UBC. Otherwise, it will be possible to stratify analyses by
region given the large number of included participants. We
aim to update the BLEND database in the future with new
available studies.
Conclusion
The available data in the very large BLEND database will
allow us to test associations between individual food items
of the different food items categories, even those less
com-monly consumed, and the risk for UBC. We will also
inves-tigate food patterns such as the Mediterranean diet and
the influence of nutrients on the risk of UBC. In addition,
the large sample size will allow subgroup analyses.
Abbreviations
BLEND, the BLadder cancer, Epidemiology, and Nutritional Determinants study; FFQ, food frequency questionnaire; OR, odds ratio; SCC, squamous cell carcinoma; SD, standard deviation; TCC, transitional cell carcinoma; TNM, TNM Classification of Malignant Tumors; UBC, urinary bladder cancer; WCRF, World Cancer Research Fund.
Acknowledgements
We acknowledge all principal investigators for their willingness to participate in this jointed project.
Funding
Hessen Case–control study on bladder cancer was supported by the Bundesanstalt für Arbeitsschutz (No. F 1287). The Aichi Prefecture Case–control study was supported by a Smoking Research Foundation Grant for Biomedical Research. The Kaohsiung study was supported by grant NSC 85-2332-B-037-066 from the National Scientific Council of the Republic of China. The Stockholm Case–control study was supported by grant from the Swedish National Cancer Society and from the Swedish Work Environment Fund. The Roswell Park Memorial Institute Case–control study on bladder cancer was supported by Public Health Service Grants CA11535 and CA16056 from the National Cancer Institute.
The New England bladder cancer study was funded in part by grant numbers 5 P42 ES007373 from the National Institute of Environmental Health Sciences, NIH and CA57494 from the National Cancer Institute, NIH. The Italian Case–control study on bladder cancer was conducted within the framework of the CNR (Italian National Research Council) Applied Project“Clinical Application of Oncological Research” (contracts 94.01321.PF39 and 94.01119.PF39), and with the contributions of the Italian Association for Cancer Research, the Italian League against Tumours, Milan, and Mrs. Angela Marchegiano Borgomainerio.
The Brescia bladder cancer study was partly supported by the International Agency for Research on Cancer. The French INSERM study was supported by a grant from the Direction Générale de la Santé, Ministère des Affaires Sociales, France. The Molecular Epidemiology of Bladder Cancer and Prostate Cancer was supported in part by grants ES06718 (to Z.-F.Z.), U01 CA96116 (to A.B.), and CA09142 from the NIH National Institute of Environmental Health Sciences, the National Cancer Institute, the Department of Health and Human Services, and by the Ann Fitzpatrick Alper Program in Environmental Genomics at the Jonsson Comprehensive Cancer Center, UCLA. The Swedish Mammography Cohort (SMC) & the Cohort of Swedish Men was supported by the Swedish Cancer Foundation, Örebro County Council Research Committee, and Swedish Research Council Committee for Infrastructure. The Netherlands Cohort Study on diet and cancer was supported by the Dutch Cancer Society. The RERF atomic bomb survivors Study was supported by The Radiation Effects Research Foundation (RERF), Hiroshima and Nagasaki, Japan, a public interest foundation funded by the Japanese Ministry of Health, Labour and Welfare (MHLW) and the US Department of Energy (DOE). The research was also funded
in part through DOE award DE-HS0000031 to the National Academy of Sciences. This publication was supported by RERF Research Protocol RP-A5-12. The VITamins and Lifestyle Study (VITAL) was supported by a grant (R01CA74846) from the National Cancer Institute. The European Prospective Investigation into Cancer and Nutrition (EPIC) was carried out with financial support of the ‘Europe Against Cancer’ Programme of the European Commision (SANCO); Ligue contre le Cancer (France); Société 3 M (France); Mutuelle Générale de l’Education Nationale; Institut National de la Santé et de la Recherche Médicale (INSERM); Institute Gustave Roussy; German Cancer Aid; German Cancer Research Centre; German Federal Ministry of Education and Research; Danish Cancer Society; Health Research Fund (FIS) of the Spanish Ministry of Health; the Spanish Regional Governments of Andalucia, Asturias, Basque Country, Murcia and Navarra; Cancer Research UK; Medical Research Council, UK; Stroke Association, UK; British Heart Foundation; Department of Health, UK; Food Standards Agency, UK; Wellcome Trust, UK; Greek Ministry of Health; Greek Ministry of Education; Italian Association for Research on Cancer; Italian National Research Council; Dutch Ministry of Public Health, Welfare and Sports; Dutch Prevention Funds; LK Research Funds; Dutch ZON (Zorg Onderzoek Nederland); World Cancer Research Fund; Swedish Cancer Society; Swedish Scientific Council; Regional Government of Skane, Sweden; Norwegian Cancer Society; Norwegian Research Council. Partial support for the publication of this supplement was provided by the Centre de Recherche et d’Information Nutritionnelles (CERIN). Availability of data and material
The dataset described in this article will be available at Dataverse (https:// dataverse.nl/dvn/).
Authors’ contributions
MEG collected and harmonized data, performed the statistical analysis and wrote the manuscript. F.I., D.M., R.R. and A.W. harmonized the data, reviewed and edited the manuscript. M.B. collected the data and reviewed and edited the manuscript. SB, BB, MFA, KG, EG, XJ, KCJ, MRK, EK, ClV, CML, JM, HP, SP, GS, LT, JT, PvdB, PJV, KW, EW, EW, AW and ZFZ provided the data, reviewed and edited the manuscript. FB reviewed and edited the manuscript, and MPZ. supervised the study, reviewed and edited the manuscript. All authors read and approved the final manuscript.
Competing interests
This study was partly funded by the World Cancer Research Fund. Consent for publication
Not applicable.
Ethics approval and consent to participate
Each participating study has been approved by the local ethic committee. Author details
1
Department of General Practice, Katholieke Universiteit Leuven, ACHG-KU Leuven, Kapucijnenvoer 33, Blok J, bus 7001, 3000 Leuven, Belgium.
2Department of Public Health, Epidemiology and Biostatistics, University of
Birmingham, Birmingham, UK.3The Cancer Council Victoria, Melbourne,
Australia.4NUTRIM School for Nutrition and Translational Research in Metabolism, University of Maastricht, Maastricht, The Netherlands.5INSERM
U946, Variabilite Genetique et Maladies Humaines, Fondation Jean Dausset / CEPH, Paris, France.6Laboratory of General Epidemiology, Istituto di Ricerche
Farmacologiche“Mario Negri”, Milan, Italy.7Determinants of Chronic Diseases (DCD), National Institute for Public Health and the Environment (RIVM), Bilthoven, The Netherlands.8Gastroenterology and Hepatology, University
Medical Centre, Utrecht, The Netherlands.9Epidemiology and Biostatistics,
The School of Public Health, Imperial College London, London, UK.10Social and Preventive Medicine, Faculty of Medicine, University of Malaya, Kuala Lumpur, Malaysia.11Department of Medical and Surgical Specialties,
Radiological Sciences and Public Health, Section of Public Health and Human Sciences, University of Brescia, Brescia, Italy.12Department of Preventive Medicine and Public Health, Faculty of Medicine, University of Cordoba, Cordoba, Spain.13Leibniz Research Centre for Working Environment and
Human Factors at TU Dortmund, Dortmund, Germany.14Department of
Epidemiology Radiation Effects Research Foundation, Hiroshima, Japan.
15Department of Preventive Medicine, University of Southern California, Los
Angeles, CA, USA.16Department of Epidemiology and Community Medicine,
University of Ottawa, Ottawa, ON, Canada.17Department of Epidemiology,
Geisel School of Medicine at Dartmouth, Hanover, NH, USA.18Leuven
University Centre for Cancer Prevention (LUCK), Leuven, Belgium.
19Department of Clinical Medicine and Community Health, University of
Milan, Milan, Italy.20Department of Urology, Buddhist Dalin Tzu Chi General Hospital, Dalin Township 62247, Chiayi County, Taiwan.21Department of
Cancer Prevention and Control, Roswell Park Cancer Institute, Buffalo, NY, USA.22Leibniz Institute for Prevention Research and Epidemiology– BIPS,
Bremen, Germany.23Department of Oncology and Pathology, Division of Clinical Cancer Epidemiology, Karolinska Hospital, Stockholm, Sweden.
24Epidemiology Branch, and Epigenetic and Stem Cell Biology Laboratory,
National Institute of Environmental Health Sciences, NIH, Research Triangle Park, NC, USA.25Department of Epidemiology, Schools for Oncology and Developmental Biology and Public Health and Primary Care, Maastricht University Medical Centre, Maastricht, The Netherlands.26Population Studies
Division Health Canada, Ottawa, ON, Canada.27Department of Preventive
medicine, Nagoya University Graduate School of Medicine, Nagoya, Japan.
28Department of Medical Epidemiology and Biostatistics, Medical
Epidemiology, Karolinska Institutet, Stockholm, Sweden.29Department of
Research, Cancer Registry of Norway, Institute of Population-Based Cancer Research, Oslo, Norway.30Genetic Epidemiology Group, Folkhälsan Research Center, Helsinki, Finland.31Department of Community Medicine, University of
Tromsø, The Arctic University of Norway, Tromsø, Norway.32Fred Hutchinson
Cancer Research Center, Seattle, WA, USA.33Division of Nutritional
Epidemiology, Institute of Environmental Medicine, Karolinska Institutet, Stockholm, Sweden.34Departments of Epidemiology, UCLA Center for
Environmental Genomics, Fielding School of Public Health, University of California, Los Angeles (UCLA), Los Angeles, CA, USA.35CAPHRI School for
Public Health and Primary Care, University of Maastricht, Maastricht, The Netherlands.36School of Cancer Sciences, University of Birmingham,
Birmingham, UK.
Received: 10 March 2016 Accepted: 18 May 2016
References
1. Ferlay J, Soerjomataram I, Ervik M, Dikshit R, Eser S, Mathers C et al. GLOBOCAN 2012 v1.0, Cancer Incidence and Mortality Worldwide: IARC CancerBase No. 11 [Internet]. Lyon, France: International Agency for Research on Cancer. 2013; Available from: http://globocan.iarc.fr/Default.aspx (Accessed 18 Feb 2014). 2. Botteman MF, Pashos CL, Hauser RS, Laskin BL, Redaelli A. Quality of life aspects of bladder cancer: a review of the literature. Qual Life Res. 2003; 12(6):675–88.
3. Cooksley CD, Avritscher EB, Grossman HB, Sabichi AL, Dinney CP, Pettaway C, et al. Clinical model of cost of bladder cancer in the elderly. Urology. 2008;71(3):519–25. doi:10.1016/j.urology.2007.10.056.
4. World Cancer research Fund/ American Institute for Cancer Research. Food, nutrition, physical activity and the prevention of cancer: a global perspective. Washington DC: AIRC; 2007.
5. World Cancer Research Fund International/American Institute for Cancer Research. Continuous Update Project Report: Diet, Nutrition, Physical Activity and Bladder Cancer. Available at: http://wcrf.org/sites/default/files/Bladder-Cancer-2015-Report.pdf. 2015 (Accessed 11 Feb 2016).
6. Reulen RC, Kellen E, Buntinx F, Zeegers MP. Bladder cancer and occupation: a report from the Belgian case–control study on bladder cancer risk. Am J Ind Med. 2007;50(6):449–54. doi:10.1002/ajim.20469.
7. Unwin I. Eurocode 2 Core classification version 99/1. http://www.ianunwin. demon.co.uk/eurocode/docmn/ec99/ecmg01cl.htm. 1999 (Accessed Sept 2010). 8. Poortvliet EJ, Klensin JC, Kohlmeier L. Rationale document for the eurocode
food coding system. Eur J Clin Nutr. 1992;46(Suppl5):S9–S24.
9. NIST/SEMATECH. e-Handbook of Statistical Methods, Scatterplot:Outlier, http:// www.itl.nist.gov/div898/handbook/eda/section3/scattera.htm. 2013:1.3..26.10. (Accessed 29 Sept 2015).
10. Jiang X, Castelao JE, Groshen S, Cortessis VK, Ross RK, Conti DV, et al. Alcohol consumption and risk of bladder cancer in Los Angeles county. Int j cancer J int du cancer. 2007;121(4):839–45. doi:10.1002/ijc.22743.
11. Tang L, Zirpoli GR, Guru K, Moysich KB, Zhang Y, Ambrosone CB, et al. Consumption of raw cruciferous vegetables is inversely associated with bladder cancer risk. Cancer Epidemiol Biomark Prev: pub Am Assoc Cancer Res, cosponsored Am Soc Prev Oncol. 2008;17(4):938–44. doi:10.1158/1055-9965.EPI-07-2502.
12. Kellen E, Zeegers M, Paulussen A, Van Dongen M, Buntinx F. Fruit consumption reduces the effect of smoking on bladder cancer risk. The Belgian case control study on bladder cancer. Int j cancer J int du cancer. 2006;118(10):2572–8. doi:10.1002/ijc.21714.
13. Wakai K, Takashi M, Okamura K, Yuba H, Suzuki K, Murase T, et al. Foods and nutrients in relation to bladder cancer risk: a case–control study in Aichi prefecture. Central Japan Nutr Cancer. 2000;38(1):13–22.
14. Lu CM, Lan SJ, Lee YH, Huang JK, Huang CH, Hsieh CC. Tea consumption: fluid intake and bladder cancer risk in southern Taiwan. Urology. 1999; 54(5):823–8.
15. Pohlabeln H, Jöckel KH, Bolm-Audorff U. Non-occupational risk factors for cancer of the lower urinary tract in Germany. Eur J Epidemiol. 1999;15(5): 411–9.
16. Steineck G, Hagman U, Gerhardsson M, Norell SE. Vitamin a, supplements, fried foods, fat and urothelial cancer. A case-referent study in Stockholm in 1985–87. Int j cancer J int du cancer. 1990;45(6):1006–11.
17. Mettlin C, Graham S. Dietary risk factors in human bladder cancer. Am J Epidemiol. 1979;110(3):255–63.
18. Baena AV, Allam MF, Del Castillo AS, Diaz-Molina C, Requena Tapia MJ, Abdel-Rahman AG, et al. Urinary bladder cancer risk factors in men: a Spanish case–control study. Eur J Cancer Prev. 2006;15(6):498–503. 19. Brinkman MT, Karagas MR, Zens MS, Schned A, Reulen RC, Zeegers MP.
Minerals and vitamins and the risk of bladder cancer: results from the New Hampshire study. Cancer causes control : CCC. 2010;21(4):609–19. doi:10. 1007/s10552-009-9490-0.
20. D’Avanzo B, La Vecchia C, Negri E, Decarli A, Benichou J. Attributable risks for bladder cancer in northern Italy. Ann Epidemiol. 1995;5(6):427–31. 21. Shen M, Hung RJ, Brennan P, Malaveille C, Donato F, Placidi D, et al.
Polymorphisms of the DNA repair genes XRCC1, XRCC3, XPD, interaction with environmental exposures, and bladder cancer risk in a case–control study in northern Italy. Cancer Epidemiol Biomark Prev : pub Am Assoc Cancer Res, cosponsored Am Soc Prev Oncol. 2003;12(11 Pt 1):1234–40. 22. Ovsiannikov D, Selinski S, Lehmann ML, Blaszkewicz M, Moormann O, Haenel
MW, et al. Polymorphic enzymes, urinary bladder cancer risk, and structural change in the local industry. J Toxicol Environ Health A. 2012;75(8–10):557–65. doi:10.1080/15287394.2012.675308.
23. Johnson KC, Mao Y, Argo J, Dubois S, Semenciw R, Lava J. The national enhanced cancer surveillance system: a case–control approach to environment-related cancer surveillance in Canada. Envirometrics. 1998;9:495–504.
24. Clavel J, Cordier S. Coffee consumption and bladder cancer risk. Int j cancer J int du cancer. 1991;47(2):207–12.
25. Hemelt M, Hu Z, Zhong Z, Xie LP, Wong YC, Tam PC, et al. Fluid intake and the risk of bladder cancer: results from the south and east china case– control study on bladder cancer. Int j cancer J int du cancer. 2010;127(3): 638–45. doi:10.1002/ijc.25084.
26. Cao W, Cai L, Rao JY, Pantuck A, Lu ML, Dalbagni G, et al. Tobacco smoking, GSTP1 polymorphism, and bladder carcinoma. Cancer. 2005;104(11):2400–8. doi:10.1002/cncr.21446.
27. Taylor JA, Umbach DM, Stephens E, Castranio T, Paulson D, Robertson C, et al. The role of N-acetylation polymorphisms in smoking-associated bladder cancer: evidence of a gene-gene-exposure three-way interaction. Cancer Res. 1998;58(16):3603–10.
28. Larsson SC, Andersson SO, Johansson JE, Wolk A. Fruit and vegetable consumption and risk of bladder cancer: a prospective cohort study. Cancer Epidemiol Biomark Prev : pub Am Assoc Cancer Res, cosponsored Am Soc Prev Oncol. 2008;17(9):2519–22.
29. Zeegers MP, Goldbohm RA, van den Brandt PA. Are retinol, vitamin C, vitamin E, folate and carotenoids intake associated with bladder cancer risk? results from the Netherlands cohort study. Br J Cancer. 2001;85(7):977–83. 30. Behrens G, Leitzmann MF, Sandin S, Lof M, Heid IM, Adami HO, et al. The
association between alcohol consumption and mortality: the Swedish women's lifestyle and health study. Eur J Epidemiol. 2011;26(2):81–90. doi:10.1007/s10654-011-9545-x.
31. Ozasa K, Shimizu Y, Suyama A, Kasagi F, Soda M, Grant EJ, et al. Studies of the mortality of atomic bomb survivors, report 14, 1950–2003: an overview of cancer and noncancer diseases. Radiat Res. 2012;177(3):229–43. 32. White E, Patterson RE, Kristal AR, Thornquist M, King I, Shattuck AL, et al.
VITamins and lifestyle cohort study: study design and characteristics of supplement users. Am J Epidemiol. 2004;159(1):83–93.
33. Riboli E, Kaaks R. The EPIC project: rationale and study design. European prospective investigation into cancer and nutrition. Int J Epidemiol. 1997;26 Suppl 1:S6–S14.
34. Riboli E, Hunt KJ, Slimani N, Ferrari P, Norat T, Fahey M, et al. European prospective investigation into cancer and nutrition (EPIC): study populations and data collection. Public Health Nutr. 2002;5(6B):1113–24. doi:10.1079/PHN2002394. 35. Souverein OW, Dekkers AL, Geelen A, Haubrock J, de Vries JH, Ocke MC,
et al. Comparing four methods to estimate usual intake distributions. Eur J Clin Nutr. 2011;65 Suppl 1:S92–S101. doi:10.1038/ejcn.2011.93.
36. Riley RD, Lambert PC, Abo-Zaid G. Meta-analysis of individual participant data: rationale, conduct, and reporting. BMJ. 2010;340:c221. doi:10.1136/bmj.c221. 37. Blettner M, Sauerbrei W, Schlehofer B, Scheuchenpflug T, Friedenreich C.
Traditional reviews, meta-analyses and pooled analyses in epidemiology. Int J Epidemiol. 1999;28(1):1–9.
38. Goossens ME, Buntinx F, Zeegers MP. Aetiology, demographics and risk factors for bladder cancer. In: The Oxford textbook of surgery. Oxford University Press (OUP). 2016, in press.
39. Parkin DM. The global burden of urinary bladder cancer. Scand J Urol Nephrol Suppl. 2008;218:12–20.
40. Sitas F, Parkin DM, Chirenje M, Stein L, Abratt R, Wabinga H. Part II: cancer in indigenous Africans–causes and control. Lancet Oncol. 2008;9(8):786–95. doi:10.1016/S1470-2045(08)70198-0.
41. Zheng YL, Amr S, Saleh DA, Dash C, Ezzat S, Mikhail NN, et al. Urinary bladder cancer risk factors in Egypt: a multicenter case–control study. Cancer Epidemiol Biomark Prev : pub Am Assoc Cancer Res, cosponsored Am Soc Prev Oncol. 2012;21(3):537–46. doi:10.1158/1055-9965.EPI-11-0589.
• We accept pre-submission inquiries
• Our selector tool helps you to find the most relevant journal
• We provide round the clock customer support
• Convenient online submission
• Thorough peer review
• Inclusion in PubMed and all major indexing services
• Maximum visibility for your research Submit your manuscript at
www.biomedcentral.com/submit