Nephrol Dial Transplant (2015) 0: 1–11 doi: 10.1093/ndt/gfv017
Original Article
Altered monocyte expression and expansion of non-classical
monocyte subset in IgA nephropathy patients
Sharon N. Cox
1,*, Grazia Serino
1,*, Fabio Sallustio
1, Antonella Blasi
2, Michele Rossini
1, Francesco Pesce
3and Francesco Paolo Schena
4,51Department of Emergency and Organ Transplantation, University of Bari, Bari, Italy,2Medestea Research and Production Laboratories, Consorzio CARSO, Bari, Italy,3Genomics of Common Disease, Imperial College, London, UK,4C.A.R.S.O. Consortium, Valenzano, Bari, Italy and5Research Center of Kidney Diseases, Schena Foundation, Valenzano, Bari, Italy
Correspondence and offprint requests to: Francesco Paolo Schena, E-mail: [email protected] *S.N.C. and G.S. contributed equally to this work.
A B S T R AC T
Background.The main defect of immunoglobulin A nephropa-thy (IgAN) lies within the immune system and in peripheral blood mononuclear cells rather than in the kidney. Previously, we found an altered gene expression in monocytes compared with B and T cells isolated from IgAN patients; thus, our aim here has been to study this subset at a genome-wide and functional level. Methods. A total of 39 IgAN patients and 37 healthy blood donors (HBDs) were included in this study, and microarray technology was used to evaluate global gene expression differ-ences in monocytes isolated from IgAN patients and HBDs. Aberrantly expressed genes and pathways were then validated on an independent set of IgAN patients with RT–PCR western blot andflow cytometric analysis.
Results.Gene expression differences in monocytes from IgAN patients and HBDs primarily involved apoptosis signalling, mitochondrial dysfunction, tnfr2/1 and death receptor signal-ling. Both the extrinsic and intrinsic apoptotic pathways seem to be implicated; in particular, the protein levels of NDUFS3 and TNFRSF1A were upregulated thus confirming the altered mitochondrial and death receptor homeostasis. Furthermore, the basal intracellular protein levels of TNF in monocytes were lower in IgAN patients compared with HBDs. We validated at protein level an enhanced apoptotic phenotype and a different subset distribution in monocytes from IgAN patients. We found that the non-classical monocyte subset (CD14+CD16+) was significantly expanded in all IgAN patients tested even though the total monocyte count remained unchanged.
Conclusions.Our findings demonstrate, for the first time, an aberrant modulation of the mitochondrial respiratory system in monocytes isolated from IgAN patients. Furthermore, the aber-rant expansion of the (CD14+CD16+) subset could explain the enhanced apoptotic phenotype seen in these cells thus revealing their potential role in the pathogenesis of IgAN.
Keywords: apoptosis, IgA nephropathy, monocytes, tran-scriptomics
INTRODUCTIO N
Immunoglobulin A nephropathy (IgAN) is the most common form of primary glomerulonephritis worldwide among patients undergoing renal biopsy. Approximately 40% of patients, older than 30 years, develop end-stage renal disease after 20 years from the renal biopsy [1,2].
The pathogenesis of IgAN has been studied in the attempt to unravel key abnormalities of the disease, and to date significant progress has been made. The incomplete understanding of the cellular events involved in the synthesis of deglycosylated IgA1, consequent formation of circulating immune complexes and mesangial deposition, have hampered the development of spe-cific therapeutic strategies in IgAN [3]. However, the abnormal-ity lies within the IgA immune system and in peripheral blood leucocytes rather than local kidney abnormalities as suggested by the recurrence of IgA deposits in IgAN patients after trans-plantation [4–6]. In particular, peripheral blood mononuclear cells (PBMCs) from IgAN patients have been found to be NDT Advance Access published March 13, 2015
hyperactivated with the involvement of cellular machinery im-plicated in antigen processing [7–10].
Innate immunity seems to be altered in IgAN patients since macrohematuria coincides with or immediately follows an upper respiratory or gastrointestinal tract infection [11]. Common pathogens and alimentary components have been found to be able to reproduce IgAN in mice, and some of these exogenous antigens can also be detected in the renal tissue [12–15]. The link between mucosal encountered antigens and the occurrence of glomerular haematuria could be explained by cytotoxic CX3CR1-positive cells that are upregulated during the macrohe-maturic episode and direct towards the glomerular endothelial cells and podocytes where the counter receptor CX3CL1 is upre-gulated. The defect in antigen handling has also been demon-strated in vitro in LPS-stimulated PBMCs isolated from IgAN patients [8].
Our previous work evidenced a more profound altered gene expression pattern in monocytes compared with B and T cells isolated from IgAN patients [7]. In particular, this subset could have a pathogenic role in IgAN, as polymeric IgA aggre-gates the FcαRI on monocytes and induces shedding of the extracellular domain to form circulating IgA1–FcαRI com-plexes [16–18]. This receptor is activated through PI3K [19], which seems to have a central role in monocytes from IgAN patients. TLR-4 transcriptional levels and surface expression were also found aberrantly increased in peripheral monocytes isolated from IgAN patients particularly coinciding with urinary activity [9].
Monocytes are phagocytes generated in the bone marrow and released into the bloodstream [20,21]. In peripheral tissues, they give rise to macrophages and dendritic cells. Undifferenti-ated monocytes are heterogeneous and represent a short-lived transitional state [22] and can be classified into three main subsets with distinctive transcriptional and functional charac-teristics: classical (CD14++CD16−), intermediate (CD14+
+CD16+) and non-classical (CD14+CD16+) [23–25], the latter
cells are characterized by a marked apoptotic propensity [26]. The migratory properties of monocyte subsets are differently based on their chemokine receptor expression. The classical monocytes show a marked CCR2+CX3CR1low expression whereas non-classical monocytes show CCR2−CX3CR1high expression and migrate preferentially towards to their CCL2 and CX3CL1 counter receptors, respectively [27,28].
Since monocytes are potentially key players in both innate and adaptive immune responses and various reports confer a potential pathogenic role of these cells in IgAN pathogenesis, our aim here has been to study the monocyte subset more closely at a genome and functional level.
M AT E R I A L S A N D M E T H O D S Sample collection
A total of 39 biopsy-proven IgAN patients and 37 healthy blood donors (HBDs) were included in the whole study after providing their informed consent, and the experimental proto-col was carried out in accordance with the Declaration of Helsinki. The main demographic and clinical features of
patients and controls, included in the study, are summarized in Table1. Demographic and clinical features refer to the time of the follow-up. Histological classifications refer to the time of biopsy-proven diagnosis. There were no statistically significant differences between the groups for all considered parameters. All IgAN patients were characterized by a normal renal function as defined by the estimated glomerular filtration rate (eGFR) >90 mL/min/1.73 m2 body surface area (evaluated by Cock-croft-Gault formula). Lumped and split systems were used for histological evaluation of the renal lesions. For the lumped system, we used Schena’s classification that identifies three severity grades: mild G1, moderate G2 and severe G3 [29]; following this classification, our patients were characterized by mild–moderate histological lesions (G1–G2). For the split system, based on the score for each of the pathological variables in the renal compartments, we used the Oxford Classification [30, 31]. Proteinuria values were <1 g/day, and patients were affected by non-active phase of the disease (absence of macroscopic haematuria). In addition, subjects suffering from diabetes, chronic lung, cardiovascular diseases, neoplasm or in-flammatory diseases were excluded from the study. All patients did not receive corticosteroids and/or immunosuppressive agents during their follow-up of at least 10 years.
Monocyte isolation and RNA extraction
Peripheral blood mononuclear cells were freshly isolated from heparinized venous blood using Ficoll-Hypaque. Mono-cytes were then routinely purified by immuno-labelling PBMCs with CD14-positive selection kits following the manufacturer’s specifications (EasySep, StemCell Technologies, Canada). The obtained preparations showed a monocyte viability of 95% as determined by trypan blue exclusion, and the purity was at least 97% as assessed by flow cytometric analysis. For gene Table 1. Demographic and clinical features of IgAN patients and healthy blood donors included in the studya
IgAN HBD Number 39 37 Male/female 24/15 26/11 Age (years) 40.1 ± 2.2 33.4 ± 9.5 sCr (mg/dL) 0.92 ± 0.03 0.82 ± 0.3 eGFR (mL/min/1.73 m2) 115.3 ± 5.5 109.3 ± 4.3 Proteinuria (g/24 h) 0.33 ± 0.04 n.d. Systolic BP (mmHg) 118.5 ± 4 120 ± 8 Diastolic BP (mmHg) 77 ± 1 75 ± 3
Lumped system classificationb
(%) G1 55 G2 45
n.d. Split system classificationc
(%) M score 1 42.8 n.d. E score 1 10.7 n.d. S score 2 46.4 n.d. T score 1 14.3 n.d. T score 2 0 n.d.
sCr, serum creatinine; eGFR, estimated glomerularfiltration rate calculated with the Cockcroft-Gault formula (mL/min/1.73 m2); G1, grade 1 mild; G2, grade 2 moderate;
HBD, healthy blood donors; n.d, not determined.
aValues are expressed as mean ± SEM.
bLumped system is depicted by Schena’s histological classification (29).
cSplit System is depicted by the Oxford histological Classification (30,31). Data refer to
the time of the follow-up. Histological classifications refer to the time of biopsy-proven diagnosis.
ORIGINAL
expression analyses, total RNA was extracted from monocytes by RNeasy Mini kit (Qiagen) according to the manufacturer’s protocol. RNA concentration and quality were assessed with NanoDrop Spectrophotometer (Nanodrop Technologies) and Agilent 2100 Bioanalyzer (Agilent Technologies), respectively.
Gene expression profiling
For microarray analysis, we randomly selected eight IgAN patients and nine HBDs. Transcriptome data were generated using the HumanHT-12 v4 Expression BeadChip (Release 38, Illumina, San Diego, CA, USA). In this process, 500 ng of total RNA was used to synthesize biotin-labelled cRNA using the Illumina
®
TotalPrep™ RNA amplification kit (Applied biosys-tems/Ambion, USA). Quality of labelled cRNA was measured using the NanoDrop® ND-100 spectrophotometer and the Agilent 2100 Bioanalyzer, and 750 ng of biotinylated cRNA was used for the hybridization to gene-specific probes on the Illumi-na microarrays. The IllumiIllumi-na arrays were then scanned with the HiScanSQ. Microarray statistical analyses were performed by Genespring GX 11.0 software (Agilent Tech, Inc., Santa Clara, CA, USA). Identification of differentially expressed genes was carried out with the false discovery rate (FDR) method of Benja-mini–Hochberg, and gene probe sets were filtered on the basis of their corrected P-value with multiple testing on 1000 permu-tations. Only genes that were significantly modulated (adjusted-P-value < 0.05) were considered for further analysis.The Illumina microarray data are MIAME compliant, and the raw data have been deposited in the GEO database and are accessible through GEO Series accession number GSE58539.
Quantitative real-time (qRT) PCR analysis
One microgram of total RNA was reverse-transcribed with High-Capacity cDNA Reverse Transcription (Applied Biosys-tems, Foster City, CA) following the manufacturer’s instruc-tions. Real-time PCR amplification reactions were performed in triplicate in 25μL of final volumes via SYBR Green chemistry on an iCycler (Bio-Rad Laboratories, Hercules, CA, USA) for TNF, CD83, TNFRSF1A and NDUFS3. PCR was performed using the QuantiTect Primer Assay (Qiagen, Basel, Switzerland) and the QuantiFast SYBR Green PCR mix (Qiagen, Basel, Switzerland). All genes were amplified according to the Real-Time Cycler conditions suggested by Qiagen. Theβ-actin gene amplification was used as a reference standard to normalize the target signal. Amplification specificity was controlled by a melting curve, and the amount of mRNA target was evaluated using the comparative cycle threshold (ΔCt) method.
Western blot analysis for NDUSF3 and TNFRSF1A Monocytes were lysed in RIPA buffer, and total protein concentration was determined with the standard Bradford colorimetric assay. Eighty micrograms of proteins from each lysate were subjected to SDS–PAGE and then electro-transferred onto PVDF membrane (HybondTM, Amersham, UK). Membranes were probed with primary monoclonal anti-bodies for NDUSF3 (abcam ab14711) and TNFRSF1A (abcam ab68160), then incubated with horseradish peroxidase-conjugated secondary antibody and detected with ECL method. The same membranes were stripped, and proteins
were rehybridized with anti-β-actin (sigma A1978) antibody. Images were quantified by Image J 1.34 Software (http://rsb.info .nih.gov/ij/). The intensity of bands, corresponding to the NDUSF3 and TNFRSF1A protein, was normalized to the actin signal.
Flow cytometric analysis
Intracytofluorimetric analysis of the basal levels of TNF was performed on purified cells after a 3-h incubation in complete culture medium (RPMI-1640 supplemented with antibiotics, 2 mM L-glutamine, 1 mM sodium pyruvate, 1 mM non-essential amino acids, 0.05 mM 2-ME, 25 mM HEPES buffer and 10% FBS) at 37°C in 5% CO2 in the presence of
5 µg/mL brefeldin A (Sigma–Aldrich B7651). After incuba-tion, cells were washed twice with FACS buffer (PBS pH 7.2, 0.05% BSA, 0.02% NaNo3) andfixed for 15 min with
formal-dehyde (2% in PBS pH 7.2). Cells were then washed and per-meabilized with FACS buffer containing 0.5% saponin and incubated for 30 min at room temperature with PE-conjugated TNF mAb (Sigma–Aldrich S4521). Cells were then washed and ready to be acquired. For monocyte spontaneous apop-tosis evaluation, Annexin V-FITC/7-AAD Kit (Beckman-Coulter, Milan Italy) was used. Purified monocytes were cultured for 3 h in serum-free RPMI 1640 culture medium, FITC-annexin V and 7-AAD were added to the samples and after a 15-min incubation, cells were re-suspended in an ap-propriate calcium-containing buffer included in the kit. For subpopulation analysis, the followingfluorescence-conjugated mAbs were used: FITC-CD14 and PE-CD16 (Beckman-Coulter, Milan Italy). All staining procedures and acquisition were performed following the manufacturer’s instructions. Positive events were acquired on an‘EPICS XL’ Flow Cytometer (Beckman-Coulter) and analysed using WinMDI Version 2.9 software. At least 104events for each sample were acquired. R E S U LTS
Altered gene expression patterns in monocytes of IgAN patients
Our previous study evidenced an altered gene expression pattern in monocytes compared with B and T cells isolated from IgAN patients [7]. This led us to focus our attention on this subset and evaluate if these differences were also marked at a genome-wide level. Thus, we used microarray technology to analyse the differences in gene expression between mono-cytes isolated from eight IgAN patients and nine HBDs. Bioinformatic analysis revealed 710 differently regulated probes (FDR-corrected P-value <0.05; Supplementary data, Table S1), of which 314 downregulated and 396 upregulated. The interactions between differently regulated probes were in-vestigated using the ingenuity pathway analysis (IPA) software, and we found that 554 were network/functions/pathways eligible genes. These genes were primarily involved in ‘Apop-tosis Signaling, mitochondrial dysfunction, tnfr2/1 and death receptor signaling’ canonical pathways (Table2). Additionally, the top-ranked networks included several genes encoding for regulators of these pathways, and both the extrinsic or death
ORIGINAL
receptor pathway (TNFRSF1A, TNFRSF1B, DAXX, TNF, Figure 1A, score 47) and the intrinsic or mitochondrial pathway seem to be involved (COX6B1, COX6C, COX7A2, COX7C, UQCRC1 Figure1B, score 42).
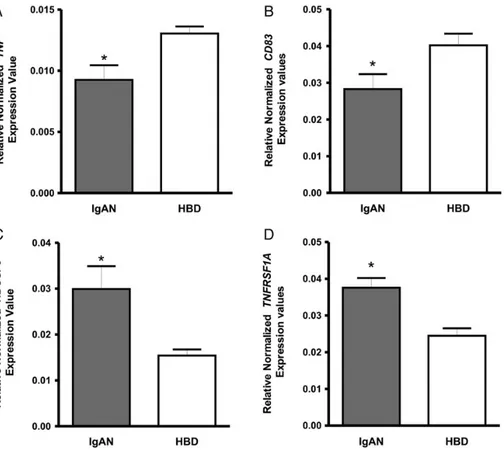
To further establish the validity of gene expression deter-mined by microarray analysis, we performed qRT-PCR on monocytes isolated from a larger cohort of 16 IgAN patients and 14 HBDs. We chose four representative genes tumour ne-crosis factor (TNF), CD83, tumour nene-crosis factor receptor superfamily, member 1A (TNFRSF1A) and a subunit of the mitochondrial NADH dehydrogenase, NDUFS3. Normalized gene expression levels for TNF and CD83 were significantly
lower in IgAN group compared with HBDs (P = 0.01, P = 0.03; Figure2A and B, respectively). On the other hand, NDUFS3, TNFRSF1A normalized gene expression levels were found to be significantly higher in IgAN patients (P = 0.01, P = 0.0006; Figure2C and D, respectively). These results were in line with those obtained by the gene expression array.
NDUSF3 protein levels in monocytes isolated from IgAN patients
Our genome-wide expression analysis demonstrated that various modulated genes belonged to the ‘mitochondrial dysfunction pathway’ (Supplementary data, Table S2 and Table 2. The most representative canonical pathways dysregulated in monocytes isolated from IgA nephropathy patients
IPA category Pathway P-valuea
Ratiob Gene symbol
Entrez gene name
Death receptor signalling 1.68E− 5 11/92 ACTB Actin, beta
CASP2 Caspase 2, apoptosis-related cysteine peptidase DAXX Death-domain-associated protein
DFFA DNA fragmentation factor, 45 kDa, alpha polypeptide
NFKBIA Nuclear factor of kappa light polypeptide gene enhancer in B cell inhibitor, alpha PARP4 Poly (ADP-ribose) polymerase family, member 4
TNF TNF
TNFRSF1A TNF receptor superfamily, member 1A TNFRSF1B TNF receptor superfamily, member 1B XIAP X-linked inhibitor of apoptosis ZC3HAV1 zincfinger CCCH-type, antiviral 1 Apoptosis signalling 6.9E− 5 10/89 CAPNS1 Calpain, small subunit 1
CASP2 Caspase 2, apoptosis-related cysteine peptidase DFFA DNA fragmentation factor, 45 kDa, alpha polypeptide MCL1 Myeloid cell leukaemia 1
NFKBIA Nuclear factor of kappa light polypeptide gene enhancer in B cell inhibitor, alpha RPS6KA1 Ribosomal protein S6 kinase, 90 kDa, polypeptide 1
TNF TNF
TNFRSF1A TNF receptor superfamily, member 1A TNFRSF1B TNF receptor superfamily, member 1B XIAP X-linked inhibitor of apoptosis Mitochondrial
dysfunction
3.4E− 4 13/ 171
ATP5J ATP synthase, H+ transporting, mitochondrial Fo complex, subunit F6 COX6B1 Cytochrome c oxidase subunit VIb polypeptide 1 (ubiquitous) COX6C Cytochrome c oxidase subunit VIc
COX7A2 Cytochrome c oxidase subunit VIIa polypeptide 2 (liver) COX7C Cytochrome c oxidase subunit VIIc
GPX4 Glutathione peroxidase 4 LRRK2 Leucine-rich repeat kinase 2
NDUFAF2 NADH dehydrogenase (ubiquinone) complex I, assembly factor 2
NDUFS2 NADH dehydrogenase (ubiquinone) Fe-S protein 2, 49 kDa (NADH-coenzyme Q reductase)
NDUFS3 NADH dehydrogenase (ubiquinone) Fe-S protein 3, 30 kDa (NADH-coenzyme Q reductase)
SDHA Succinate dehydrogenase complex, subunit A,flavoprotein (Fp) TXNRD2 Thioredoxin reductase 2
TNFR2 signalling 6.59E− 4 5/29 NFKBIA Nuclear factor of kappa light polypeptide gene enhancer in B cell inhibitor, alpha
TNF TNF
TNFAIP3 TNF, alpha-induced protein 3 TNFRSF1B TNF receptor superfamily, member 1B XIAP X-linked inhibitor of apoptosis TNFR1 signalling 1.41E− 3 6/49 CASP2 Caspase 2,
NFKBIA Nuclear factor of kappa light polypeptide gene enhancer in B cell inhibitor, alpha
TNF TNF
TNFAIP3 TNF, alpha-induced protein 3 TNFRSF1A TNF receptor superfamily, 1A XIAP X-linked inhibitor of apoptosis
aFischer’s exact test was used to calculate the P-value, determining the probability that the association between the genes in the data set and the canonical pathway is explained by chance
alone. To account for multiple canonical pathways tested by IPA, the FDR option was used (FDR < 0.1).
bThe ratio indicates the number of genes that have been found significantly modulated in our gene expression analysis compared with the total number of genes within the pathway.
ORIGINAL
F I G U R E 1 :Functional analysis of the top selected genes aberrantly expressed in monocytes isolated from IgA nephropathy patients. The network was algorithmically constructed by IPA software on the basis of the functional and biological connectivity of genes. The network is graphically represented as nodes (genes) and edges (the biological relationship between genes). Red- and green-shaded nodes represent up- and down-regulated genes, respectively; others (empty nodes) are those that IPA automatically includes because they are biologically linked to our genes based on the evidence in the literature. The analysis of the top-ranked network (score 48, 54 associated genes, P < 0.0001) showed that de-regulated genes were primarily involved in‘Apoptosis Signaling, mitochondrial dysfunction, tnfr2/1 and death receptor signaling’ canonical pathways. The top-ranked networks included several genes encoding for regulators of these pathways, and both the extrinsic or death receptor pathway (TNFRSF1A, TNFRSF1B, DAXX, TNF, score 47, Network A) and the intrinsic or mitochondrial pathway seem to be involved (COX6B1, COX6C, COX7A2, COX7C, UQCRC1, score 42, Network B).
ORIGINAL
Figure S1). Components of all five mitochondria respiratory chain complexes were found modulated in monocytes isolated from IgAN patients. We found two isoforms of the first complex, NADH dehydrogenase (NDUFS2 and NDUFS3), one isoform of the second complex succinate dehydrogenase (SDHA) one belonging to the third complex cytochrome c reductase (UQCRC1), three of the forth complex cytochrome c oxidase (COX6C, COX7A2 and COX7C) and one member of thefifth complex adenosine triphosphate synthase (ATP5J). These proteins are all involved in the aerobic respiration that is a metabolic pathway leading to the production of ATP by using the energy derived from the transfer of electrons in an electron transport system. We selected NDUSF3, the most modulated subunit of these complexes, and measured the protein levels in monocyte lysate from 12 IgAN patients and 12 HBDs to confirm their modulation also at the protein level. We found that the mean value of NDUFS3 protein level was significantly higher in IgAN patients (1.5 ± 0.15 NDUSF3/β-actin ratio) compared with HBDs (0.9 ± 0.0 NDUSF3/β-NDUSF3/β-actin ratio, P = 0.003) (Figure 3A and B) in line with what was observed in gene expression analysis.
TNFRSF1A and TNF protein levels in monocytes isolated from IgAN patients
Microarray data showed an upregulation of both TNF recep-tors TNFRSF1A and TNFRSF1B. Thefirst is the major medi-ator of TNF-induced signalling pathways that has pleiotropic
functions such as activation of nuclear factor kappaB (NF-kB) and induction of apoptosis. The second receptor, however, is mostly expressed in immune cells and mediates limited bio-logical responses [32]. Here, we decided to evaluate TNFRSF1A protein expression levels in monocyte lysates and found that protein levels were significantly higher in 12 IgAN patients (1.4 ± 0.17 TNFRSF1A/β-actin ratio) compared with 12 HBDs (0.8 ± 0.09 TNFRSF1A/β-actin ratio, P = 0.006, Figure3C and D), thus confirming in IgAN patients a modulation of the extrinsic/death receptor pathway. We further investigated the basal intracellular protein levels of TNF in monocytes using flow cytometry to confirm the decreased TNF expression found in microarray and RT–PCR. Cytometric analysis of protein levels confirmed the gene expression levels, and significantly lower values were found in IgAN patients compared with HBDs (4.700 ± 0.15, 9.400 ± 1.13, respectively, n = 3, P = 0.01; Figure3E and F).
Monocytes isolated from IgAN patients exhibit a higher level of spontaneous apoptosis
Since the most deregulated transcripts were involved in apoptotic pathways, we examined whether the higher expression of these genes in monocytes reflected a higher tendency to undergo spontaneous apoptosis using Annexin-V, an indicator of phosphatidylserine exposure during early apoptosis and 7-AAD that is an indicator of membrane damage during late apoptosis. Monocytes isolated from 12 IgAN patients and F I G U R E 2 :Gene expression levels evaluated by RT–PCR in monocytes isolated from 16 IgAN patients and 14 healthy blood donors (HBDs). (A) TNF and (B) CD83 normalized gene expression levels were significantly lower in IgAN group compared with HBDs (P = 0.01 and P = 0.03, respectively). (C) NDUFS3 (D) TNFRSF1A, normalized gene expression levels were found significantly higher in IgAN patients (P = 0.01, P = 0.0006; respectively). P-values obtained by unpaired t-test.
ORIGINAL
12 HBDs were cultured in serum-supplemented medium for 3 h, and spontaneous apoptosis was then evaluated. IgAN pa-tients showed a significantly higher percentage of double-positive cells (Figure 4A and B), indicating an enhanced early and late apoptotic potential (28.4 ± 5.0 ANNEX-V+/AAD+ CELLS) compared with monocytes isolated from HBDs (15.8 ± 2.1 ANNEX-V+/AAD+CELLS; P = 0.02) (Figure4C).
Monocyte subsets in IgAN patients
Human monocytes can be classified into three subsets based on light scatter properties evaluated byflow cytometry on cell-surface markers such as CD14 and CD16. In particular, the clas-sical monocytes show high CD14 expression but no CD16 (CD14++CD16−), and the non-classical monocytes express a low level of CD14 together with high CD16 (CD14+CD16+), an intermediate phenotype has also been described (CD14+
+CD16+), but here, we will refer to the two main classical and
non-classical subpopulations [24, 33]. An enhanced apoptotic propensity of non-classical monocytes has been extensively de-monstrated [26,34,35], we also found that CD16+monocytes showed a marked ANNEX-V+staining (77.23 ± 1.1) compared with CD16−monocytes (52.33 ± 6.1, n = 8, P = 0.0008, Supple-mentary data, Figure S2). We then tested whether the apoptotic phenotype seen in IgAN patients could be due to an aberrant expansion of this subset. We isolated monocytes from PBMCs with a purity of at least 97%, and we evidenced mainly two
distinct populations corresponding to classical monocytes and non-classical monocytes. The proportion of non-classical monocytes in 14 IgAN patients showed a significantly higher percentage of CD14+CD16+monocytes (27.7% ± 6.8) compared with 14 HBDs (9.5% ± 1.1, P = 0.008, Figure5), still maintaining a normal total monocyte count as demonstrated by the total blood cell count of all the understudied population (Supple-mentary data, Table S3).
D I S C U S S I O N
In the present study, we decided to focus our attention on monocytes, and as precursors of macrophages and dendritic cells, they play a central role in innate and adaptive immunity; both these systems seem to be hampered in IgAN [36]. We employed a whole-genome expression analysis on monocytes, never performed in the study of this complex disease in order to uncover new mechanisms involved with disease and to explain documented aberrancies found in monocytes of IgAN patients [7,9,16–18]. For this study, we selected IgAN patients and HBDs with normal renal function and normal blood cell counts. This rationale was used to identify differently modu-lated genes in the steady state and directly involved in the pathogenesis and not genes associated with the inflammatory phenotype that tend to emerge when the disease progresses. F I G U R E 3 :NDUFS3, TNFRSF1A and TNF protein levels in monocytes isolated from IgAN patients and healthy blood donors (HBDs). (A) NDUFS3 protein levels were significantly higher in IgAN patients (1.5 ± 0.15 NDUSF3/β-actin ratio) compared with HBDs (0.9 ± 0.07 NDUSF3/β-actin ratio, P = 0.003, n = 12). (B) Representative western blotting experiment for NDUFS3 on two IgAN patients and two HBDs. (C) TNFRSF1A protein levels were significantly higher in IgAN patients (1.4 ± 0.17 TNFRSF1A/β-actin ratio) compared with HBDs (0.8 ± 0.09 TNFRSF1A/β-actin ratio, P = 0.006, n = 12). (D) Representative western blotting experiment for TNFRSF1A on two IgAN patients and two HBDs. (E) Cytometric analysis of protein levels confirmed the gene expression levels and were found significantly lower in IgAN patients com-pared with HBDs (4.700 ± 0.15, 9.400 ± 1.13, respectively, n = 3, P = 0.01). (F) Representative TNF intracellular protein expression as measured byflow cytometry in monocytes was significantly lower in IgAN patient (grey solid-filled histogram) compared with HBDs (grey line). Histo-grams are compared with isotype control MoAB (dashed line histogram). These results were in line with gene expression levels observed with microarray. P-values obtained by unpaired t-test.
ORIGINAL
We demonstrated that several genes were able to discriminate IgAN patients from HBDs; mainly they were involved in the process of apoptosis. Both the extrinsic pathway, in which caspase is activated via the family TNF cell death receptors [37] and the intrinsic or mitochondrial pathway dependent on the release of proapoptotic proteins from mitochondria into the cytosol [38], seem activated in monocytes of IgAN patients. These cells are known to be relatively short lived and undergo spontaneous apoptosis in the absence of external survival signals, such as cytokines including TNF, microbial products and adherence [39–41]. Again the fate of cultured monocytes following a strong bacterial challenge shows rapid cell death either by classical apoptosis or by alternative death processes, concomitant with the exhaustion of functional competence and downregulation of pro-inflammatory responses [42]. In this context, our results confirmed the apoptosis signature also at protein level in monocytes of IgAN patients. This could be due to the enhanced antigenic stimulus either produced by viruses [43] or by common bacteria [42] constitutively present in the serum and tonsils of IgAN patients [14,15,44,45]. On the other hand, this apoptotic phenotype could be ascribed to the demon-strated downregulation of TNF gene and protein expression in monocytes of IgAN patients, as these cells are notably a major source of this pro-inflammatory cytokine. Recently, the adminis-tration of a TNFα inhibitor in a psoriasis patient exacerbated IgAN, and the authors come to the conclusion that the anti-TNFα treatment could have a pathogenic role in IgAN [46].
Functional analysis by IPA demonstrated that one of the top canonical pathways deregulated in monocytes from IgAN pa-tients involves the mitochondrial oxidative phosphorylation system. Components of allfive mitochondria respiratory chain complexes were modulated; in particular, we demonstrated an upregulation of NDUFS3 a 30-kDa subunit of the NADH:ubi-quinone oxidoreductase ETC complex I, which catalyses the first step of electron transfer from NADH to a non-covalently bound flavin mononucleotide and then, via a series of iron-sulphur clusters, to the terminal acceptor ubiquinone [47]. NDUFS3 is an iron-sulphur cluster protein directly involved in electron transfer and in reactive oxygen species (ROS) gener-ation and thus influencing oxidative stress [48, 49]. ROS may deeply influence a variety of key cell functions damaging pro-teins, lipids and nucleic acids [50]. Advanced oxidation protein products, well known markers of oxidative stress, have been found at a higher level in the sera and/or in erythrocytes of pa-tients with IgAN [51–54], significantly associated with protein-uria, and are early predictors of poor renal outcome [52]. In this context, oxidative stress constitutes a potential pathogenetic mechanism of IgAN that is supported by the encouraging results of therapeutic trials that use antioxidants in both experi-mental and human IgAN [55,56]. Nevertheless, further studies that focus on mitochondria will need to be done to better define how these demonstrated alterations could influence aerobic respiration, and the function of monocytes.
Whole-genome expression analysis highlighted an aberrant modulation of both TNF receptor signalling. In particular, the pleiotropic TNFRSF1A receptor protein was confirmed upregu-lated in monocytes from IgAN patients. These receptors exert various physiological roles and are important in maintaining the delicate balance between cell survival and apoptosis [32]. The downstream effector of both receptors is NF-kB, which was also demonstrated to have an enhanced nuclear translocation in PBMCs isolated from IgAN patients [10].
Recently, a differential apoptotic propensity using gene expression profiling of human monocyte subsets has been de-monstrated [26, 33,34]. In particular, the authors confirmed an enhanced expression of apoptotic-related transcripts in non-classical monocytes, this apoptotic propensity was also seen in our CD16+ monocytes and this concept led us to hy-pothesize that the apoptosis signature seen in monocytes from IgAN patients could be ascribed to an aberrant expansion of this subset. This theory was confirmed using flow cytometric analysis on monocytes isolated from IgAN patients thus dem-onstrating, for the first time, an abnormal expansion of the non-classical monocyte subset in IgAN. This analysis was per-formed on a pure monocytic population thus naturally exclud-ing in our analysis other CD16+ cells such as natural killer cells, neutrophils and polymorphonuclear leucocytes.
The expansion of non-classical monocytes has been well described in various conditions including bacterial [57] and viral [58] infections and in inflammatory conditions [59], but what causes them to expand and if they are playing a protective or pathogenic role in these diseases are still un-known [33]. Monocyte subsets are distinct developmentally and functionally [35, 60]. Whole-genome transcriptome ana-lysis suggests that monocyte subsets originate from a common F I G U R E 4 :Enhanced apoptotic potential of monocytes isolated
from IgAN patents compared with healthy blood donors (HBDs). Two-dimensional dot plots of Annexin Vfluorescence plotted against 7-AADfluorescence of an IgAN patient (A) and a healthy blood donor (B). Dot plots are representative independent experiments performed on 12 IgAN patients and 12 HBDs. (C) Percentage of double-positive monocytes isolated from IgAN patients (28.4 ± 5.0 ANNEX-V+/AAD+CELLS) and HBDs (15.8 ± 2.1 ANNEX-V+/ AAD+CELLS; P = 0.02). P-values obtained by unpaired t-test.
ORIGINAL
myeloid precursor, with CD16+ monocytes being at a more advanced stage of differentiation and having a more macro-phage and dendritic cell like transcription that makes them capable of participating in T-independent antibody produc-tion by innate B cells [61]. The increase of CD16+monocytes in IgAN could have a fundamental role in IgAN pathogenesis determining an enhanced antibody production and an altered antigen handling that underlies this disease [3].
The migratory properties of monocyte subsets are different based on their chemokine receptor expression, and non-classic-al monocytes show an enhanced CX3CR1 expression [27,28]. These cells also have a patrolling behaviour consenting a con-stant inspection of the endothelium for signs of inflammation or damage transmigrating rapidly thanks to their CX3CR1 re-ceptor [27,62]. Noteworthy is that all monocytes considered in this paper were 100% positive to CX3CR1 (data not shown); furthermore, the aberrancy of CX3CR1-positive cells in IgAN patients is particularly relevant during disease activity [8].
Taken together, ourfindings demonstrate an aberrant modu-lation of the mitochondrial respiratory system in monocytes isolated from IgAN patients and a specific upregulation of TNFRSF1A and NDUFS3 and downregulation of TNF. Fur-thermore, the aberrant expansion of the non-classical monocyte subset (CD14+CD16+) could explain the enhanced apoptotic function seen in these cells thus revealing a potential pathogen-etic role of these cells in IgAN.
S U P P L E M E N TA RY D ATA
Supplementary data are available online at http://ndt.oxford journals.org.
AC K N OW L E D G E M E N T S
We are grateful to the patients and healthy blood donors for their cooperation in this study. This work was supported by grants from MiUR (COFIN-PRIN 2006069815; PONa3_ 00134), from Puglia Region (BISIMANE project 44/2008) and from Ministry of Health (GR-2011-02350438).
CON FL I C T O F I N T E R E S T S TATE M E N T None declared.
R E F E R E N C E S
1. Manno C, Torres DD, Rossini M et al. Randomized controlled clinical trial of corticosteroids plus ACE-inhibitors with long-term follow-up in proteinuric IgA nephropathy. Nephrol Dial Transplant 2009; 24: 3694–3701
F I G U R E 5 :Monocyte subpopulation analysis on IgAN patients. Two-dimensional CD14-FITC plotted against CD16-PEfluorescence of an IgAN patient (A) and a healthy blood donor (B). Dot plots are representative of all evaluated patients and controls. (C) The proportion of non-classical monocytes (CD14+CD16+) in 14 IgAN patients showed a significantly higher percentage (27.7% ± 6.8) compared with 14 HBDs (9.5% ± 1.1, P = 0.008).
ORIGINAL
2. Schena FP, Coppo R. IgA nephropathies. In: Davison AM, Ritz E, Cameron JS, Winearls C (eds). Oxford Textbook of Clinical Nephrology, 3rd edn. UK: Oxford University Press, 2005, pp. 369–502
3. Boyd JK, Cheung CK, Molyneux K et al. An update on the pathogenesis and treatment of IgA nephropathy. Kidney Int 2012; 8: 833–843
4. van der Boog PJ, de Fijter JW, Bruijn JA et al. Recurrence of IgA nephro-pathy after renal transplantation. Ann Med Interne 1999; 150: 137–142 5. Ponticelli C, Traversi L, Feliciani A et al. Kidney transplantation in
patients with IgA mesangial glomerulonephritis. Kidney Int 2001; 60: 1948–1954
6. Canaud G, Audard TV, Kofman P et al. Recurrence from primary and secondary glomerulopathy after renal transplant. Transpl Int 2012; 25: 812–824
7. Cox SN, Sallustio F, Serino G et al. Altered modulation of WNT-beta-catenin and PI3 K/Akt pathways in IgA nephropathy. Kidney Int 2010; 78: 396–407
8. Cox SN, Sallustio F, Serino G et al. Activated innate immunity and the in-volvement of CX3CR1-fractalkine in promoting hematuria in patients with IgA nephropathy. Kidney Int 2012; 82: 548–560
9. Coppo R, Camilla R, Amore A et al. Toll-like receptor 4 expression is in-creased in circulating mononuclear cells of patients with immunoglobulin A nephropathy. Clin Exp Immunol. 2010; 159: 73–81
10. Coppo R, Camilla R, Alfarano A et al. Upregulation of the immunoprotea-some in peripheral blood mononuclear cells of patients with IgA nephro-pathy. Kidney Int 2009; 75: 536–541
11. Coppo R, Amore A, Peruzzi L et al. Innate immunity and IgA nephropa-thy. J Nephrol 2010; 23: 626–632
12. Sharmin S, Shimizu Y, Hagiwara M et al. Staphylococcus aureus antigens induce IgA-type glomerulonephritis in Balb/c mice. J Nephrol 2004; 17: 504–511
13. Amore A, Coppo R, Nedrud JG et al. The role of nasal tolerance in a model of IgA nephropathy induced in mice by Sendai virus. Clin Immunol 2004; 113: 101–108
14. Suzuki S, Nakatomi Y, Sato H et al. Haemophilus parainfluenzae antigen and antibody in renal biopsy samples and serum of patients with IgA ne-phropathy. Lancet 1994; 343: 12–16
15. Koyama A, Sharmin S, Sakurai H et al. Staphylococcus aureus cell enve-lope antigen is a new candidate for the induction of IgA nephropathy. Kidney Int 2004; 66: 121–132
16. Monteiro RC, Moura IC, Launay P et al. Pathogenic significance of IgA receptor interactions in IgA nephropathy. Trends Mol Med 2002; 8: 464–468
17. Launay P, Grossetête B, Arcos-Fajardo M et al. Fca receptor (CD89) med-iates the development of immunoglobulin A (IgA) nephropathy(Berger’s disease): evidence for pathogenic soluble receptor–IgA complexes in pa-tients and CD89 transgenic mice. J Exp Med 2000; 191: 1999–2009 18. Wines BD, Hulett MD, Jamieson GP et al. Identification of residues in the
first domain of human Fca receptor essential for interaction with IgA. J Immunol 1999; 162: 2146–2153
19. Bracke M, Nijhuis E, Lammers JW et al. A critical role for PI3-kinase in cytokine-induced Fcalpha-receptor activation. Blood 2000; 95: 2037–2043
20. Volkman A. The origin and turnover of mononuclear cells in peritoneal exudates in rats. J Exp Med. 1966; 124: 241–254
21. Varol C, Landsman L, Fogg DK et al. Monocytes give rise to mucosal, but not splenic, conventional dendritic cells. J Exp Med 2007; 204: 171–180 22. Whitelaw DM. Observations on human monocyte kinetics after pulse
la-beling. Cell Tissue Kinet 1972; 5: 311–317
23. Ziegler-Heitbrock L, Hofer PJT. Toward a refined definition of monocyte subsets. Front Immunol 2013; 4: e23
24. Ziegler-Heitbrock L, Ancuta P, Crowe S et al. Nomenclature of monocytes and dendritic cells in blood. Blood 2010; 116: e74–e80
25. Karlmark KR, Tacke F, Dunay IR et al. Monocytes in health and disease. Eur J Microbiol Immunol 2012; 2: 97–102
26. Zhao C, Tan YC, Wong WC et al. The CD14(+/low)CD16(+) monocyte subset is more susceptible to spontaneous and oxidant-induced apoptosis than the CD14(+)CD16(-) subset. Cell Death Dis 2010; 1: e95
27. Gautier EL, Jakubzick C, Randolph GJ. Regulation of the migration and survival of monocyte subsets by chemokine receptors and its relevance to atherosclerosis. Arterioscler Thromb Vasc Biol 2009; 29: 1412–1418 28. Geissmann F, Jung S, Littman DR. Blood monocytes consist of two
princi-pal subsets with distinct migratory properties. Immunity 2003; 19: 71–82 29. Manno C, Strippoli GF, D’Altri C et al. A novel simpler histological
classi-fication for renal survival in IgA nephropathy: a retrospective study. Am J Kidney Dis 2007; 49: 763–775
30. Roberts IS, Cook HT, Troyanov S et al. The Oxford classification of IgA nephropathy: pathology definitions, correlations, and reproducibility. Kidney Int 2009; 76: 546–556
31. Cattran DC, Coppo R, Cook HT et al. The Oxford classification of IgA ne-phropathy: rationale, clinicopathological correlations, and classification. Kidney Int 2009; 76: 534–545
32. Naudé PJ, den Boer JA, Luiten PG et al. Tumor necrosis factor receptor cross-talk. FEBS J 2011; 278: 888–898
33. Wong KL, Yeap WH, Tai JJ et al. The three human monocyte subsets: im-plications for health and disease. Immunol Res 2012; 53: 41–57
34. Schmidl C, Renner K, Peter K et al. Transcription and enhancer profiling in human monocyte subsets. FANTOM consortium. Blood 2014; 123: e90–e99
35. Wong KL, Tai JJ, Wong WC et al. Gene expression profiling reveals the de-fining features of the classical, intermediate, and nonclassical human monocyte subsets. Blood 2011; 118: e16–e31
36. Vergano L, Loiacono E, Albera R et al. Can tonsillectomy modify the innate and adaptive immunity pathways involved in IgA nephropathy? J Nephrol 2014; doi:10.1007/s40620-014-0086-8
37. Ashkenazi A, Dixit V. Death receptors: signaling and modulation. Science 1998; 281: 1305–1308
38. Green DR, Reed JC. Mitochondria and apoptosis. Science 1998; 281: 1309–1312 39. Mangan DF, Welch GR, Wahl SM. Lipopolysaccharide, tumor necrosis factor-alpha, and IL-1 beta prevent programmed cell death (apoptosis) in human peripheral blood monocytes. J Immunol 1991; 146: 1541–1546 40. Kremer L, Estaquier J, Brandt E et al. Mycobacterium bovis Bacillus
Calm-ette Guerin infection prevents apoptosis of resting human monocytes. Eur J Immunol 1997; 27: 2450–2456
41. Fahy RJ, Doseff AI, Wewers MD. Spontaneous human monocyte apop-tosis utilizes a caspase-3-dependent pathway that is blocked by endotoxin and is independent of caspase-1. J Immunol 1999; 163: 1755–1762 42. Webster SJ, Daigneault M, Bewley MA et al. Distinct cell death programs
in monocytes regulate innate responses following challenge with common causes of invasive bacterial disease. J Immunol 2010; 185: 2968–2979 43. Laforge M, Campillo-Gimenez L, Monceaux V et al. HIV/SIV infection
primes monocytes and dendritic cells for apoptosis. PLoS Pathog 2011; 7: e1002087
44. Hirabayashi A, Yorioka N, Oda H et al. Involvement of bacterial antigens in immunoglobulin A nephropathy. Hiroshima J Med Sci 1996; 45: 113–117 45. Nagasawa Y, Iio K, Fukuda S et al. Periodontal disease bacteria specific to
tonsil in IgA nephropathy patients predicts the remission by the treat-ment. PLoS One 2014; 9: e81636
46. Wei SS, Sinniah R. Adalimumab (TNFα inhibitor) therapy exacerbates IgA glomerulonephritis acute renal injury and induces lupus autoanti-bodies in a psoriasis patient. Case Rep Nephrol 2013; e812781. doi:10.1155/2013/812781
47. Hirst J, Carroll J, Fearnley IM et al. The nuclear encoded subunits of complex I from bovine heart mitochondria. Biochim. Biophys. Acta 2003; 1604: 135–150
48. Grivennikova VG, Vinogradov AD. Generation of superoxide by the mito-chondrial Complex I. Biochim Biophys Acta. 2006; 1757: 553–561 49. Camello-Almaraz C, Gomez-Pinilla PJ, Pozo MJ et al. Mitochondrial
re-active oxygen species and Ca2+ signaling. Am J Physiol Cell Physiol 2006; 291: C1082–C1088
50. Stadtman ER, Levine RL. Free radical-mediated oxidation of free amino acids and amino acid residues in proteins. Amino Acids 2003; 25: 207–218 51. Camilla R, Suzuki H, Daprà V et al. Oxidative stress and galactose-de fi-cient IgA1 as markers of progression in IgA nephropathy. Clin J Am Soc Nephrol 2011; 6: 1903–1911
ORIGINAL
52. Chen JX, Zhou JF, Shen HC. Oxidative stress and damage induced by ab-normal free radical reactions and IgA nephropathy. Zhejiang Univ Sci B 2005; 6: 61–68
53. Vas T, Wagner Z, Jenei V et al. Oxidative stress and non-enzymatic glyca-tion in IgA nephropathy. Clin Nephrol 2005; 64: 343–351
54. Descamps-Latscha B, Witko-Sarsat V, Nguyen-Khoa T et al. Early predic-tion of IgA nephropathy progression: proteinuria and AOPP are strong prognostic markers. Kidney Int 2004; 66: 1606–1612
55. Donadio JV, Grande JP. IgA nephropathy. N Engl J Med 2002; 347: 738–748
56. Grande JP, Walker HJ, Holub BJ et al. Suppressive effects offish oil on me-sangial cell proliferation in vitro and in vivo. Kidney Int 2000; 57: 1027–1040
57. Castano D, Garcia LF, Rojas M. Increased frequency and cell death of CD16+ monocytes with Mycobacterium tuberculosis infection. Tubercu-losis 2011; 91: 348–360
58. Zhang JY, Zou ZS, Huang A et al. Hyper-activated pro-inflammatory CD16 monocytes correlate with the severity of liver injury andfibrosis in patients with chronic hepatitis B. PLoS One 2011; 6: e17484
59. Heine GH, Ulrich C, Seibert E et al. CD14++CD16+ monocytes but not total monocyte numbers predict cardiovascular events in dialysis patients. Kidney Int 2008; 73: 622–629
60. Ancuta P, Liu KY, Misra V et al. Transcriptional profiling reveals develop-mental relationship and distinct biological functions of CD16+ and CD16- monocyte subsets. BMC Genomics 2009; 10: e403
61. Randolph GJ, Jakubzick C, Qu C. Antigen presentation by monocytes and monocyte-derived cells. Curr Opin Immunol. 2008; 20: 52–60
62. Cros J, Cagnard N, Woollard K et al. Human CD14dimmonocytes patrol
and sense nucleic acids and viruses via TLR7 and TLR8 receptors. Im-munity 2010; 33: 375–386
Received for publication: 6.10.2014; Accepted in revised form: 12.1.2015
ORIGINAL