Abstract
Innovation in the field of protected crops represents an argument of great applied and theoretical research attention due to constantly evolving tech-nologies and automation for higher quality flower and vegetable production and to the corresponding environmental and economic impact. The aim of this paper is to provide an analysis of some thermomechanical properties of rigid polymeric laminates for greenhouses claddings, including innovative tests such as the thermographic ones. Four types of laminates have been analysed: two polycarbonates, a polymethylmethacrylate and a polyethylene terephthalate (PET). The tests gave interesting results on different impor-tant properties, such as radiometric properties, limit stresses, strains and ductility. Moreover, a direct comparison of infrared images and force elon-gation curves gave important information on the relation of the (localised or homogeneous) damage evolution, with both an applicative and theoreti-cal implication. Finally, even if to the authors knowledge at present there are no examples of using PET for covering greenhouses, the results of this paper indicates the thermomechanical and radiometric characteristics of this material make it interesting for agricultural applications.
Introduction
Recent process of technological and production innovation that strongly affected the agrifood sector also involved the greenhouse branch in different directions: maximum transmittance of solar radia-tion, reduced heat loss, high structural strength, good durability of materials, low energy consumption, efficient ventilation, control of inside microclimate parameters and reduced costs of implementation and management (Scarascia, 2003; Giacomelli et al., 2012). In the con-text of the roofing systems of greenhouses, starting from the develop-ment and large application of plastic covers, in the 60s and 70s, differ-ent researchers begun analysing in more detail the radiative proper-ties that influence the climate of the greenhouses and plant growth (Kittas and Baille, 1998). Since then, many other photometric studies on roofing materials have been proposed (Schettini et al., 2011; Al-Mahdouri et al., 2013). Specific attention has been devoted to durabil-ity analysis with substantial benefits in terms of environmental impact (Briassoulis and Schettini, 2002, 2003; Vox et al., 2005; Stefani et al., 2008; Russo and Verdiani, 2013; Sartore et al., 2013; Vox and Schettini, 2013; Schettini et al., 2014; Sica et al., 2015). This paper intends to pro-vide a non-standard study of the fundamental thermomechanical behaviour of diffusely adopted rigid plastic laminates aimed at the pro-duction of efficient protected crops cover. To this scope, three types of polymers have been considered: polymethylmethacrylate (PMMA), polycarbonate (PC) and polyethylene terephthalate (PET).
The PMMA is a thermoplastic material, essentially amorphous, used in agriculture covering of greenhouses (Briassoulis et al., 1997), often adopted in corrugated or honeycomb sheets. Moreover to enhance the thermal performance Northern Europe countries adopted double-walled acrylic laminates. Important examples are garden centres and extensive conversion of glasshouses to acrylic houses in Norway (Papadopulos and Hao et al., 1997).
PC is a lightweight polymer that is typically extruded in the form of honeycomb sheets in double, triple or quadruple walls to improve the thermal efficiency. Recently to reduce the degradation, sheets protect-ed against UV radiation have been producprotect-ed. For this reason coextrud-ed PC sheets have been realiscoextrud-ed with an acrylic protective resin on the exposed face of the PC plate. The PET is a linear chain thermoplastic polymer belonging to the family of saturated polyesters. This polymer is used in production of sheets containing glycol (PET-G) as thermo-plastic copolyester. Among the applications of PET-G we recall the use of transparent large surfaces in architecture, the guards of food machinery in mechanical sector, the equipment for food packaging rel-ative to the argri-food branch, and the application in medical equip-ment like blister for medicines or packaging of medical devices. To the knowledge of the authors, at present this material is not adopted in covering greenhouses, but the experimental analyses on this material proposed in this paper have the aim to assess whether the mechanical and radiometric characteristics of this material would be suitable for Correspondence: Silvana Fuina, Department of Agricultural and
Environmental Science, University of Bari Aldo Moro, via Amendola 165/A, 70126 Bari, Italy.
Tel./Fax: +39.080.5442977. E-mail: [email protected]
Key words: Covering materials; greenhouses; polymeric materials; radiomet-ric analysis; thermomechanical analysis.
Acknowledgements: the authors are grateful to Grittani D, Vendola P and Sfregola D for their cooperation during the experimental tests and to the company Telform New Generation s.r.l., Bari (Italy), for supplying plastic sheets used for experimental tests.
Contributions: the experimental tests, the data processing and the editorial work must be shared equivalently among the Authors within the areas of their expertise.
Received for publication: 12 February 2016. Accepted for publication: 1 May 2016. ©Copyright S. Fuina et al., 2016 Licensee PAGEPress, Italy
Journal of Agricultural Engineering 2016; XLVII:549 doi:10.4081/jae.2016.549
This article is distributed under the terms of the Creative Commons Attribution Noncommercial License (by-nc 4.0) which permits any noncom-mercial use, distribution, and reproduction in any medium, provided the orig-inal author(s) and source are credited.
Thermo-mechanical response of rigid plastic laminates
for greenhouse covering
Silvana Fuina,
1Giuseppe C. Marano,
2,3Giuseppe Puglisi,
2Domenico De Tommasi,
2Giacomo Scarascia-Mugnozza
11
Department of Agricultural and Environmental Science, University of Bari Aldo Moro, Bari, Italy;
2
Department of Architectural and Civil Engineering Science, Technical University of Bari, Italy;
3
SIBERC, Fuzhou Unversity, Qi Shan Campus, Fuzhou, Fujian, China
Non
commercial
agricultural applications.
The present work considers in addition to the well-known aspects of radiometric and mechanical strength, other fundamental phenomena, such as damage, strain localisation, maximum stretch that may play a crucial role for the technological applications of these materials in covering structures.
Materials and methods
Materials and devices
Specimens of blue solar control PC (thickness 4 mm), clear PC (thickness 4 mm), transparent PMMA (thickness 4 mm) and PET (thickness 5 mm) were tested.
Thermomechanical behaviour has been studied by performing experimental analysis including non-conventional method such as thermography (Samaca Martinez et al., 2013).
More precisely, mechanical tensile tests were performed following the prescriptions of the UNI EN 7391-2:2006 and UNI EN ISO 8257-2:2001 (ISO, 2001, 2006). Samples were realised according to ISO 3167:2014 Type A (Figure 1) (ISO, 2014). The tensile strength tests were carried out in the testing laboratory of the Department of Agricultural and Environmental Sciences, University of Bari by a uni-versal testing machine Galdabini Sun 10 [Galdabini, Cardano al Campo (VA), Italy] (Figure 2). A test speed of 1 mm per minute was adopted and 10 samples for each type of material were tested. Moreover, on one specimen for each type of material it was recorded a sequence of thermographic images at 10 seconds time intervals dur-ing the tensile test by usdur-ing a thermo infrared camera (FLIR SC640, resolution 640×480 pixels, interval wavelength 7.5-13.5mm). The materials described above were also analysed in the spectrophotome-try laboratory of the Department of Agricultural and Environmental Sciences, University of Bari, and the radiometric analysis provided the coefficients of emissivity of each material, that are needed to set the infrared camera and detect the surfaces temperatures.
Thermoelasticity and thermoplasticity
Tested materials show a change of temperature during the elastic and plastic phase. This phenomenon has been the subject of study and research giving rise to expressions (De Tommasi et al., 2008) about the thermoelastic and thermoplastic behaviour of materials based on a Griffith-like approach for dissipation effects observed in these mate-rials. Now, based on this model, we attempt to give a qualitative inter-pretation of the different behaviours exhibited by the polymers here analysed. Of course the temperature variation appearing in the ther-mographic images during the loading process reveals a heat produc-tion in the specimen related to the (material damage) dissipaproduc-tion phe-nomenon, transforming mechanical energy in thermal energy, in par-ticular, as shown in Samanca Martinez et al., 2013. Starting from the Eq. (1) of heat diffusion, based on Fourier’s law, a quantitative approach to this phenomenon permits to measure the heat sources, by considering a two-dimensional Fourier Eq. (2) for the heat transfer into the specimen and a convective model for the heat transfer between air and specimen. For the heat source s field we thus have:
(1)
(2)
where:
q is the temperature; r the mass;
D the thermal diffusivity coefficient; C the specific heat constant of the material; r is the external heat source;
τ represents a time-length scale characterising the heat exchange by convection with the air;
D is the two-dimensional Laplace operator; and (.) denotes derivation with respect time.
Results and discussion
Data obtained from tensile tests, radiometric tests and thermograph-ic analysis were statistthermograph-ically analysed by computing the mean, the stan-dard deviation and the coefficient of variation on ten tests. Depending on the type of material, these tests provided the results reported in the following section.
Spectrum radiometric characterisation
The crop production mainly depends on the effectiveness of its pho-tosynthetic activity, which permits the transformation of light energy into chemical energy. The fraction of solar energy absorbed by the plant is used in part for synthesising organic matter, while another part goes to raise the temperature of the organs and to allow breathability. The conversion of light energy into chemical energy by the photosynthetic apparatus takes place only for radiation having a wavelength between
Figure 1. Type A specimen of ISO 3167 (ISO, 2014). l3 = 170
mm; l1= 80±2 mm; r = 25 mm; l2= 110 mm; b2=20±2 mm; b1 =
10±2 mm.
Figure 2. Universal testing machine Galdabini Sun 10 [Galdabini, Cardano al Campo (VA), Italy].
Non
commercial
400 and 700 nm [photosynthetically active radiation (PAR)]. Roofing systems should contain, in general, a high percentage (≥80%) of trans-mission in the range of wavelengths of visible light, including approx-imately from 380 to 760 nm. All materials have a transmission in the PAR greater than 80% except the blue solar control PC which has a transmission of about 50% and could be used for example in crop pro-ductions that require a lower input of solar radiation (Table 1).
Mechanical characterisation
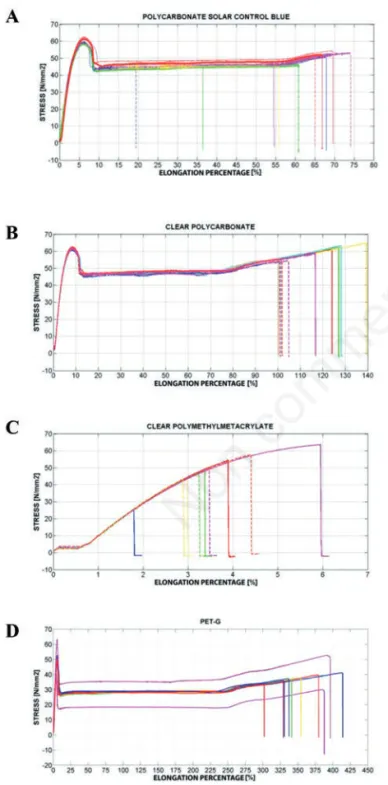
The results of the mechanical tests (Figure 3) showed the depend-ence of the nominal (Piola) stress, defined as the force over the initial transverse area, versus the (longitudinal) average strain (e =DL/L, i.e.,
the difference between the final length and the initial one, divided by the initial length). Some significant results obtained from the tensile tests (failure strain, maximum stress, true (Cauchy) stress at the failure, plateau stress) were reported in Tables 2-5. In particular, the true (Cauchy) stress was obtained as the ratio between the axial load and the actual cross section (evaluated under the hypothesis if incompress-ible uniaxial extension); the plateau stress was defined as the value of the nominal stress corresponding to the horizontal branch of the stress-strain curve. These parameters were statistically analysed calcu-lating the mean value, the standard deviation and the coefficient of variation on the ten tests. For each type of material are observed small values of the coefficient of variation for the maximum stress and the plateau stress, whereas the value of the coefficient of variation is high-er for the failure strain (this is not surprising because it depends on the defect dependent section of the first deformation and damage local-isation). In particular, the blue (solar control) PC exhibits a failure strain average value larger than e = 0.50. Most of the specimens after e = 0.50 show a hardening behaviour anticipating rupture. The clear PC has a plateau phase larger than the blue solar control PC, with an (average) failure strain e = 1.13. All the specimens at e = 0.8 strain begin a phase of hardening up to failure. The clear PMMA does not exhibit a plastic phase and reaches the break at an average maximum stress of 50 N/mm2and a strain with value e = 0.035. Finally, the
PET-G has the larger plateau phase with a failure strain of about e = 3.75. Almost all of the samples begin a phase of hardening up to failure at a value 2.50 of the strain. In Figure 4 it is shown that the maximum stress reached during the test is of the same order of magnitude for all materials, whereas the failure strain is strongly different in the various materials: approximately 3.5% for PMMA, 57% for blue solar control PC, 115% for clear PC, and about 350% for PET-G.
The interesting observed hardening phenomenon anticipating frac-ture can be interpreted as a three-dimensional effect (De Tommasi et al., 2010). An augmented one-dimensional model including such type of effects for the localisation observed in the quasi-plastic hysteresis of shape memory alloys was proposed in Puglisi (2006). Indeed the observed deformation localisation phenomenon can be described by
Figure 3. Tensile tests on: A) the blue solar control polycarbonate; B) the clear polycarbonate; C) the clear polymethylmetacrylate;
D) the polyethylene terephthalate containing glycol (PET-G). Figure 4. Comparison of the maximum stress and elongation per-centage at break of the different materials analysed.
Non
commercial
considering non-convex energy densities, the energy of a two-phase (damaged/undamaged) material and the interaction with the loading device. This has been introduced in Puglisi (2006) by considering non-local interaction energy terms in nonlinear pseudoelasticity. As a result the stress peak, the presence of one or possibly two transition fronts
(e.g., the second front observed in the thermographic image at fracture in Figure 5A), the central or lateral nucleation of these fronts, are described in a one dimensional setting with non local energy interac-tions. The theoretical description of all these effects are out of the aims of this paper and will be the subject of a forthcoming paper.
Table 1. Radiometric data of the different materials.
PAR Solar IR UVA FIRl [7500 nm - 12,500 nm]
τ τ τ τ r α=e
PMMA 92.4% 85.9% 19.7% 0 0.05 0.95 PET-G 86.9% 83.4% 6.4% 0 0.1 0.9 Clear PC 86.0% 84.5% 0.1% 0 0.08 0.92 PC blue solar control 46.5% 44.2% 0% 0 0.08 0.92
PAR, photosynthetically active radiation; IR, infrared; UVA, ultraviolet A; FIR, far infrared radiarion; PMMA, polymethylmethacrylate; PET-G, polyethylene terephthalate containing glycol; PC, polycarbonate.
Table 2. Results of the tensile tests on the blue solar control polycarbonate.
1 2 3 4 5 6 7 8 9 10 Mean Standard Coefficient of deviation variation m s r
Failure strain (%) 36.5 67.9 54.5 69.6 60.8 19.4 55.8 74.1 64.9 66.8 57.03 16.95 0.30 Maximum stress (N/mm2) 59.9 59.2 61.0 62.5 58.4 60.2 59.2 59.7 62.1 61.3 60.35 1.34 0.02
Treu (Cauchy) stress at failure (N/mm2) 62.5 86.4 77.8 93.2 75.3 59.4 70.1 89.7 89.8 89.4 79.36 12.23 0.15
Plateau stress (N/mm2) 45.13 45.74 51.88 46.96 48.89 44.33 43.89 44.88 46.3 49.96 46.80 2.64 0.06
Table 3. Results of the tensile tests on the clear polycarbonate.
1 2 3 4 5 6 7 8 9 10 Mean Standard Coefficient of deviation variation m s r
Failure strain (%) 127.0 128.19 124.06 100.24 101.01 139.51 116.69 104.8 109.34 101.8 115.26 13.85 0.12 Maximum stress (N/mm2) 62.47 63.42 62.65 61.78 60.99 64.71 62.24 61.82 61.91 62.14 62.41 1.03 0.02
Treu (Cauchy) stress at failure (N/mm2) 82.54 109.29 111.18 93.11 90.96 121.79 104.20 88.50 99.06 94.66 99.53 12.01 0.12
Plateau stress (N/mm2) 49.97 50.31 50.64 48.72 47.04 47.00 49.55 47.56 48.54 48.33 48.77 1.32 0.03
Table 4. Results of the tensile tests on the clear polymethylmetacrylate.
1 2 3 4 5 6 7 8 9 10 Mean Standard Coefficient of deviation variation m s r
Failure strain (%) 3.37 1.79 2.99 5.95 3.89 3.24 2.88 3.47 4.4 3.24 3.52 1.09 0.31 Maximum stress (N/mm2) 48.47 25.69 44.09 63.79 54.63 47.04 43.36 49.79 57.76 47.04 48.17 10.15 0.21
Treu (Cauchy) stress at failure (N/mm2) 48.37 25.43 32.71 63.98 53.64 46.57 42.71 49.79 57.18 46.57 46.70 11.22 0.24
Plateau stress (N/mm2)
-Table 5. Results of the tensile tests on the polyethylene terephthalate containing glycol.
1 2 3 4 5 6 7 8 9 10 Mean Standard Coefficient of deviation variation m s r
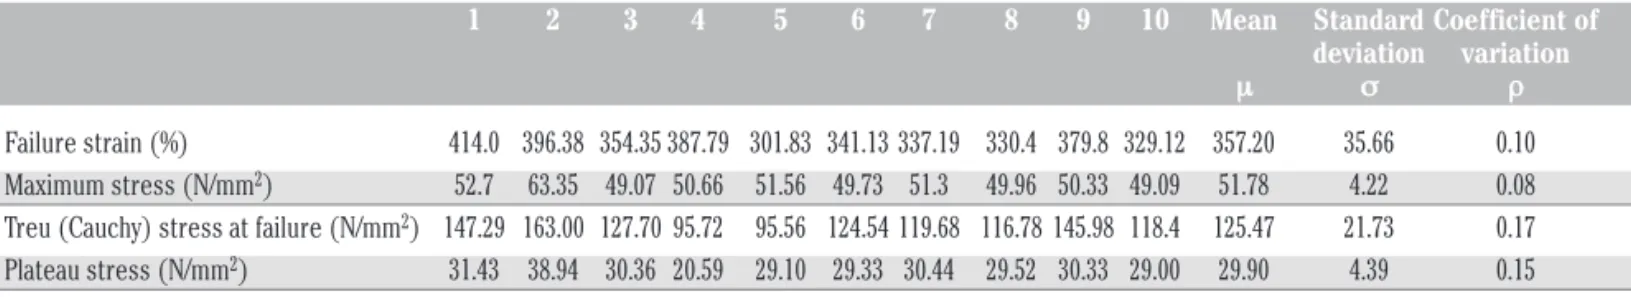
Failure strain (%) 414.0 396.38 354.35 387.79 301.83 341.13 337.19 330.4 379.8 329.12 357.20 35.66 0.10 Maximum stress (N/mm2) 52.7 63.35 49.07 50.66 51.56 49.73 51.3 49.96 50.33 49.09 51.78 4.22 0.08
Treu (Cauchy) stress at failure (N/mm2) 147.29 163.00 127.70 95.72 95.56 124.54 119.68 116.78 145.98 118.4 125.47 21.73 0.17
Plateau stress (N/mm2) 31.43 38.94 30.36 20.59 29.10 29.33 30.44 29.52 30.33 29.00 29.90 4.39 0.15
Non
commercial
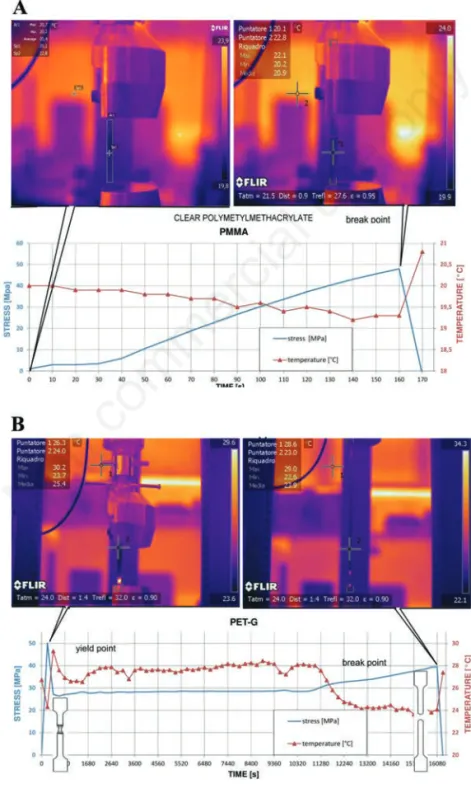
Figure 5. Stress-time graph of the tensile test and thermographic images at the yield and at the break of the specimen, of polymethyl-methacrylate (PMMA) (A) and polyethylene terephthalate containing glycol (PET-G) (B).
Thermographic characterisation
During the tensile tests thermographic images of the specimens were recorded. In this case one sample for each kind of tested material was analysed. Thermography is part of the methods of non-destructive testing of materials (remote sensing realised through the acquisition of images in the infrared field). More precisely, this technique allows to measure the infrared energy emitted by objects and relate it to the surface temperature of the body, based on emissivity (Table 1). In Figures 5 and 6 we show the stress evolution for all materials and ther-mographic images at the stress peak and at the break threshold. Observe that PMMA shows a singular material behaviour because it does not exhibit localisation before rupture. Moreover Figures 5 and 6 show the comparisons between the stress and the (maximum)
temper-ature during the test time for each material. All tested materials, except PMMA, shows a peak of the temperature in correspondence of the local-isation of the deformation. Also note that for all the materials, before the breaking threshold is reached exhibit a sudden localised tempera-ture increase, corresponding to large temperatempera-ture gradients interpret-ed here as damage inducinterpret-ed heat dissipation. Finally, when failure occurred there is second of the temperature gradient.
Interestingly, the experimental thermomechanical behaviour of PMMA is different from the three other materials (Figures 3C and 5A). Indeed this material exhibits a uniform temperature change field revealing a uniform damage and a monotone stress-strain curve without a horizontal plateau up to failure. These two possible damage behav-iours have been theoretically predicted in the microstructure inspired
Non
commercial
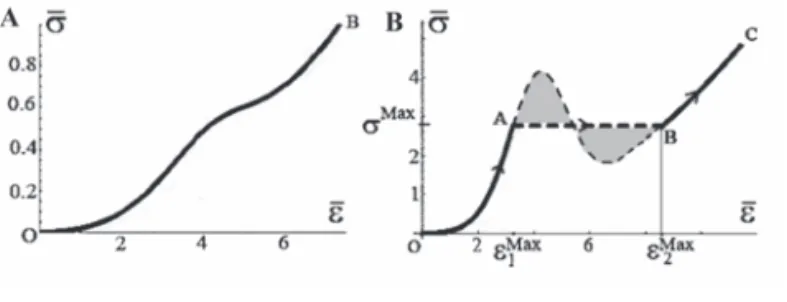
damage model (De Tommasi et al., 2008) that obtain a homogeneous versus inhomogeneous damage behaviour according to the microstruc-ture properties of the rubberlike material. Within the theoretical approach above recalled, the homogeneous damage behaviour of PMMA up to failure corresponds to a material with a diffuse damage charac-terised by a (still damage dependent) convex-type energy for which the energetic minima are not two-phase solutions (Figure 7A, from Figure 3A by De Tommasi et al., 2008). Instead we observe that a sudden increase of temperature in a small region of the specimen reveals a localised damage (Figures 5B and 6). Interestingly, as shown in (De Tommasi et al., 2008), this phenomenon is associated to a stress-strain curve with a stress plateau. Indeed, in the experimental analysis here described we observe that the damage localisation appears at the value
of the stress corresponding to the plateau when a new phase (with high-er strain and damage) nucleates in the specimen. A theoretical inthigh-er- inter-pretation of this behaviour can be obtained by considering equilibrium solutions which are global minima of the total (fracture plus elastic) energy of the polymeric network dealing to a (damage-dependent) non-convex internal energy function (or equivalently for a material behav-iour with a non-monotone stress-strain curve). Following the classical Maxwell approach, in a Griffith-like spirit of total energy minimisation, when the stress corresponds to the plateau value the global minimum of the energy is attained by mixing two phases: the first one characterised by low strain and the other one by higher strain and damage as show the experiments here performed on PC, PMMA and PET (Figure 7B, from Figure 3B by De Tommasi et al., 2008).
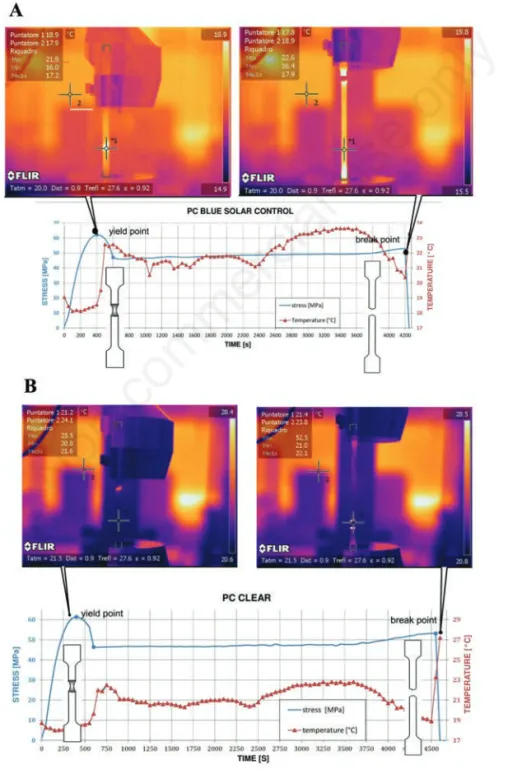
Figure 6. Stress-time graph of the tensile test and thermographic images at the yield and at the break of the specimen, of the blue solar control polycarbonate (PC) (A) and clear PC (B).
Non
commercial
Conclusions
Greenhouse structures must withstand the different climatic condi-tions ensuring energy efficiency features and technological character-istics depending on productions. Therefore new structure and cover technologies that are efficient and durable represent a fundamental task for applied research. This work has focused attention on the rigid plastic laminates used in the greenhouses such as PC, PMMA and PET-G. Radiometric characteristics, mechanical and thermomechanical properties were analysed. From the radiometric point of view the four different materials considered in this work showed different parame-ters suitable to crop production, depending on the needs of the plants. Focusing on the mechanical characteristics we conclude that the PMMA is the less ductile material. The PET-G, while reaching maxi-mum stresses of the same order of magnitude of the other materials, exhibits a breaking elongation much higher than the other materials. This has important effects on both seismic resistance and definition of safety parameters.
Finally thermographic analysis showed the actual correlation between the location of the damage and the registration of a peak in the temperature of the specimen for all materials except the PMMA, which arrives at break with a homogeneous material damage. A theo-retical interpretation has been delivered. Further study on this kind of polymers will be performed in the next future in order to validate the results here presented and to give a more detailed theoretical interpre-tation of the thermo-mechanical behaviour of these materials.
References
Al-Mahdouri A., Baneshi M., Gonome H., Okajima J., Maruyama S. 2013. Evaluation of optical properties and thermal performances of different greenhouse covering materials. Sol. Energy 96:21-32.
Briassoulis D., Schettini E. 2002. Measuring strains of LDPE films: the strain gauge problems. Polym. Test. 21:507-12.
Briassoulis D., Schettini E. 2003. Analysis and design of low-density poly-ethylene greenhouse films. Biosys. Eng. 84:303-14.
Briassoulis D., Waaijenberg D., Gratraud J., Von Eslner B. 1997. Mechanical properties of covering materials for greenhouses: Part 1, general overview. J. Agr. Eng. Res. 67:81-96.
De Tommasi D., Marzano S., Puglisi G., Saccomandi G. 2010. Localization and stability in damageable amorphous solids. Continuum Mech. Therm. 22:47-62.
De Tommasi D., Puglisi G., Saccomandi G. 2008. Localized versus diffuse damage in amorphous materials. Phys. Rev. Lett. 100:085502. Giacomelli G.A., Sase S., Cramer R., Hoogeboom J., MacKenzie A., Parbst K.,
Scarascia-Mugnozza G., Selina P., Sharp D.A., Voogt J.O., Van Weel P.A., Mears D. 2012. Greenhouse production systems for people. Acta Hortic. 927:23-38.
ISO (International Standard Organisation). 2001. ISO 8257-2:2001. Plastics - Poly(methyl methacrylate) (PMMA) moulding and extrusion materi-als - Part 2: Preparation of test specimens and determination of prop-erties. Available from: http://www.iso.org/iso/home /store/catalogue_tc/ catalogue_detail.htm?csnumber=26816
ISO (International Standard Organisation). 2006. ISO 7391-2:2006. Plastics - Polycarbonate (PC) moulding and extrusion materials - Part 2: Preparation of test specimens and determination of properties. Available from: http://www.iso.org/iso/home/store/ catalogue_tc/cata-logue_detail.htm?csnumber=36276
ISO (International Standard Organisation). 2014. ISO 3167:2014. Plastics -Multipurpose test specimens. Available from: http://www.iso.org/iso/cat-alogue_detail.htm?csnumber=65105
Kittas C., Baille A. 1998. Determination of the spectral properties of several greenhouse cover materials and evaluation of specific parameters related to plant response. J. Agr. Eng. Res. 71:193-202.
Papadopoulos A.P., Hao X. 1997. Effects of three greenhouse cover materials on tomato growth, productivity, and energy use. Sci. Hortic. 70:165-78. Puglisi G. 2006. Hysteresis in multi-stable lattices with non-local
interac-tions. J. Mech. Phys. Solids 54:2060-88.
Russo G., Verdiani G. 2013. Production and reuse of waste in rural area with high density of greenhouse. J. Agr. Eng. 44:240-6.
Samaca Martinez J.R., Le Cam J.B., Balandraud X., Toussaint E., Caillard J. 2013. Mechanisms of deformation in crystallizable natural rubber. Part 2: Quantitative calorimetric analysis. Polymer 54:2727-36.
Sartore L., Vox G., Schettini E. 2013. Preparation and performance of novel biodegradable polymeric materials based on hydrolyzed proteins for agricultural application. J. Polym. Environ. 21:718-25.
Scarascia-Mugnozza G. 2003. Strutture e tipologie nuove negli impianti ser-ricoli. Colture Protette 6:89-104.
Schettini E., De Salvador F.R., Scarascia-Mugnozza G., Vox G. 2011. Radiometric properties of photoselective and photoluminescent green-house plastic films and their effects on peach and cherry tree growth. J. Hort. Sci. Biotech. 86:79-83.
Schettini E., Stefani L., Vox G. 2014. Interaction between agrochemical con-taminants and UV stabilizers for greenhouse EVA plastic films. Appl. Eng. Agric. 30:229-39.
Sica C., Loisi R. V., Blanco I., Schettini E., Scarascia Mugnozza G., Vox G. 2015. Swot analysis and land management of plastic wastes in agricul-ture. pp 745-54 in Proc. 43rdInternational Symposium on Agricultural
Engineering: Actual Tasks on Agricultural Engineering, 24th-27th
February, Opatija, Croatia.
Stefani L., Zanon M., Modesti M., Ugel E., Vox G., Schettini E. 2008. Reduction of the environmental impact of plastic films for greenhouse covering by using fluoropolymeric materials. Acta Hortic. 801:131-7. Vox G., Schettini E. 2013. Effects of agrochemicals, ultra violet stabilisers
and solar radiation on the radiometric properties of greenhouse films. J. Agr. Eng. 44:e11.
Vox G., Schettini E., Scarascia-Mugnozza G. 2005. Radiometric properties of biodegradable films for horticultural protected cultivation. Acta Hortic. 691:575-82.
Figure 7. A) Homogeneous damage up to failure; B) localised deformation and damage (modified from Figure 3A-B by De Tommasi et al., 2008).
![Figure 2. Universal testing machine Galdabini Sun 10 [Galdabini, Cardano al Campo (VA), Italy].](https://thumb-eu.123doks.com/thumbv2/123dokorg/5438110.60451/2.982.493.889.880.1130/figure-universal-testing-machine-galdabini-galdabini-cardano-campo.webp)