The Light Wavelength Affects the Ontogeny
of Clock Gene Expression and Activity
Rhythms in Zebrafish Larvae
Viviana Di Rosa1, Elena Frigato2, José F. López-Olmeda1, Francisco J.
Sánchez-Vázquez1*, Cristiano Bertolucci2
1 Department of Physiology, Faculty of Biology, Regional Campus of International Excellence“Campus Mare Nostrum”, University of Murcia, Murcia Spain, 2 Department of Life Sciences and Biotechnology, University of Ferrara, Ferrara, Italy
Abstract
Light plays a key role in synchronizing rhythms and setting the phase of early development. However, to date, little is known about the impact of light wavelengths during the ontogeny of the molecular clock and the behavioural rhythmicity. The aim of this research was to determine the effect of light of different wavelengths (white, blue and red) on the onset of locomotor activity and clock gene (per1b, per2, clock1, bmal1 and dbp) expression
rhythms. For this purpose, 4 groups of zebrafish embryo/larvae were raised from 0 to 7 days post-fertilization (dpf) under the following lighting conditions: three groups maintained under light:dark (LD) cycles with white (full visible spectrum, LDW), blue (LDB), or red light (LDR), and one group raised under constant darkness (DD). The results showed that lighting condi-tions influenced activity rhythms. Larvae were arrhythmic under DD, while under LD cycles they developed wavelength-dependent daily activity rhythms which appeared earlier under LDB (4 dpf) than under LDW or LDR (5 dpf). The results also revealed that development and lighting conditions influenced clock gene expression. While clock1 rhythmic expression appeared in all lighting conditions at 7 dpf, per1b, per2 and dbp showed daily variations already at 3 dpf. Curiously, bmal1 showed consistent rhythmic expression from embryonic stage (0 dpf). Summarizing, the data revealed that daily rhythms appeared earlier in the lar-vae reared under LDB than in those reared under LDW and LDR. These results emphasize the importance of lighting conditions and wavelengths during early development for the ontogeny of daily rhythms of gene expression and how these rhythms are reflected on the behavioural rhythmicity of zebrafish larvae.
Introduction
Circadian rhythms are regulated by an endogenous system of circadian oscillators that act in harmony with the environmental cycles. They represent an adaptive advantage that allows organisms to predict and anticipate cyclic environmental changes [1,2]. Light and temperature
OPEN ACCESS
Citation: Di Rosa V, Frigato E, López-Olmeda JF, Sánchez-Vázquez FJ, Bertolucci C (2015) The Light Wavelength Affects the Ontogeny of Clock Gene Expression and Activity Rhythms in Zebrafish Larvae. PLoS ONE 10(7): e0132235. doi:10.1371/journal. pone.0132235
Editor: Nicholas S Foulkes, Karlsruhe Institute of Technology, GERMANY
Received: November 10, 2014 Accepted: June 12, 2015 Published: July 6, 2015
Copyright: © 2015 Di Rosa et al. This is an open access article distributed under the terms of the Creative Commons Attribution License, which permits unrestricted use, distribution, and reproduction in any medium, provided the original author and source are credited.
Data Availability Statement: All relevant data are within the paper.
Funding: This research was partially financed by the Spanish MINECO through the following projects (AGL2010-22139-C03-01 -“Cronosolea”, and AGL2013-49027-C3-1-R -“Solembryo”) cofunded with FEDER fund. JFLO was funded through a research fellowship granted by MINECO (Juan de la Cierva Program). EF and CB were supported by funding from the University of Ferrara (Italy). The funders had no role in study design, data collection
are the predominant signals for the entrainment of circadian oscillators [1]. Light acts through changes in intensity (day/night variations) and photoperiod (seasonal variations), while tem-perature influences biological rhythms through natural oscillations of the thermo-cycle (both daily and seasonal) [3]. In the aquatic environment, light has an additional feature since the spectral composition of incident light changes with depth: longer wavelengths (reddish) are absorbed rapidly, while shorter wavelengths (bluish) become predominant [4,5]. Thus, in fish, photic sensitivity depends on adaptation of their photoreceptor system (lateral eyes, pineal gland, deep brain and dermal photoreceptors) to the different properties of the light in the water column, which change depending on factors such as chemical composition, organic sub-stances and depth [5,6]. Zebrafish is a small cyprinid teleost fish, native of the Ganges River in eastern India, traditionally considered a diurnal species in both its adult and larval stages [7–9]. It has become a common model species used to investigate the vertebrate circadian clock, embryology and developmental biology [10–12], and it is an ideal candidate model for studying the effect of light on the development and early emergence of light-responsive structures [13–16].
Several studies have investigated the effect of light on the locomotor activity of zebrafish adults and larvae, focusing on light cycles and daylengths [7,8,16–19]. Depending on water temperature, zebrafish larvae hatch at 2–3 day post-fertilization (dpf) and remain generally inactive prior to inflation of the swim bladder and the start of feeding (4–5 dpf). Adult and lar-vae zebrafish are mostly active (>65%) during the light phase and circadian rhythmicity per-sists in constant darkness [7,8,16]. Interestingly, previous investigation pointed out the importance of light during early development because only 20% of larvae reared under con-stant darkness showed circadian rhythmicity, further stressing the importance of entraining signals (i.e. light) to initiate circadian rhythmicity, which is regulated by a pacemaker sensitive from 2 dpf [17]. Furthermore, a recent paper on light composition also showed that different light spectra have different effects on growth performance in zebrafish [20]. Similar investiga-tions in marine fish, such as sole (Solea senegalensis) and sea bass (Dicentrarchus labrax) con-firmed the importance of light characteristics for embryo development, hatching rhythms and larval growth [21,22].
The circadian clock mechanism that regulates the rhythmicity in vertebrates consists of interacting positive and negative transcriptional/translational feedback loops. Positive elements such as CLOCK and BMAL bind to E-box elements located in the regulatory regions of nega-tive elements (pers and crys). CRY and PER proteins down-regulate their own expression by inhibiting CLOCK-BMAL [23], allowing the feedback loop to exist. The transduction of circa-dian information is achieved by rhythmic activation of clock-controlled output genes that regu-late downstream processes [24]. For instance, DBP is a D-box binding protein whose rhythmic expression is driven by CLOCK-BMAL through an E-Box-mediated activation [25,26]. These transcription factors controlled by the clock confer circadian expression on downstream genes, modulating various physiological processes [27]. In zebrafish, the existence of multiple forms of the key clock genes cry, per, clock and bmal has been reported [28,29]. Per1 is a clock-con-trolled gene that is present with two homologues (per1a and per1b), whereas per2 is a light-driven gene necessary for the ontogeny of the clock [30].
Different investigations have described the role of LD cycles on the expression of different light-responsive genes involved in the molecular clock [31–36]. Dekens and Whitmore (2008) observed the light-independent initiation of zygotic per1 transcription in the first day of devel-opment, whose oscillations were asynchronous [15]. Moreover, during the first 3 days of devel-opment, clock and bmal1 were not rhythmic, and the onset of their rhythmic expression coincided with the appearance of several circadian clock output processes, such as locomotor
and analysis, decision to publish, or preparation of the manuscript.
Competing Interests: The authors have declared that no competing interests exist.
activity and DNA replication [15,16,37]. However, to date, the effects of different light wave-lengths on the ontogeny of molecular clock genes remain unknown.
The objectives of the present research were to investigate the influence of 12:12 light-dark (LD) cycles with a different light spectrum (white, LDW; blue, LDB; red, LDR) on the ontogeny of clock gene and behavioural rhythms in zebrafish. For this purpose, we first looked at the locomotor activity, a well-known circadian behavioural output, on larvae reared under differ-ent light conditions during the first 7 days of life, in order to ascertain whether rhythmic pat-terns depend on photic conditions. Next, we focused on a subset of core-clock (per1b, clock1, bmal1), regulated (per2), and clock-output (dbp) genes to study how changes in the light-ing conditions might alter the onset of daily and circadian gene expression.
Materials and Methods
Ethics Statement
The present research was carried out in the Chronobiology laboratories of the University of Murcia (Spain) and of the University of Ferrara (Italy). All husbandry and experimental proce-dures complied with European Legislation for the Protection of Animals used for Scientific Purposes (Directive 2010/63/EU). The experimental protocol was previously authorized by the Spanish National Committee on Animal Welfare (Law 32/2007) and the Bioethical Committee of the University of Murcia (Spain) and by the University of Ferrara Institutional Animal Care and Use Committee and the Italian Ministry of Health.
Animal rearing
Wild-type adult fish were obtained from commercial provider (Alimar Pets S.L., Murcia, Spain) and housed for 1 year in 9 L glass aquaria (1 fish l-1) according to standard method [38]. The reproductive fishes were fed 2 and 6 hours after lights on with dry food (Tropical fish flakes; PRODAC, Italy). For spontaneous spawning, the sexually mature fish were separated in groups of 5 fish (3 females and 2 males) and transferred into a 2.5 L breeding net cage during the afternoon. Spawning took place the next morning, approximately 2 hours after lights on. Eggs were collected, pooled and distributed into 85×10 mm plastic Petri dishes with cover (20 eggs per Petri dish) filled with embryo medium [38]. The Petri dishes were placed to float in a 12 liters aquarium at 27°C.
Experimental procedure
The experimental groups were exposed to four different lighting conditions: LDW (white), LDB (blue), LDR (red) and DD (constant darkness). The light-dark (LD) cycle was of 12 hours light and 12 hours darkness. Illumination was provided by means of neutral red, blue, and white LED light lamps (Superlight Technology Co. Ltd., China). Irradiance was measured with a spectro-radiometer (FieldSpec ASD, Colorado, USA) set at 1.62 E+18 photons m-2s-1. The λmaxof the red and blue LED light lamps were 639 nm and 465 nm, respectively. The tempera-ture was held constant (27°C) by means of water heaters (50 W, Sera GmbH, Germany) and recorded every 10 minutes with data loggers (Hobo Pendant, Onset Computer Corporation, Massachusetts, USA).
Behavioural recording
The embryos were collected immediately after spawning, incubated in 12-well clear bottom plastic plates filled with 5 ml of embryo medium and exposed to a specific light condition. Each multi-well plate was placed on the water surface of a 10 L aquarium. The plate was fixed on the
base of the aquarium to avoid any change of position during the recording. The larvae were fed at 5 dpf and the embryo medium was partially changed every 2–3 days. Swimming activity pat-terns were recorded from 2 to 7 dpf, for each light condition. Larvae were recorded by means of a webcam adapted for infrared recording by removing the UV filter in front of the lens placed on the top of the aquarium and connected to a computer. An infrared LED (monocolor diode, model L-53F3BT, 5 mm) covered with a blurred white panel was placed under the aquarium to permit the video recording during the dark phase of experiment. These IR lamps emitted at 940 nm, which is not detected by zebrafish [39]. Two specialized software packages, Multiviewer and FishTracker (Computer System Department, University of Murcia), were used. The Multiviewer allowed simultaneous webcam recording. Every minute, 60 images (1 frame/s) were stored. The FishTracker quantified the larvae movements and has already been validated in sea bream [40] and zebrafish [41].
Molecular analysis
Embryos and larvae were maintained under different light conditions in Petri dishes and sam-pled at five different time points (ZT/CT 3, ZT/CT 9, ZT/CT 15, ZT/CT 21; ZT 0 = lights on, ZT 12 = lights off), during day 0, 3 and 7 post fertilization (dpf). For each ZT/CT, 20 embryos at 0 dpf and 10 larvae at 3 and 7 dpf were sampled and pooled. Four pooled samples per ZT/ CT were collected (n = 4). Total RNA was isolated from zebrafish embryos and larvae using Trizol reagent (Invitrogen, Carlsbad, CA, USA) following the manufacturer’s instructions. The amount, quality and composition of isolated RNA were analysed by BioSpec-nano (Shimadzu, Kyoto, Japan). One microgram of total RNA was incubated with DNase I (Invitrogen) at room temperature for 30 min and then at 85°C for 15 min to inactivate the enzyme. DNase-treated RNA was used to perform cDNA synthesis in a final volume of 20μl, using iScript cDNA Syn-thesis Kit (Biorad, Milan, Italy). The reaction was performed at 42°C for 30 min, followed by an inactivation step of 5 min at 85°C. Three microliters of 1:10 diluted first-strand cDNA was PCR amplified with a Chromo4 Real-Time PCR Detection System (Bio-Rad, Milan, Italy) using SsoFast EvaGreen Supermix (Bio-Rad Laboratories, Hercules, CA, USA). Thermal cycling conditions were as follows: 3 min denaturation at 95°C, followed by 40 cycles of a 5 s denaturation step at 95°C and an annealing-elongation step for 20 s at 60°C. After amplifica-tion, a melting curve analysis to confirm the specificity of the amplicon was performed from 60 to 95°C, with increments of 0.5°C 10 s−1. Gene-specific primers for clock1, bmal1, per1b, per2 and dbp have been previously described [10,42]. We verified the efficiency of the primers by constructing standard curves for all genes investigated. Moreover, the dissociation curve was used to confirm the specificity of the amplicon. The relative levels of each sample were cal-culated by the 2–ΔΔCTmethod (where CT is the cycle number at which the signal reaches the threshold of detection) [43]. As housekeeping genes we used gapdh, because of it is frequently used in zebrafish expression studies, and loopern4, an expressed repetitive elements recently showed as stable reference target for qPCR normalization [44]. Nearly identical results were observed with both housekeeping genes. Each CT value used for these calculations is the mean of three replicates of the same reaction.
Data analysis
The videos were analysed by FishTracker, a software developed by the Computer Vision Research Group of the University of Murcia [40–41]. The program tracks the movement of the larvae and provides the spatial coordinates, corresponding to the X:Y position in the well. The distance between two consecutive points (X1:Y1; X2:Y2) was calculated using the distance for-mula derived from the Pythagoras´ theorem and data were arranged in 10 minutes batches for
a total of 144 data per day. The locomotor activities were analysed using the chronobiology software“El Temps” (v. 275, Prof. Díez-Noguera, University of Barcelona) which allows acto-grams to be drawn and calculates the daily meanwave of the locomotor activity.
Statistical analysis
All the results are expressed as means ± SEM. Data were normally distributed (D'Agostino-Pearson normality test, p<0.05) and all populations had the same variance (Bartlett's test for equal variances, p<0.05). One-way and two-way analysis of variance (ANOVA) were used to determine differences in the locomotor activity among ZT/CT, dpf and lighting conditions. Two-way ANOVA tests were also carried out to determine statistical differences in gene expression between ZT/CTs and lighting conditions. Tukey´s HSD post-hoc test was used for the multiple comparison among groups (p<0.05). ANOVAs were performed using SPSS 15.0 (SPSS Inc., Chicago, IL, USA). To evaluate the presence of a rhythmic gene expression over a defined period of 24 hours, Cosinor analyses were performed (El Temps, v. 275, Prof. A. Díez-Noguera, University of Barcelona, Spain).
The daily acrophase of the locomotor activity rhythm for each larvae was calculated and the average acrophase for each day and for each group was determined by vector addition. The Rayleigh test was used to test whether the acrophases deviated from uniform (p<0.05). Uni-form scores test was applied to test for differences between the acrophases among days either intra- or inter-group (p<0.05) [45].
Results
Locomotor activity
All larvae hatched between 2 and 3 dpf. At 4 dpf, larvae from LDB group started to display a daily rhythm of locomotor activity (Fig 1B; Cosinor, p<0.001). Daily rhythms of activity became significant at 5 dpf in LDW and LDR groups (Fig 1A and 1C; Cosinor, p<0.001 and
p<0.01, respectively). Larvae reared under DD were arrhythmic during all the days recorded (Fig 1D; Cosinor, p>0.1). Larvae from all LD groups display the typical diurnal pattern of
zeb-rafish, with higher activity (>65%) during the light phase.
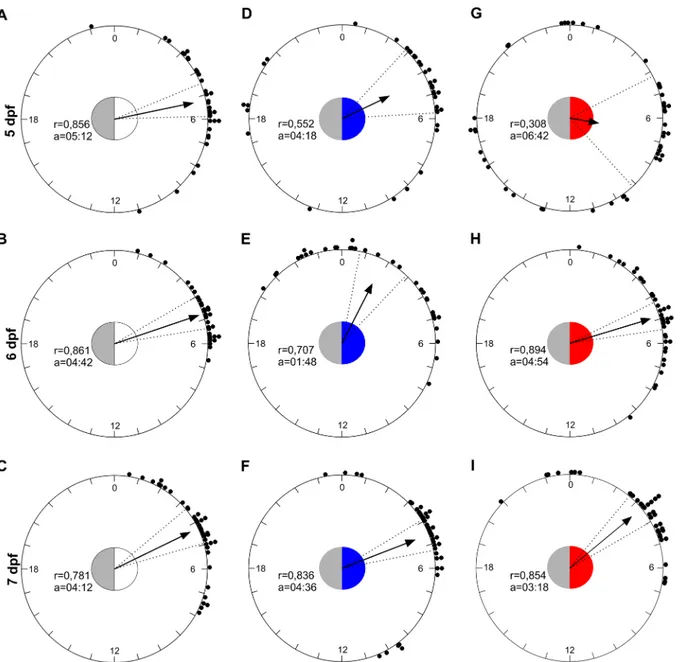
To verify the accuracy of the entrained rhythm we estimated the time of acrophases respect to the lights on (ZT0) in all groups from 5 to 7 dpf. Using a circular statistic approach, we showed that the distribution of acrophases deviated from uniform in LDW, LDB and LDR groups (Fig 2; Rayleigh test, 0.05<p<0.001), and the mean acrophases fell between ZT 2 and 7 (Fig 2). The distribution of acrophases from 5 to 7 dpf differed only between LDB and LDR groups (Mardia-Watson-Wheeler Test: LDW: W4= 5.4, p<0.05; LDB: W4= 38.9, p<0.0001; LDR: W4= 45.3, p<0.0001). The distribution among groups did not differ at 7 dpf (Mardia-Watson-Wheeler Test: W4= 4.5, p>0.3), and the mean acrophases fell at ZT 03:18–04:36 (Fig 2).
All groups showed an increase in the total daily locomotor activity throughout development (two-way ANOVA, p<0.05) (Fig 3). Larvae kept under LDB and LDR showed an increase in the total daily activity from 4 dpf, whereas a significant increase in activity under LDW and DD occurred at 5 dpf (Figs1and3). Considering the whole period of recording (5 days, from 2 to 7 dpf), larvae reared under LDW and LDB displayed significantly higher overall activity than larvae under LDR and DD (LDW: 60.17 m; LDB: 56.51 m; LDR: 42.05 m; two-way ANOVA, p<0.05). Furthermore, larvae reared in DD showed lower total activity with respect larvae reared in the other lighting conditions (DD: 27.36 m; two-way ANOVA, p<0.05).
Clock gene expression
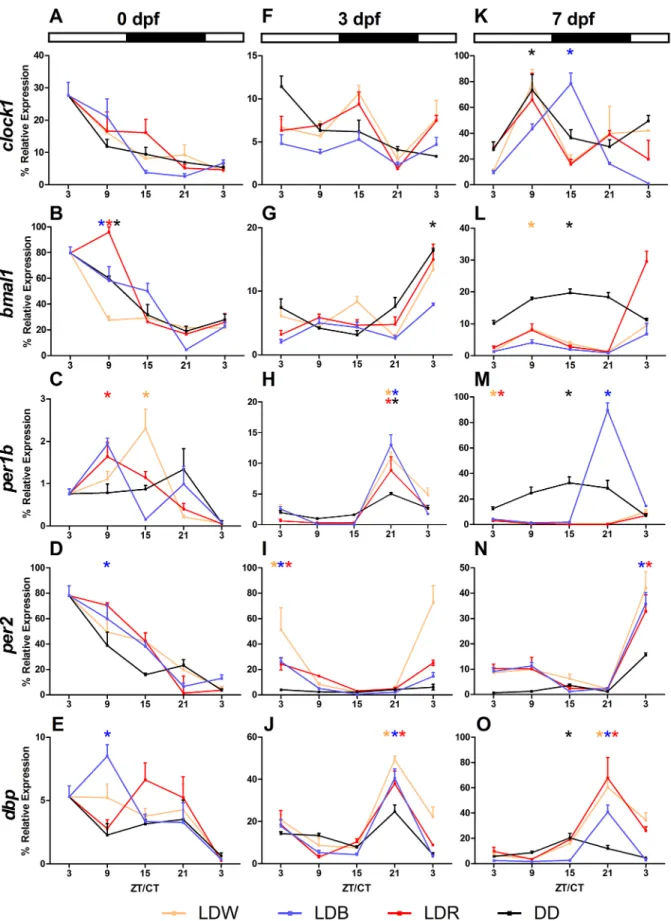
Embryos during the first 24 hours of life (0 dpf) showed variation of expression levels in all genes investigated (one-way ANOVA, p<0.05;Fig 4A–4E) and these variations were not affected by lighting conditions (two-way ANOVA, p>0.3;Fig 4A–4E). For the positive loop of the molecular clock, Cosinor analysis showed a significant rhythmicity (p<0.05) for bmal1 under LDW, LDR and DD, whereas clock1 expression levels were in all lighting conditions arrhythmic (p>0.05,Fig 4A and 4B). For the negative elements, per1b and per2 rhythmicity appeared only in some lighting conditions (Cosinor, p<0.05; per1b: LDW and LDR; per2: LDB;
Fig 4C and 4D). The clock-controlled gene dbp was rhythmic in LDB, but not under the other
Fig 1. Mean waveforms of locomotor activity under different lighting conditions from 2 to 7 dpf. Larvae reared under different light conditions (A: LDW, n = 35, B: LDB, n = 30, C: LDR, n = 30, D: DD, n = 45). Vertical axis represents activity (m/10 min) and horizontal axis zeitgeber/circadian time (ZT/CT). Bars above each panel indicate the lighting conditions [black bars indicate darkness, white bars indicate white light (LDW), blue bars indicate blue light (LDB), and red bars indicate red light (LDR)] and the day post-fertilization (dpf). Data are expressed as mean± SEM.
lighting conditions (Fig 4E). At 0 dpf all rhythmic genes displayed their acrophases during the light phase, with the exception of per1b under LDW (ZT 13:13 h) (Table 1).
At 3 dpf larvae had hatched, but the swim bladder was not developed and the yolk sac was the only source of energy. At this developmental stage, the negative element per1b was rhyth-mically expressed (one-way ANOVA, p<0.001; Cosinor, p<0.005;Fig 4H;Table 1), and its expression was mainly affected by LDB and DD conditions (two-way ANOVA, p<0.01;Fig 4H). Per2, other negative element of the loop and a light-inducible gene, also showed a signifi-cant rhythmic variation of the expression levels across the day under all wavelengths (one-way ANOVA, p<0.001; Cosinor, p<0.04;Fig 4I;Table 1), but not in DD (one-way ANOVA,
Fig 2. A circular representation of the phases of zebrafish activity across the 24 hours from 5 to 7 dpf under LDW, LDB and LDR. The dots represent the acrophase of each zebrafish larvae. The arrows indicate the average phases represented as vector and in each circle the mean vector length (r) and the mean acrophases (a) in ZT are reported. The circle inside each panel represents critical values of the Rayleigh test (p<0.05) and the coloured part show the duration of light phase (ZT 0–12). The dotted lines represent the confidence intervals.
p>0.09;Fig 4I). The highest induction of per2 by light was under LDW (two-way ANOVA, p<0.001;Fig 4I). Per1b and per2 rhythms were not in phase: per1b showed the acrophase rang-ing between ZT/CT 20:34–22:07, per2 at ZT/CT 3:06–4:24 (Table 1). Although ANOVAs revealed a significant variation during the 3 dpf (one-way ANOVA, p<0.05) and an effect of lighting conditions (two-way ANOVA, p<0.03), both positive elements clock1 and bmal1 did not show rhythmic variations of expression levels (Cosinor, p>0.1;Fig 4F;Table 1), except for bmal1 under DD (Cosinor, p<0.02;Fig 4G;Table 1). Dbp was rhythmic (one-way ANOVA, p<0.003; Cosinor, p<0.001;Fig 4J;Table 1) and affected by lighting conditions (two-way ANOVA, p<0.001). Dbp rhythms had acrophases between 21:09–21:33 ZT/CT (Fig 4J;
Table 1).
At 7 dpf larvae started exogenous feeding and were able to swim freely. In contrast to the other developmental stages analysed, clock1 expression levels at 7 dpf showed daily variations during the day (one-way ANOVA, p<0.04) and oscillated rhythmically under LDB and DD (Cosinor, p<0.008) with acrophases at ZT 13:21 and CT 09:04, respectively (Fig 4K). The other positive element investigated, bmal1, showed a similar daily pattern: rhythmic in DD and LDW (one-way ANOVA, p<0.04; Cosinor, p<0.03;Fig 4L;Table 1) with acrophases at CT 15:07 and ZT 8:33, respectively. The negative elements per1b and per2 showed temporal varia-tion in expression levels (one-way ANOVA, p<0.002). Per1b was rhythmic under all lighting
Fig 3. Daily activity under different lighting conditions from 2 to 7 dpf. Data are expressed as mean± SEM. Letters indicate statistical differences between the different days for each lighting condition (one-way ANOVA; Tukey’s post-hoc test, p<0.05). Symbols indicate statistical differences between the lighting conditions (two-way ANOVA; Tukey’s post-hoc test, p<0.05).
Fig 4. Daily expression levels of clock1, bmal1, per1b, per2 and dbp at 0, 3, 7 dpf in zebrafish larvae. Larvae reared under different light conditions (LDW, LDB, LDR, DD) were sampled every 6 hours at 0 (A, D, G, L, O), 3 (B, E, H, M, P) and 7 (C, F, I, N, Q) dpf. Data are expressed in % (100% is the
conditions (Cosinor. p<0.01,Table 1,Fig 4M) with acrophases at ZT 2:32–3:12 under LDW
and LDR respectively and ZT/CT 15:21–21:03 under DD and LDB, respectively. Per2 was rhythmic only under LDB and LDR (Cosinor, p<0.01,Table 1) with acrophases at ZT 4:24 under LDB and 4:24 under LDR (Fig 4N). Per1b and Per2 rhythms were strongly influenced by lighting conditions (two-way ANOVA, p<0.001). Dbp expression levels changed during the 7 dpf (one-way ANOVA, p<0.001) and showed rhythmic oscillations depending on the lighting conditions (two-way ANOVA, p<0.001). Dbp expression showed acrophase during the dark phase: ZT 20:28 under LDW, 20:04 under LDB and 20:01 LDB and CT 15:32 under DD (Cosi-nor, p<0.003;Fig 4O;Table 1).
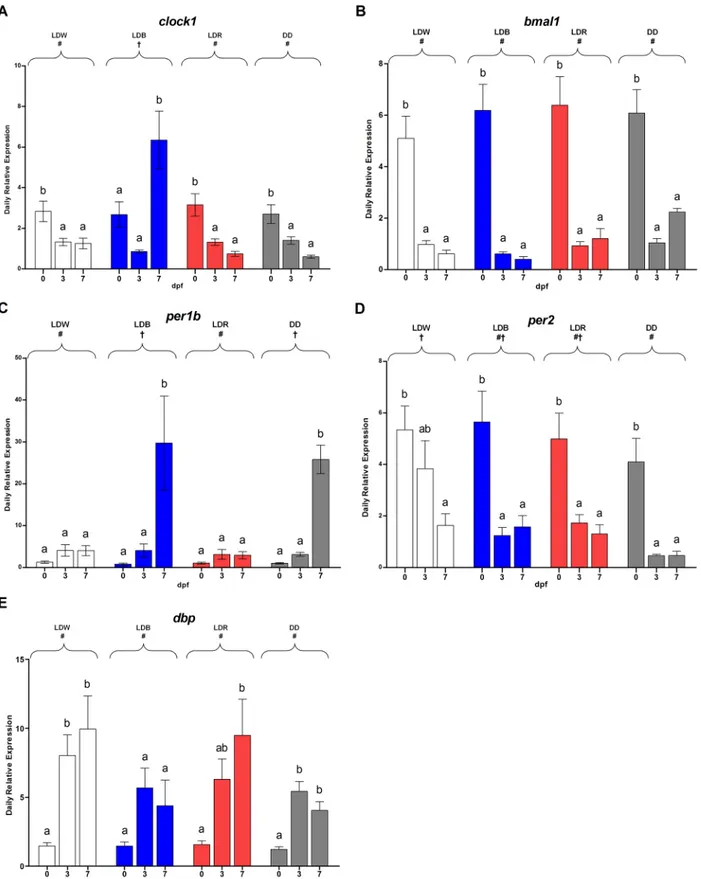
The comparison of mean expression levels of each gene showed differences depending on the experimental conditions (Fig 5). For instance, the highest levels of clock1, bmal1 and per2 expression levels were at 0 dpf (one-way ANOVA, p<0.01;Fig 5A, 5B and 5D). Differently, per1b and dbp showing the highest values at 3 and 7 dpf (one-way ANOVA, p<0.05;Fig 5C and 5E). The daily mean expression level of dbp was higher at 3 and 7 dpf respect to 0 dpf in LDW, LDR and DD (two-way ANOVA, p<0.001;Fig 5E), whereas in LDB the mean levels did not change during the first week of life (Tukey’s post-hoc, p<0.05;Fig 5E). Clock1 relative
maximum level detected for each gene in all dpf) and each value represents mean± SEM (n = 4). The bars above each group indicate the daily LD cycle. White bars represent the light phase and black bars represent phases of darkness. The DD group was kept under constant darkness. Asterisks indicate significant rhythms identified by Cosinor analysis (p<0.05).
doi:10.1371/journal.pone.0132235.g004
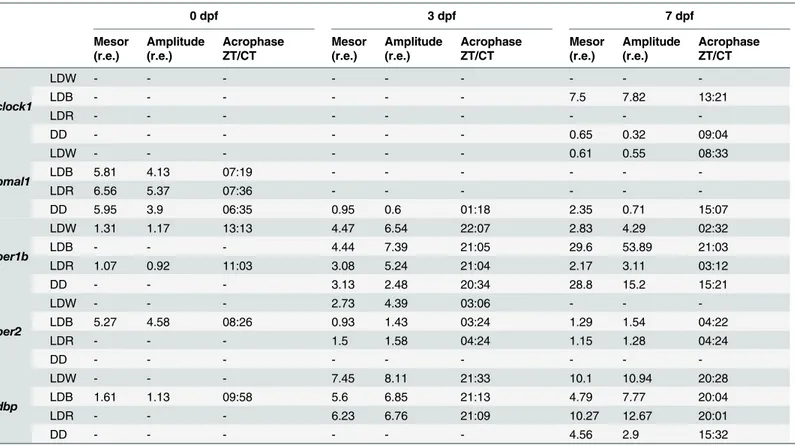
Table 1. Mesor, Amplitude and Acrophase defining clock gene expression rhythms at 0, 3 and 7 dpf.
0 dpf 3 dpf 7 dpf Mesor (r.e.) Amplitude (r.e.) Acrophase ZT/CT Mesor (r.e.) Amplitude (r.e.) Acrophase ZT/CT Mesor (r.e.) Amplitude (r.e.) Acrophase ZT/CT clock1 LDW - - - -LDB - - - 7.5 7.82 13:21 LDR - - - -DD - - - 0.65 0.32 09:04 bmal1 LDW - - - 0.61 0.55 08:33 LDB 5.81 4.13 07:19 - - - -LDR 6.56 5.37 07:36 - - - -DD 5.95 3.9 06:35 0.95 0.6 01:18 2.35 0.71 15:07 per1b LDW 1.31 1.17 13:13 4.47 6.54 22:07 2.83 4.29 02:32 LDB - - - 4.44 7.39 21:05 29.6 53.89 21:03 LDR 1.07 0.92 11:03 3.08 5.24 21:04 2.17 3.11 03:12 DD - - - 3.13 2.48 20:34 28.8 15.2 15:21 per2 LDW - - - 2.73 4.39 03:06 - - -LDB 5.27 4.58 08:26 0.93 1.43 03:24 1.29 1.54 04:22 LDR - - - 1.5 1.58 04:24 1.15 1.28 04:24 DD - - - -dbp LDW - - - 7.45 8.11 21:33 10.1 10.94 20:28 LDB 1.61 1.13 09:58 5.6 6.85 21:13 4.79 7.77 20:04 LDR - - - 6.23 6.76 21:09 10.27 12.67 20:01 DD - - - 4.56 2.9 15:32
Mesor and Amplitude are given as relative expression values (r.e.) and Acrophase as ZT. Rhythms are considered significant when p<0.05. Only statistically significant values (p<0.05) are reported.
Fig 5. Daily expression levels at 0, 3, 7 dpf of clock1 bmal1, per1b, per2 and dbp under different lighting conditions. The data are expressed as mean± SEM. The letters above each bar indicate significant differences for each condition among the days (one-way-ANOVA, p<0.05). The symbols on the top indicates statistically differences between the lighting conditions (two-way-ANOVA, Tukey’s post-hoc test, p<0.05).
expression was mainly influenced by LDB (Tukey’s post-hoc, p<0.008,Fig 5A). No statistical differences were detectable for both bmal and dbp among the lighting conditions (two-way ANOVA, p<0.2,Fig 5B and 5E). LDB and DD influenced the per1b mean expression differ-ently from LDW and LDR (Tukey’s post-hoc, p<0.03;Fig 5C). The effect LDW on Per2 expression is different from DD but not from LDB and LDR (Tukey’s post-hoc, LDW vs DD: p<0.01, LDW vs LDB-LDR: p<0.6, LDB-LDR vs DD: p<0.3;Fig 5D).
Discussion
Solar light is a complex environmental signal that influences the evolution of most biological processes on the Earth. Light is characterized by daily changes in irradiance, wavelength com-position, direction and polarization [46]. In the last years many investigations are taking into account a significant role of the different wavelengths [20–22]. Here we found that light wave-length affected the larval behaviour and the onset of the clock gene rhythmicity. At the beha-vioural level, larvae were arrhythmic under DD, while they developed daily activity rhythms under LD cycles, which appeared earlier in LDB (4 dpf) than in LDW or LDR (5 dpf). Further-more, larvae reared under LDW and LDB displayed significantly higher overall activity than larvae under LDR. At 7 dpf the phase of the rhythm in all lighting conditions is identical and the acrophases fell in the early day (ZT 3–4). Previous investigations showed that the rise of swimming behaviour in zebrafish larvae is linked to the maturation of serotoninergic neurons [47]. We cannot exclude that the anticipation of 1 day (4 dpf respect to 5 dpf) in the onset of the daily rhythm of locomotor activity and the high overall activity under blue light depends to a stimulation of the serotoninergic system by this lighting conditions.
Previous studies have shown that zebrafish behaviour under constant lighting conditions is regulated by an endogenous clock and that the LD cycle sets the phase of this clock [7,16]. For instance, LD cycles are required for the correct onset of behavioural rhythmicity in zebrafish larvae [16]. The amplitude of activity rhythms is directly correlated with the number of LD cycles to which embryos are subjected before they are transferred to DD conditions. Subjecting the zebrafish embryos to only one or two LD cycles after fertilization has been seen to signifi-cantly reduce the number of animals displaying circadian rhythmicity [16]. Our results agree with this study, since larvae reared under DD conditions, which only received 3 hours of light after fertilization, did not develop locomotor rhythmicity and displayed lower activity levels than fish reared under LD cycles. A recent investigation also showed the effects of DD on zeb-rafish larval development, growth and survival [20]. Zebrafish larvae raised in DD died before 18 days post-hatching (dph). Interestingly, larvae transferred to an LD cycle at 5 and 10 dph showed an improved survival rate compared with the larvae maintained in DD [20], which fur-ther underlines the importance of LD cycles to sustain normal development during early larval stages.
The analysis of clock gene ontogeny revealed different results in the animals under DD and LD conditions. For instance, under DD per2 rhythms failed to establish during the develop-ment, which has been observed in other fish species such as the medaka (Oryzias latipes) and the Senegalese sole (S. senegalensis) [15,48–49]. This effect of DD conditions would be explained by the fact that per2 is a light-inducible gene, and thus requires the presence of light for its daily rhythmicity to develop correctly [50]. Interestingly, the presence of constant light does not make for the regular expression of clock genes. In the rainbow trout, Oncorhynchus mykiss, the clock genes per1 and clock showed persistent rhythmicity in the larvae reared under LD conditions from 0 to 58 dpf, but not under constant lighting, when the rhythmicity is lost or developed later respect to the LD conditions [51]. The other negative element investigated, per1b, showed rhythmicity in DD from 3 dpf, whereas clock1 and dbp were rhythmic from 7
dpf. Only the positive element bmal1 had a rhythmic expression under DD from the embryo stage (0 dpf).
After 3 days of exposition to LD cycles, per1b, per2 and dbp showed a significant variation in the daily gene expression. On the contrary, genes from the positive loop of the clock, clock1 and bmal1, needed a longer time to start oscillating and after 7 days in LD cycles and only in two conditions they were rhythmic (clock1 in LDB and bmal1 in LDW). These discrepancies among the times of occurrence of rhythmicity among key components of the circadian clock has been suggested in other studies in fish [15,48–49].
Interestingly, we observed a daily rhythm at 0 dpf under all lighting conditions for some genes, with the acrophase located during the first hours after fertilization and expression levels falling during the rest of the day. A similar response has been observed previously in zebrafish and in Senegalese sole [48,52]. Rather than a real rhythmicity driven by an endogenous clock, this result might depend on a direct light induction of the first hours of light after fertilization [52], since in the present experiment even embryos reared in DD received 3 hours of light, while eggs were being collected, or alternatively, to the presence of maternal RNA (clock1, bmal1 and per2 at ZT 3 of 0 dpf) [53].
Clock genes from the negative loop (per1b and per2) displayed rhythmic expression early during development compared with clock1 and bmal1, results that did not depend on the pho-toreceptive system in zebrafish larvae. By 5 dpf, the larval retina is differentiated and func-tional, displaying responses evoked by visual stimuli. It expresses different opsins including melanopsin, a photopigment involved in circadian photoreception. Recent investigation in Danio rerio ZEM-2S cells points to melanopsin as the photopigment that mediating the photo-response increasing per2 and cry1a and slightly modulating per1b and cry1b expression [54– 56]. The pineal gland is formed around 18–22 hours post-fertilization and starts displaying
rhythmicity under LD cycles at 1 dpf [30,57]. Photoreceptive cells expressing TMT-opsin and melanopsin are present in the brain of 3–6 day old zebrafish larvae [58–59]. To date, it is unknown which requirements or processes are involved in delaying the appearance of clock1 and bmal1 rhythms compared with pers. However, in medaka too, the rhythmic expression of per is detected very early during development and rhythmic clock and bmal expression occurs later [49].
In the case of light wavelength, its effects on the ontogeny of fish are scarcely understood to date. Recent papers on this topic have focused on wavelength effects on larval performance, survival and the occurrence of malformations, finding that, in general, short (blue) wavelengths are better for fish development than long (red) wavelengths [20,22]. A drastic effect of short wavelengths on larval behaviour has also been found in the Senegalese sole [60]. The blue light condition was able to generate a switch in locomotor activity, changing the active phase from diurnal to nocturnal during larval metamorphosis onset. Conversely, long (red) wavelengths did not show any effect on the locomotor activity [60]. Also zebrafish PAC-2 cells seem to be more sensitive to short wavelengths: the expression level of light-inducible genes, cry1a, cry5 and per2, was higher when submitted to blue than to red lighting conditions [61]. Our results agree with those obtained in the other fish species reported above, since both behavioural and clock gene rhythms appeared earlier in the larvae reared under short wavelengths (LDB) than in those reared under long wavelengths (LDR).
In summary, our study provides novel insights into the ontogeny and the effects of lighting conditions on molecular daily rhythms, and how these rhythms are reflected in the behavioural rhythmicity of zebrafish larvae. The present results also underline the relevance of lighting con-ditions on fish development. The LD cycle and specific wavelength is essential for normal development of the circadian system. These conditions should be carefully considered when
fish embryos and larvae of zebrafish or other model fish species reared in laboratory facilities and in fish hatcheries for aquaculture companies.
Acknowledgments
The authors would like to thank Cecilia Turcato, Martina Cavallini, Andrea Margutti Irene Dall’Ara and Pietro Negrini for their help with the behavioural recordings and samplings.
Author Contributions
Conceived and designed the experiments: VDR FJSV CB. Performed the experiments: VDR EF CB. Analyzed the data: VDR EF JFLO FJSV CB. Contributed reagents/materials/analysis tools: FJSV CB. Wrote the paper: VDR EF JFLO FJSV CB.
References
1. Pittendrigh CS. Temporal organization: reflections of a Darwinian clock-watcher. Annu Rev Physiol. 1993; 55: 16–54. PMID:8466172
2. Devlin PF, Kay SA. Circadian photoperception. Annu Rev Physiol. 2011; 63: 677–694.
3. Hut RA, Paolucci S, Dor R, Kyriacou CP, Daan S. Latitudinal clines: an evolutionary view on biological rhythms. Proc Biol Sci. 2013; 280(1765): 20130433. doi:10.1098/rspb.2013.0433PMID:23825204 4. Jerlov NG. Optical oceanography. Amsterdam: Elsevier Publ. Comp.; 1968.
5. Loew ER, McFarland WN. The Underwater visual environment. In: Douglas RH, Djamgoz MBP, editors. The visual system of fish. London: Springer; 1990. pp. 1–43.
6. Peirson SN, Halford S, Foster RG. The evolution of irradiance detection: melanopsin and the non-visual opsins. Philos Trans R Soc Lond B Biol Sci. 2009; 364(1531): 2849–2865. doi:10.1098/rstb.2009.0050 PMID:19720649
7. Cahill GM, Hurd MW, Batchelor MM. Circadian rhythmicity in the locomotor activity of larval zebrafish. Neuroreport. 1998; 9: 3445–3449. PMID:9855296
8. Hurd MW, Debruyne J, Straume M, Cahill GM. Circadian rhythms of locomotor activity in zebrafish. Physiol Behav. 1998; 65(3): 465–472. PMID:9877412
9. López-Olmeda JF, Madrid JA, Sánchez-Vázquez FJ. Light and temperature cycles as zeitgebers of zebrafish (Danio rerio) circadian activity rhythms. Chronobiol Int. 2006; 23: 537–550. PMID:16753940 10. Idda ML, Kage E, López-Olmeda JF, Mracek P, Foulkes NS, Vallone D. Circadian timing of
injury-induced cell proliferation in zebrafish. PLoS ONE. 2012; 7: e34203. doi:10.1371/journal.pone.0034203 PMID:22479565
11. Haffter P, Granato M, Brand M, Mullins MC, Hammerschmidt M, Kane DA, et al. The identification of genes with unique and essential functions in the development of the zebrafish, Danio rerio. Develop-ment. 1996; 123: 1–36. PMID:9007226
12. Mullins M, Hammerschmidt M, Haffter P, Nussleinvolhard C. Large-scale mutagenesis in the zebrafish —in search of genes-controlling development in a vertebrate. Curr Biol. 1994; 4: 189–202. PMID: 7922324
13. Tamai TK, Vardhanabhuti V, Foulkes NS, Whitmore D. Early embryonic light detection improves sur-vival. Curr Biol. 2004; 14(3): R104–105. PMID:14986634
14. Ziv L, Gothilf Y. Circadian time-keeping during early stages of development. Proc Natl Acad Sci U S A. 2006; 103(11): 4146–4151. PMID:16537499
15. Dekens MP, Whitmore D. Autonomous onset of the circadian clock in the zebrafish embryo. EMBO J. 2008; 27: 2757–2765. doi:10.1038/emboj.2008.183PMID:18800057
16. Hurd MW, Cahill GM. Entraining signals initiate behavioral circadian rhythmicity in larval zebrafish. J Biol Rhythms. 2002; 17: 307–314. PMID:12164247
17. Colwill RM, Creton R. Locomotor behaviors in zebrafish (Danio rerio) larvae. Behav Processes. 2011; 86: 222–229. doi:10.1016/j.beproc.2010.12.003PMID:21147203
18. Ben-Moshe Z, Alon S, Mracek P, Faigenbloom L, Tovin A, Vatine GD, et al. The light-induced transcrip-tome of the zebrafish pineal gland reveals complex regulation of the circadian clockwork by light. Nucleic Acids Res. 2014; 42(6): 3750–3767. doi:10.1093/nar/gkt1359PMID:24423866
19. Vignet C, Bégout ML, Péan S, Lyphout L, Leguay D, Cousin X. Systematic screening of behavioral responses in two zebrafish strains. Zebrafish. 2013; 10(3): 365–375. doi:10.1089/zeb.2013.0871 PMID:23738739
20. Villamizar N, Vera LM, Foulkes NS, Sánchez-Vázquez FJ. Effect of Lighting Conditions on Zebrafish Growth and Development. Zebrafish. 2013; 11: 173–181.
21. Blanco-Vives B, Villamizar N, Ramos J, Bayarri MJ, Chereguini O, Sánchez-Vázquez FJ. Effect of daily thermo- and photo-cycles of different light spectrum on the development of Senegal sole (Solea sene-galensis) larvae. Aquaculture. 2010; 306: 137–145.
22. Villamizar N, Garcia-Alcazar A, Sánchez-Vázquez FJ. Effect of light spectrum and photoperiod on the growth, development and survival of European sea bass (Dicentrarchus labrax) larvae. Aquaculture. 2009; 292: 80–86.
23. Reppert SM, Weaver DR. Molecular analysis of mammalian circadian rhythms. Annu Rev Physiol. 2001; 63: 647–676. PMID:11181971
24. Reppert SM, Weaver DR. Coordination of circadian timing in mammals. Nature. 2002; 418: 935–941. PMID:12198538
25. Mueller CR, Maire P, Schibler U. DBP, a liver-enriched transcriptional activator, is expressed late in ontogeny and its tissue specificity is determined posttranscriptionally. Cell. 1990; 61: 279–291. PMID: 2331750
26. Ripperger JA, Shearman LP, Reppert SM, Schibler U. CLOCK, an essential pacemaker component, controls expression of the circadian transcription factor DBP. Genes Dev. 2000; 14: 679–689. PMID: 10733528
27. Gachon F. Physiological function of PARbZip circadian clock-controlled transcription factors. Ann Med. 2007; 39: 562–571. PMID:17852034
28. Vatine G, Vallone D, Gothilf Y, Foulkes NS. It’s time to swim! Zebrafish and the circadian clock. Febs Lett. 2011; 585: 1485–1494. doi:10.1016/j.febslet.2011.04.007PMID:21486566
29. Idda ML, Bertolucci C, Vallone D, Gothilf Y, Sánchez-Vázquez FJ, Foulkes NS. Circadian clocks: les-sons from fish. Prog Brain Res. 2012; 199: 41–57. doi:10.1016/B978-0-444-59427-3.00003-4PMID: 22877658
30. Ziv L, Levkovitz S, Toyama R, Falcon J, Gothilf Y. Functional development of the zebrafish pineal gland: light-induced expression of period2 is required for onset of the circadian clock. J Neuroendocri-nol. 2005; 17: 314–320. PMID:15869567
31. Carr AJ, and WhitmoreD. Imaging of single light-responsive clock cells reveals fluctuating free-running periods. Nat. Cell Biol. 2005; 7(3): 319–321. PMID:15738976
32. Ben-Moshe Z, Vatine G, Alon S, Tovin A, Mracek P, Foulkes NS, et al. Multiple PAR and E4BP4 bZIP transcription factors in zebrafish: diverse spatial and temporal expression patterns. Chronobiol Int. 2010; 27(8): 1509–1531. doi:10.3109/07420528.2010.510229PMID:20854132
33. Mracek P, Santoriello C, Idda ML, Pagano C, Ben-Moshe Z, Gothilf Y, et al. Regulation of per and cry genes reveals a central role for the D-box enhancer in light-dependent gene expression. PLoS ONE. 2012; 7(12): e51278. doi:10.1371/journal.pone.0051278PMID:23236462
34. Kaneko M, Cahill GM. Light-dependent development of circadian gene expression in transgenic zebra-fish. PLoS Biol. 2005; 3(2): e34. PMID:15685291
35. Vallone D, Lahiri K, Dickmeis T, Foulkes NS. Zebrafish cell clocks feel the heat and see the light! Zebra-fish. 2005; 2(3): 171–187. doi:10.1089/zeb.2005.2.171PMID:18248192
36. Weger BD, Sahinbas M, Otto GW, Mracek P, Armant O, Dolle D, et al. The light responsive transcrip-tome of the zebrafish: function and regulation. PLoS ONE. 2011; 6(2): e17080. doi:10.1371/journal. pone.0017080PMID:21390203
37. Dekens MPS, Santoriello C, Vallone D, Grassi G, Whitmore D, Foulkes NS. Light regulates the cell cycle in zebrafish. Curr Biol. 2003; 13: 2051–2057. PMID:14653994
38. Nüsslein-Volhard C, Gilmour DT, Dahm R. Zebrafish: a practical approach. New York: Oxford Univer-sity Press. 2002.
39. Lythgoe JN. Light and vision in the aquatic environment. In: Atema J, Fay RR, Popper AN, Tavolga WN, editors. Sensory biology of aquatic animals. New York: Springer; 1988. pp. 57–82.
40. Vera LM, Ros-Sanchez G, Garcia-Mateos G, Sánchez-Vázquez FJ. MS-222 toxicity in juvenile seab-ream correlates with diurnal activity, as measured by a novel video-tracking method. Aquaculture. 2010; 307: 29–34.
41. Sánchez-Vázquez FJ, Terry MI, Felizardo VO, Vera LM. Daily rhythms of toxicity and effectiveness of anesthetics (MS222 and Eugenol) in zebrafish (Danio rerio). Chronobiol Int. 2011; 28: 109–117. doi: 10.3109/07420528.2010.538105PMID:21231872
42. Cavallari N, Frigato E, Vallone D, Froehlich N, López-Olmeda FJ, Foà A, et al. A blind circadian clock in cavefish reveals that opsins mediate peripheral clock photoreception. PLoS Biol. 2011; 9: e1001142. doi:10.1371/journal.pbio.1001142PMID:21909239
43. Livak KJ, Schmittgen TD. Analysis of relative gene expression data using real-time quantitative PCR and the 2(-delta delta C(T)) method. Methods. 2001; 25: 402–408. PMID:11846609
44. Vanhauwaert S, Van Peer G, Rihani A, Janssens E, Rondou P, Lefever S, et al. Expressed Repeat Ele-ments Improve RT-qPCR Normalization across a Wide Range of Zebrafish Gene Expression Studies. PLoS ONE. 2014; 9(10): e109091. doi:10.1371/journal.pone.0109091PMID:25310091
45. Fisher N. I.. Statistical analysis of circular data. 1st ed. Cambridge: Cambridge University Press; 1993.
46. Björn L. O. Photobiology: The science of light and life. Springer Netherlands; 2002.
47. Brustein E, Saint-Amant L, Buss RR, Chong M, McDearmid JR, Drapeau P. Steps during the develop-ment of the zebrafish locomotor network. J Physiol Paris. 2003; 97: 77–86. PMID:14706693 48. Martin-Robles AJ, Aliaga-Guerrero M, Whitmore D, Pendon C, Munoz-Cueto JA. The circadian clock
machinery during early development of senegalese sole (Solea senegalensis): effects of constant light and dark conditions. Chronobiol Int. 2012; 29: 1195–1205. doi:10.3109/07420528.2012.719963PMID: 23003212
49. Cuesta IH, Lahiri K, López-Olmeda JF, Loosli F, Foulkes NS, Vallone D. Differential maturation of rhyth-mic clock gene expression during early development in medaka (Oryzias latipes). Chronobiol Int. 2014; 31: 468–478. doi:10.3109/07420528.2013.856316PMID:24456338
50. Vatine G, Vallone D, Appelbaum L, Mracek P, Ben-Moshe Z, Lahiri K, et al. Light directs zebrafish period2 expression via conserved D and E boxes. PLoS Biol. 2009; 7: e1000223. doi:10.1371/journal. pbio.1000223PMID:19859524
51. Davie A, Sanchez JA, Vera LM, Sánchez-Vázquez JF, Migaud H. Ontogeny of the circadian system during embryogenesis in rainbow trout (Oncorhynchus mykyss) and the effect of prolonged exposure to continuous illumination on daily rhythms of per1, clock, and aanat2 expression. Chronobiol Int. 2011; 28: 177–186. doi:10.3109/07420528.2010.550407PMID:21452914
52. Dekens MPS, Whitmore D. Autonomous onset of the circadian clock in the zebrafish embryo. Embo J. 2008; 27: 2757–2765. doi:10.1038/emboj.2008.183PMID:18800057
53. Harvey SA, Sealy I, Kettleborough R, Fenyes F, White R, Stemple D, et al. Identification of the zebrafish maternal and paternal transcriptomes. Dev Camb Engl. 2013; 140: 2703–2710.
54. Matos-Cruz V, Blasic J, Nickle B, Robinson PR, Hattar S, Halpern ME. Unexpected diversity and photo-period dependence of the zebrafish melanopsin system. PLoS ONE. 2011; 6: e25111. doi:10.1371/ journal.pone.0025111PMID:21966429
55. Fadool JM, Dowling JE. Zebrafish: a model system for the study of eye genetics. Prog Retin Eye Res. 2008; 27: 89–110. PMID:17962065
56. Ramos BCR, Moraes MNCM, Poletini MO, Lima LHRG, Castrucci AML. From blue light to clock genes in zebrafish ZEM-2S Cells. PLoS ONE. 2014; 9: e106252. doi:10.1371/journal.pone.0106252PMID: 25184495
57. Vuilleumier R, Besseau L, Boeuf G, Piparelli A, Gothilf Y, Gehring WG, et al. Starting the zebrafish pineal circadian clock with a single photic transition. Endocrinology. 2006; 147: 2273–2279. PMID: 16497800
58. Tessmar-Raible K, Raible F, Christodoulou F, Guy K, Rembold M, Hausen H, et al. Conserved sen-sory-neurosecretory cell types in annelid and fish forebrain: insights into hypothalamus evolution. Cell. 2007; 129: 1389–1400. PMID:17604726
59. Fernandes AM, Fero K, Arrenberg AB, Bergeron SA, Driever W, Burgess HA. Deep brain photorecep-tors control light-seeking behavior in zebrafish larvae. Curr Biol. 2012; 22: 2042–2047. doi:10.1016/j. cub.2012.08.016PMID:23000151
60. Blanco-Vives B, Aliaga-Guerrero M, Cañavate JP, García-Mateos G, Martín-Robles AJ, Herrera-Pérez P, et al. Metamorphosis induces a light-dependent switch in Senegalese sole (Solea senegalensis) from diurnal to nocturnal behavior. J Biol Rhythms. 2012; 27: 135–144. doi:10.1177/
0748730411435303PMID:22476774
61. Mracek P, Pagano C, Fröhlich N, Idda ML, Cuesta IH, López-Olmeda JF, et al. ERK Signaling regulates light-induced gene expression via d-box enhancers in a differential, wavelength-dependent manner. PLoS ONE. 2013; 8: e67858. PMID:23840779