LEADER
Lead-cooled European Advanced Demonstrator Reactor
Work Package No : WP2 Task No: N.A.
Identification No : DEL 027 – 2013 Revision: 0
Dissemination level : PU
Issued by: ENEA
Internal reference by editing organization :
UTFISSM-P9SZ-006
ALFRED core.
Summary, synoptic tables, conclusions and recommendations
SUMMARY:
This report summarizes the design, the neutronic characterization and the thermal-hydraulic analysis of the ALFRED core (Advanced Lead-cooled Fast Reactor European Demonstrator), a critical reactor (300 MWth) for the demonstrationof the lead-cooled reactors in the framework of the LEADER project (VII EURATOM FP). Some recommendations for future analyses are also provided.
AUTHORS:
C. Petrovich, K. Mikityuk, F. Manni, D. Gugiu, G. Grasso
G. Grasso ENEA N.A. G. Grasso ENEA A. Alemberti ANSALDO DATE AUTHOR Name/Company Signature TASK LEADER Name/Company Signature WP LEADER Name/Company Signature COORDINATOR Name/Company Signature
TABLE OF CONTENTS
1. Introduction ... 4
2. Core design ... 4
2.1. Main constraints and recommendations ... 5
2.2. Core design approach ... 6
2.3. Fuel pin and coolant sub-channel design ... 7
2.4. Core design ... 8
3. Neutronic characterization ... 10
4. Thermal-hydraulic analysis ... 13
5. Radiation damage, activation and doses ... 19
6. Synoptic table of ALFRED core main parameters ... 21
7. Conclusions and recommendations ... 22
1. Introduction
In the framework of the LEADER project [1] of the EURATOM VII Framework Programme, ALFRED (Advanced Lead-cooled Fast Reactor European Demonstrator) is devoted to the demonstration – to the largest extent – of the technology of fast reactors cooled by lead. It can thus play the role of the ETDR (European Technology Demonstrator Reactor) in the overall technology chain ending up with the deployment of an industrial LFR (the European Lead-cooled Fast Reactor, ELFR) in the horizon 2045-2050, as stated in the SNETP Strategic Research and Innovation Agenda [2].
This document provides a summary of the core design, describing the design goals and the constraints, as well as the rationales for accounting the latter in the assessment of its configuration, up to the neutronic characterization and the thermal-hydraulic analysis. At the end of the document, some concluding remarks about the present configuration are drawn together with some recommendations for future work, meant for a further assessment of this conceptual core design.
For more and detailed informations on the calculations, see the reports [3 - 6].
2. Core design
The successful demonstration of the LFR technology chain by 2045-2050 requires the realization of the demonstrator by 2025. According to this schedule, ALFRED has to rely on already proven technological solutions to speed up the design and the licensing phases: this requirement dictates the choice of the materials and of the components (e.g.: the proven 15-15 Ti steel for the cladding instead of ferritic-martensitic T91, or the double-wall bayonet-tube steam generator instead of the spiral one [7]).
In its demonstration role, ALFRED is called at proving, in particular, the effectiveness of the safety features. This point has furthermore assumed a paramount importance as a consequence of the Fukushima events.
According to these considerations, and keeping as reference the industrial reactor ELFR [8], the ALFRED core parameters have been organized into families, depending on their importance to what concerns the demonstration aim:
Parameters that must be kept for demonstration: • materials (fuel, clad, coolant),
• core inlet temperature;
Parameters that should be kept, but not necessarily reached at their maximum: • peak burn-up,
• fission gas plenum pressure, • maximum cladding temperature, • coolant velocity,
• linear power rating (hence fuel temperature); Parameters that might be borrowed, but could not be kept:
• core height,
• core pressure drops;
Parameters that could be different, but it is wiser keeping for more persuasive coherence:
• fuel assembly concept;
Parameters that do not need to be the same for validation: • pin diameter,
• clad thickness, • gap thickness, • pins lattice pitch; Parameters that cannot be kept:
• core power,
• fuel enrichment (Plutonium content), • breeding ratio.
2.1. Main constraints and recommendations
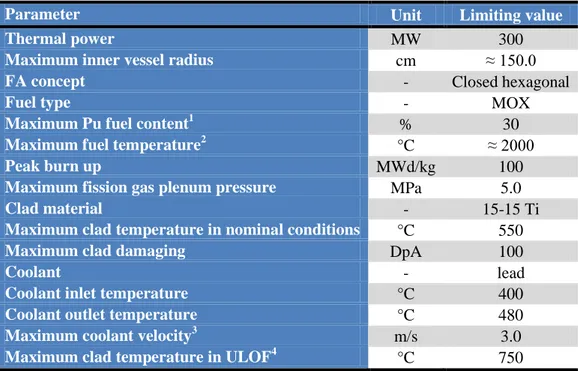
Following the presented logical scheme, a list of constraints and design goals has been compiled to provide a reference for the design of the core (Table 1).
Table 1. Main technological constraints and goals for the ALFRED core design.
Parameter Unit Limiting value
Thermal power MW 300
Maximum inner vessel radius cm ≈ 150.0
FA concept - Closed hexagonal
Fuel type - MOX
Maximum Pu fuel content1 % 30
Maximum fuel temperature2 °C ≈ 2000
Peak burn up MWd/kg 100
Maximum fission gas plenum pressure MPa 5.0
Clad material - 15-15 Ti
Maximum clad temperature in nominal conditions °C 550
Maximum clad damaging DpA 100
Coolant - lead
Coolant inlet temperature °C 400
Coolant outlet temperature °C 480
Maximum coolant velocity3 m/s 3.0
Maximum clad temperature in ULOF4 °C 750
1
This value has been set because of fabrication limits [9].
2
The limit on the maximum fuel temperature in operation is set to provide a margin against melting (≈ 2700 °C) which is sufficient to accommodate temperature excursions during transients (with particular regard to Unprotected Transients of Over-Power, UTOP).
3
The value of the maximum coolant velocity to contain erosion refers to the maximum allowable component of the lead velocity normal to structural surfaces. This limit must therefore be translated, by means of CFD analyses, in a corresponding limit on the coolant velocity through the pin bundle.
4
The Unprotected Loss Of Flow (ULOF) accident has been selected, being the most penalizing for what concerns the cladding temperature.
The only parameter that has been changed with respect to the ELFR is the cladding material: indeed, the expected time required for the full qualification of a T91 cladding (together with a suitable coating) in lead is not compatible with the roadmap for ALFRED. On the other hand, the temperature limit for the cladding is the same as for T91, because it is assumed that also the 15-15 Ti cladding tubes will be coated to enhance the protection against lead corrosion and erosion.
As can be seen from Table 1, the ALFRED design is challenging because of the narrow temperature range to be respected, bounded by the 400 °C of the coolant inlet temperature (to prevent with sufficient margin lead freezing) and the 550 °C of cladding temperature in the hottest fuel pin. This temperature interval is even further reduced if we take into account the need to introduce sufficient margins against the propagation – towards the main core parameters – of the uncertainties, whose reduction and assessment is one of the main rationales for the need of a demonstration reactor.
2.2. Core design approach
A comprehensive core design strategy (Figure 1) has been adopted, approaching systemically, from a thermal-hydraulic, thermo-mechanic and neutronic point of view, all the aspects of the reactor core impacting on the safety and the robustness of the plant. As a matter of fact, such an approach allows for the a priori definition of a core which respects, at least in first approximation, all the technological constraints and fulfils all the performance objectives by design. Then the results are checked a posteriori with more detailed code calculations.
Figure 1. Scheme of the comprehensive core design approach followed.
According to this, the ALFRED fuel pin and the fuel assembly have been designed, as well as the control and safety systems, the reflector and the core. In particular, preliminary analyses have been performed to check whether the investigated fuel pin and the coolant sub-channel allow for an acceptable thermic of the pin and a sufficient natural circulation in ULOF conditions without exceeding some safety limits, mainly linked to the clad temperature.
2.3. Fuel pin and coolant sub-channel design
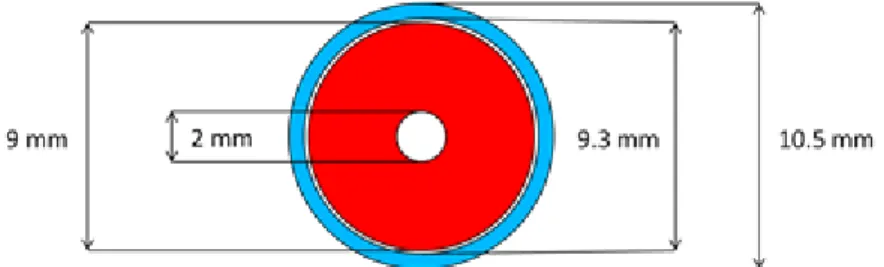
The first phase of the core design process foresees a preliminary thermal/hydraulic analysis of both the fuel and cladding maximum temperatures in the hottest channel. Since the latter – together with the coolant inlet and outlet temperatures – are the same as for the ELFR [8], the design of the fuel pin has been borrowed by this system, together with the maximum linear power rating (≈ 340 W/cm). The same assumption holds considering the target peak burn up (≈ 100 MWd/kg), so that the hollowed fuel concept of the ELFR has been kept to accommodate the irradiation-induced swelling without incurring in unacceptable Pellet-Cladding Mechanical Interaction (PCMI). The resulting (radial) fuel pin design is shown in Figure 2.
Figure 2. ALFRED fuel pin cross-section.
The design of the sub-channel cannot omit preliminary safety analyses to verify the respect of the cladding integrity for the desired grace time (30 minutes before SCRAM is manually actuated) in case of accident. To account for this constraint, the natural circulation regime during an ULOF transient has to be evaluated. Having this in mind, the sub-channel has to be designed so as to offer a hydraulic diameter to which the associated pressure losses can be overtaken with a small prevalence, attained through coolant temperatures complying with the non-failure of the structures against thermal creep.
On the other hand, the wider the pitch, the lower the fuel volume fraction in the elementary cell, to the detriment of the reactivity of the system. According to this, taking into consideration also the constraint imposed for the inner vessel radius, the natural circulation regime in case of ULOF has been evaluated by means of the SIMMER code [10] for four different configurations, characterized by two values of the nominal coolant flow velocity (1.4 and 1.5 m/s) and two values of the active height (60 and 90 cm).
The results of this investigation suggested the viability of the configuration corresponding to a coolant velocity of 1.4 m/s and 60 cm core active height. For the final dimensioning of the coolant sub-channel, it has been necessary to infer the radial and axial power form factors by considerations coming from experience: according to these assumptions – which automatically become recommendations for the neutronic design of the core – the corresponding pitch for the fuel pins lattice is set to 13.86 mm.
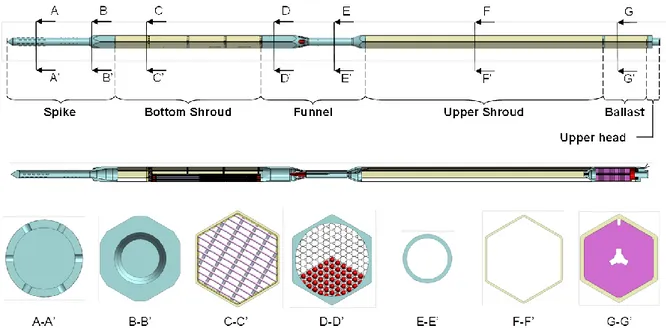
The mechanical design of the ALFRED Fuel Assembly (FA), borrowing the same concept adopted for the ELFR [8], started by completing the design of the fuel pin: the axial extensions of the plenum and the spring have been set in order to comply with the target pressure of the fission gases and to allow for a free differential expansion of the fuel column and the cladding, respectively. Then, a T91 wrapper with a sufficient stiffness has been added, enclosing 127 fuel pins arranged in a triangular lattice to form the bundle. The axial design of
the ALFRED fuel pin and the horizontal cross-cut of the FA are shown in Figure 3, while the axial sketch of the entire ALFRED FA is shown in Figure 4.
Figure 3. Final ALFRED fuel pin (left) and FA cross-section (right). Dimensions in mm.
Figure 4. Axial sketch of the entire ALFRED FA.
2.4. Core design
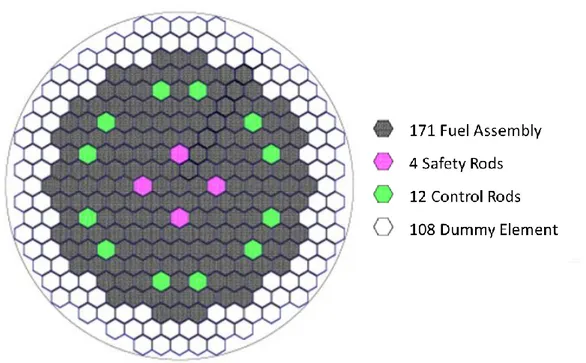
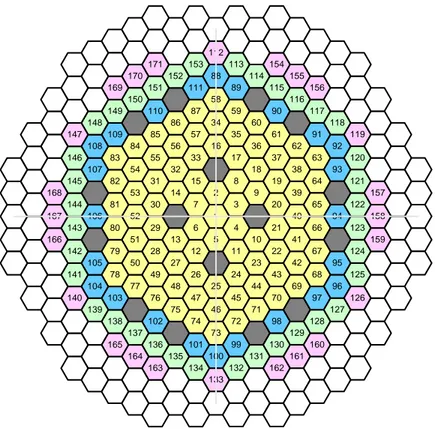
Starting from the maximum linear power rating and the axial and radial power form factors, the average linear power rating is computed and used to define the number of fuel pins to be arranged to reach the aimed 300 MWth. The corresponding number of FAs (171) can be
arranged to form a cylindrical core, together with 16 positions for Control and Safety Rods (CRs and SRs respectively), surrounded by two rings of dummy elements shielding the inner vessel with only a small – yet tollerable – increase of the imposed radius (Figure 5).
Figure 5. Core scheme.
The design of the control and safety systems has been adapted from the CDT-MYRRHA project [11]. Two independent systems are considered:
a Control Rod (CR) system, used for both normal control of the reactor (start-up, reactivity control during the fuel cycle, power tuning and shutdown) and for SCRAM in case of emergency;
a Safety Rod (SR) system, used only for SCRAM.
The considered absorber material is B4C (with 90 at.% 10B) with density 2.2 g/cm3.
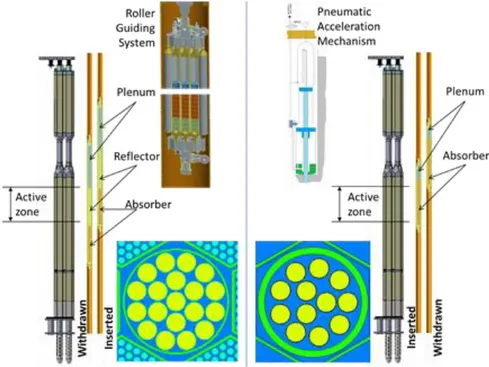
The CRs are made of a cylindrical bundle of 19 pins (left frame of Figure 6), cooled by primary lead and positioned into a guiding tube occupying a position in the core map. Their withdrawn position is below the core, and are actuated by motors during operation (compensation, start-up, power tuning and controlled shutdown), but are provided also of an electromagnetic connection whose release allows for a rapid insertion into the core by buoyancy for emergency shutdown. To tune the velocity of insertion, the volume of the plenum in the absorbing pins can be adjusted at will. The CRs are provided of a roller guiding mechanism to allow for the self-centring of the bundle within the guiding tube even in case of distortions of the tube itself (e.g.: in case of earthquake).
The SRs are similarly conceived: they are made of a bundle of 12 absorbing pins (right frame of Figure 6), cooled by primary lead and positioned into a guiding tube occupying a position in the core map. During normal operation they stay still atop the active zone. Their only actuation is for SCRAM, through the unlocking of an electromagnet. When the latter is turned off, the resistance to a pneumatic system is simultaneously lost, so that the SRs are passively pushed rapidly into the core. To face the failure of the pneumatic system, a tungsten ballast is added atop the SRs, providing a sufficient weight to contrast the buoyancy and ensure the insertion of the SRs into the core, even if at reduced speed.
Figure 6. Schemes and cross sections of ALFRED CRs (left) and SRs (right).
3. Neutronic characterization
Starting from the results and recommendations outcoming from the core design, a thorough analysis followed, to point out the enrichments (i.e. Pu content) and the zoning of the core to ensure criticality and the aimed power/FA distribution flattening.
A hypothesis for the cycle management of the fuel had to be put forward. Starting from the maximum linear power and the corresponding fuel inventory, the goal for the peak burn up is achieved after 5 y of full-power irradiation, which has therefore been assumed as in-pile residence time for the FAs. In order to minimize the initial enrichment, as well as the criticality swing during an irradiation cycle, it was decided to adopt a 5-batches reloading scheme, without reshuffling.
The compositions of the U and Pu vectors have been evaluated, considering, respectively, depleted uranium and plutonium extracted from LWR spent fuel (burnt up to 45 GWd/t, with a 4.5% initial enrichment in 235U) after a total of 15 y of cooling, 4 of which after reprocessing (so that also the decay of 241Pu into 241Am has been taken into account).
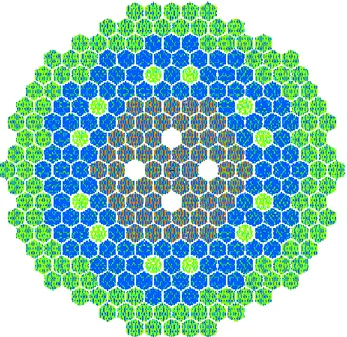
The final configuration satisfying the design goals has been achieved considering 57 FAs (out of 171) in the inner core, with fuel enriched at 21.7 at.% (Pu+241Am), and the surrounding 114 FAs with fuel enriched at 27.8 at.%, as shown in Figure 7.
Figure 7. Inner (57 violet FA) and outer (114 blue FA) core zones, surrounded by 108 dummy elements (dark green); CRs and SRs are also shown (light green and white, respectively). An evaluation of the power/FA distribution factors during the 5 sub-cycles of an equilibrium cycle has been also performed to take into account the local effect of loading fresh fuel into the core. The results are shown in Figure 8.
0 10 20 30 40 50 60 70 80 90 100 110 120 130 140 Radius, cm 0.5 0.6 0.7 0.8 0.9 1.0 1.1 1.2 1.3 1.4 1.5 S A p ea k in g f ac to r BOC1 EOC1 BOC2 EOC2 BOC3 EOC3 BOC4 EOC4 BOC5 EOC5 Average
Figure 8. Power/FA distribution factors at Beginning and End of each of the 5 sub-cycles during an equilibrium cycle as a function of the distance from the core center.
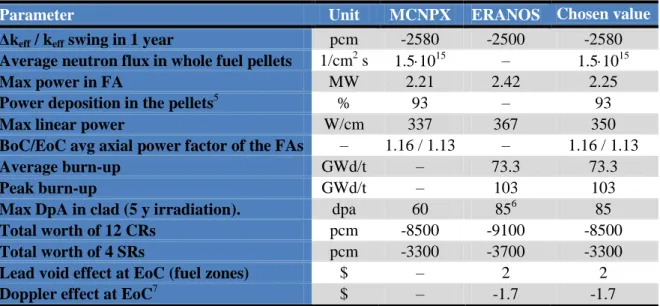
The main parameters of the successive complete neutronic characterization, performed by ENEA with MCNPX [12] and by CEA with ERANOS [13], using the Jeff 3.1 library [14], are reported in Table 2.
On the last column on the right, the chosen values are reported, obtained after a critical analysis of the code models and of the different assumptions made (see [3] for the rationales of these choices). As a matter of fact, some discrepancies between the results of the 2 codes can be explained by their different features (e.g.: the values for the power obtained by ERANOS should be lowered because it does not take into account the detailed
neutron-gamma transport and the values obtained by MCNPX should be increased because it does not take into account the realistic batch refuelling). Therefore the agreement between the results is here considered satisfactory.
Table 2. Neutronic characterization.
Parameter Unit MCNPX ERANOS Chosen value
Δkeff / keff swing in 1 year pcm -2580 -2500 -2580
Average neutron flux in whole fuel pellets 1/cm2 s 1.51015 – 1.51015
Max power in FA MW 2.21 2.42 2.25
Power deposition in the pellets5 % 93 – 93
Max linear power W/cm 337 367 350
BoC/EoC avg axial power factor of the FAs – 1.16 / 1.13 – 1.16 / 1.13
Average burn-up GWd/t – 73.3 73.3
Peak burn-up GWd/t – 103 103
Max DpA in clad (5 y irradiation). dpa 60 856 85
Total worth of 12 CRs pcm -8500 -9100 -8500
Total worth of 4 SRs pcm -3300 -3700 -3300
Lead void effect at EoC (fuel zones) $ – 2 2
Doppler effect at EoC7 $ – -1.7 -1.7
The reactivity feedbacks, computed during the equilibrium cycle, are presented in Table 3. They have been evaluated using the exact perturbation theory.
Table 3. Reactivity feedback coefficients (ERANOS calculations).
Computed parameter Unit BoC EoC
Effective delayed neutron fraction pcm 336 335 Control rods upshift of 1 mm pcm -19.2 -9.3 Safety rods upshift of 1 mm pcm 0.225 0.225 Lead expansion coefficient8 pcm/K -0.271 -0.268
Axial clad expansion pcm/K 0.037 0.039
Axial wrapper tube expansion pcm/K 0.022 0.023
Radial clad expansion pcm/K 0.008 0.011
Radial wrapper tube expansion pcm/K 0.002 0.003
Grid expansion pcm/K -0.762 -0.789
Axial fuel expansion: free pcm/K -0.148 -0.155 Axial fuel expansion: linked pcm/K -0.232 -0.242
Doppler constant pcm -555 -566
Iron part of the Doppler constant pcm -74 -66 Fuel part of the Doppler constant pcm -481 -500
5
Due to gamma emission in the fission process deposited outside the pellets.
6
This value, computed by means of the NRT model [15], has been evaluated considering pure iron instead of the actual mix of elements constituting the cladding.
7
The Doppler constant has been evaluated between ~1500 and ~2500 K.
8
Calculated on the whole height of the fissile sub-assemblies (the other feedbacks are calculated only in the fissile zone)
More information can be found in [3] about: the rationales for the design approach, the code models and the calculation methods, the detailed isotopic composition of the materials, the power deposition distribution, the control/safety systems, the approach for the feedback reactivity effects, the burnup swing, the composition of the irradiated fuel and the tritium and helium production. Furthermore, different FA maps can be found on the: integrated power, maximum linear powers, axial form factors, average and maximum fluxes.
4. Thermal-hydraulic analysis
Starting from the results of the neutronic assessment of the ALFRED core, a complete thermal-hydraulic analysis has been preformed to assess the design of the entire FA as well as to evaluate the hot-spots distribution, so to provide feedbacks to the core design [4].
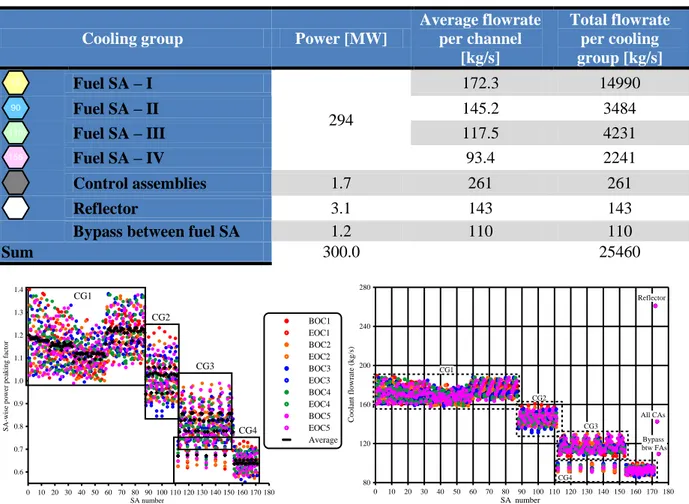
The study has started with a 1D thermal-hydraulic analysis, using the TRACE code and the neutronic results of the spatial power distribution in the ALFRED core at different stages of the equilibrium fuel cycle (as show in Figure 8). An attempt was done to develop a gagging scheme for the core in order to provide the coolant temperature radial distribution at the core outlet as flat as possible. The main results are presented in Figure 9 and Table 4. The resulting difference (Figure 10) between the maximum and minimum coolant temperatures at the core outlet (for 10 different phases of the equilibrium fuel cycle) is ~17 ºC. The distribution can be roughly approximated by the normal distribution function with a standard deviation equal to σ ~ 3 ºC. 56 110 170 2 16 34 58 88 112 133 100 73 46 25 5 1 7 15 33 57 87 111 153 134 101 74 47 26 12 6 14 32 86 152 135 75 48 27 13 30 31 55 85 151 171 163 136 102 76 49 28 29 53 54 84 150 164 137 77 50 51 52 82 83 109 149 169 165 138 103 78 79 80 81 107 108 148 139 104 105 106 146 147 140 141 142 143 144 145 166 167 168 3 8 17 35 59 89 113 132 99 72 45 24 11 4 9 18 36 60 114 131 71 44 23 10 20 19 37 61 90 115 154 162 130 98 70 43 22 21 39 38 62 116 155 161 129 69 42 41 40 64 63 91 117 156 160 128 97 68 67 66 65 93 92 118 127 96 95 94 120 119 126 125 124 123 122 121 159 158 157
Table 4. Parameters of the cooling groups for the ALFRED core.
Cooling group Power [MW]
Average flowrate per channel [kg/s] Total flowrate per cooling group [kg/s] 16 Fuel SA – I 294 172.3 14990 90 Fuel SA – II 145.2 3484 115 Fuel SA – III 117.5 4231 156 Fuel SA – IV 93.4 2241 Control assemblies 1.7 261 261 Reflector 3.1 143 143
Bypass between fuel SA 1.2 110 110
Sum 300.0 25460 0 10 20 30 40 50 60 70 80 90 100 110 120 130 140 150 160 170 180 SA number 0.6 0.7 0.8 0.9 1.0 1.1 1.2 1.3 1.4 S A -w is e p o w er p ea k in g f ac to r CG1 CG2 CG3 CG4 0 10 20 30 40 50 60 70 80 90 100 110 120 130 140 Radius, cm 0.5 0.6 0.7 0.8 0.9 1.0 1.1 1.2 1.3 1.4 1.5 S A p e a k in g f a ct o r BOC1 EOC1 BOC2 EOC2 BOC3 EOC3 BOC4 EOC4 BOC5 EOC5 Average 0 10 20 30 40 50 60 70 80 90 100 110 120 130 140 150 160 170 180 SA number 80 120 160 200 240 280 C o o la n t fl o w ra te ( k g /s ) CG1 CG2 CG3 CG4 Reflector All CAs Bypass btw FAs
Figure 10. Identified cooling groups (left) and new flow rates (right) of the proposed gagging scheme. As a second step, a CFD analysis, using the STAR-CCM+ code, was performed to evaluate the performance of spacer grids of different designs focusing, in particular, on the pressure losses through the grid and the impact on temperature distribution in the vicinity of the grid. The spacer designs considered for the ALFRED core and the main results of the CFD analysis are presented in Figure 11. The colors illustrate the temperature distribution, with yellow and red showing the location of the hot spots. The pressure losses for four spacer grids (3 spacer grids and one pin support grid) were estimated as ~ 0.28 bar for the peak power SA with the highest flowrate.
EFIT design Pressure drop: 0.07 bar
Peak Tclad: 515 ºC
SRS design Pressure drop: 0.10 bar
Peak Tclad: 545 ºC
Strips design Pressure drop: 0.07 bar
Peak Tclad: 527 ºC Figure 11. The spacer designs considered and main results of the CFD analysis.
As a third step of the study, the CFD analysis, using the ANSYS/CFX code, was performed to evaluate the pressure losses at the SA inlet and outlet. Figure 12 shows the design of the inlet and outlet sections as well as the ranges of the pressure losses corresponding to different flowrates. As a result of the parametric study, the dependencies of the pressure losses at the SA inlet and outlet on the flowrate were derived. These dependencies are shown in Figure 13 together with the flowrate intervals corresponding to the minimum flowrate corresponding to the cooling group IV (CG-IV) and to the maximum flowrate corresponding to cooling group I (CG-I); see Figure 10 and Table 4.
Spike (SA inlet) design Pressure drop: 0.17 – 0.58 bar
Funnel (SA outlet) design Pressure drop: 0.03 – 0.10 bar Figure 12. Designs of the spike (SA inlet) and funnel (SA outlet)
and pressure drop ranges for different flowrates.
0 50 100 150 200 250 Flowrate (kg/s) 0.0001 0.001 0.01 0.1 1 P re ss u re d ro p ( b ar ) Spike (inlet) Funnel (outlet) Tube bundle* Spacer grid** Flowrate for CG-IV (min) Flowrate for CG-I (max)
* pressure drop is recalculated for the whole length of the tube bundle (1330 mm) ** recalculated for 4 spacer grids
Figure 13. Pressure drops at the spacer grids, SA inlet and outlet as well as bare tube bundle as a function of mass flowrate as calculated by the CFD codes.
The fourth step was devoted to the CFD assessment of a bare fuel rod bundle, using the FLUENT 6.3 code. The pressure losses due to friction were evaluated for the fuel region (600 mm) as a function of the averaged Reynolds number at the inlet of the fuel region. The obtained dependence (roughly recalculated to the whole length of the SA) is presented in Figure 13 as a function of the flowrate. Using Figure 13, one can roughly estimate the total ALFRED core pressure loss under different flowrate conditions. The pressure loss at the SA inlet can naturally be used for gagging the flowrate.
Additionally, the friction factor as a function of Reynolds was calculated with the CFD code and compared with widely-used correlations for friction factor (both for round tubes and tube bundles). The results of this comparison are shown in Figure 14 which can be useful for 1D simulation of the ALFRED core and especially for definition of the transition region between laminar and turbulent regimes.
100 1000 10000 100000 Reynolds number 0.001 0.01 0.1 1 F ri ct io n f ac to r 64/Re 0.316/Re0.25 CFD results
Figure 14. Friction factor as a function of Reynolds number: comparison of correlations for laminar and turbulent flows with the CFD predictions.
The final phase of the study was devoted to the assessment of the inter-assembly flow and temperature distributions, using the ANSYS FLUENT CFD code and the ANTEO-LFR sub-channel code. Both studies showed that in the current design of the FA there is an odd heating of the subchannels, the corner ones becoming sensibly hotter than the other ones (clearly seen in Figure 15).
Figure 15. Bulk temperatures of the subchannels in the hottest (central) FA (left) and in the FA with the hottest pin (in the first crown of the outer core) (right).
Figure 16. Location of maximum cladding and fuel temperatures in the central FA.
The directmost impacts of this effect are the overheating of the corner fuel rod cladding (Figures 16 and 17 report the plots of the axial temperature distributions for the hottest pins in the hottest FA and in the FA with the hottest pin, as retrieved by means of ANTEO-LFR) and an excessive diametral difference of the cladding temperature (Figure 18). It can be seen that, for the hottest pin, both the cladding temperature on the outer surface and the maximum fuel temperature exceed the design limits. While for the fuel temperatue the limit was set temptatively – the actual limit being deduced by safety analyses (see footnote 2 at page 5) –, so that only a warning can be raised from the T/H analysis of the ALFRED core, concerning the cladding temperature the limit is actually overcome. This issue is even more emphasized if we consider the need for setting the nominal temperatures in view of an accurate analysis of the uncertainties, whose reduction is one of the main intentions of ALFRED.
Figure 17. Location of maximum cladding and fuel temperatures in the FA with the hottest pin.
Figure 18. Detailed view of the circumferential cladding temperature distribution at the outlet section of the central FA (1/12th model).
The same issues – even if somehow reduced – are found also taking into account the increased flowrate due to the gagging of the FAs and the thermal coupling of the peripheral subchannels with the lead flowing in the by-pass outside the wrapper. Two options were therefore analyzed to go over this issue, nominally: the increase of the gap between the last row of the fuel rods and the wrapper, and the increase of the inter-SA flowrate. Details on the effect of these modifications can be found in [4].
5. Radiation damage, activation and doses
Preliminary radiation damage evaluations have been performed for the most sensible components of ALFRED, that is: the Inner Vessel (IV) and its support, the reactor tank and the Steam Generators (SGs) [5].
Concerning the Inner Vessel, the DpA values exceed the imposed design limits (2 DpA): the DpA values are greater than 2 after 20 years in the IV region located between 240 and 280 cm from its bottom and after 40 years the affected length starts from about 160 cm measured from the bottom of the vessel up to 340 cm (Figure 19). It should be mentioned that also for the conical part of the tubes connecting the IV with the SGs the DpA values are expected to be higher than the aimed limit because of their position along the affected segment of the IV.
Figure 19. Accumulated DpA in each axial segment (20 cm high) of the IV, starting from the bottom. To reduce the DpA values in the IV it seems necessary to enhance the shielding, either by adding dummy assemblies (even if increasing the IV radius) or by introducing some additional moderator and/or absorber material in the dummy elements belonging to the outermost ring.
No concern emerges from the evaluation of the radiation damage in the reactor tank and the SGs, thanks to their distance from the core.
Concerning the evaluation of the lead activation, a weight compositions similar to C00 lead brand (99.9985% of Pb purity) foreseen for the BREST reactor was initially assumed, considering only the intrinsic impurities in the computations.
The neutron flux, the activation and the doses have been calculated (by means of MCNPX and FISPACT ) for the whole inventory of lead (about 3400 t) in the primary circuit.. The total specific lead activity after 40 years of continuous irradiation is of 5.2·1010 Bq/kg. It should be noted that at the end of this interval the contributions of alpha radiation as well as beta disintegration are of the order of 1.0·106 Bq/kg and 1.0·1010 Bq/kg respectively, and should be taken into account with respect to personnel radioprotection. The production of
210
Po depends on the assumed intrinsic impurities of the lead: ~ 0.03 g of 210Po with Bi weight impurity of 0.0001% (as for C00 brand). This suggests the possibility to consider more relaxed purity requirement for the coolant, so that a much cheaper lead could be used: as a matter of facts, assuming the C1 lead commercial brand (with Bi weight impurity of 0.006%) is adopted instead of the much purer C00, the production of 210Po would be only 0.4 g after 40 y.
Finally, a preliminary analysis has been performed concerning the doses in the proximity of the reactor tank due to the neutron and gamma fluxes during reactor operation, due to the gamma produced by the lead (selecting the most intense gamma source after several steps of continuous irradiation) and due to the activity of the impurities removed by the coolant from the fuel claddings, supposing their continuous irradiation for 5 y (their in-pile residence time). The results – shown in Table 5 – present a non-negligible contribution due to the neutron source below the reactor roof, where paths for neutrons streaming seem to be responsible of such a dose rate, suggesting the need for a more careful check of the results for a review of the axial shielding within the Inner Vessel.
Table 5. Doses evaluated in the proximity of the reactor tank due to different sources.
Region Doses [Sv/h] lead activation outside the IV lead activation inside the IV Impurities removed from the cladding neutron flux during operation gamma source during operation Aside the tank support 4.57·10-3 1.10·101 9.20·100 (negligible) (negligible) Below the reactor roof 1.84·10 -3 7.10·100 1.20·101 ~5·100 ~1·100
The neutron flux and gamma dose maps retrieved by MCNP computations are shown in Figure 20.
6. Synoptic table of ALFRED core main parameters
Parameter Unit Values
Thermal power MW 300
PIN
Pellet hollow diameter mm 2.0
Pellet radius mm 4.5
Gap thickness mm 0.15
Clad thickness mm 0.6
Pin diameter mm 10.5
Bottom plug length mm 50
Gas plenum height mm 550
Bottom insulator ZrO2-Y2O3 height mm 10
Active height mm 600
Upper insulator ZrO2-Y2O3 height mm 10
Spring length mm 120
Upper plug length mm 50
FA
Lattice pitch (hexagonal) mm 13.86
Pins per FA - 127
Wrapper thickness mm 4.0
Distance between 2 wrappers mm 5.0
Average coolant velocity m/s ~1.4
CORE
Inner / Outer FAs number - 57 / 114
Cycle length month 12 (=365 efpd)
Number of batches - 5
Inner Vessel radius cm 165
FUEL Pu vector 238Pu atom % 2.348 239Pu 57.015 240Pu 26.951 241 Pu 6.069 242Pu 7.616 U vector 234U atom % 0.003 235U 0.409 236U 0.010 238U 99.578
Inner / Outer enrichment
(Pu+241Am) / (Pu+241Am+U) atom% 21.7% / 27.8% Mass inventory of actinides:
BOL - U / Pu / Minor Actinides BOC - U / Pu / Minor Actinides EOC - U / Pu / Minor Actinides
tons 5.42 / 1.87 / 0.024 5.27 / 1.78 / 0.038 5.19 / 1.74 / 0.043
7. Conclusions and recommendations
A preliminary configuration has been established for the 300 MWth ALFRED core.
The design has been set up in order to respect the main core requirements, including the temperature limits for the cladding and the fuel in nominal and ULOF conditions.
Despite the encouraging preliminary results of the thermal-hydraulic and safety analyses, the respect of these limits needs to be confirmed by more detailed studies.
Some recommendations for future analyses:
an assessment of the FA design in the active region is envisaged to cope with the need for reducing the peak cladding temperature and its circumferential distribution in the corner fuel pins (e.g.: increasing the distance between the outermost ring of fuel pins and the wrapper);
uncertainties on the results should also be investigated, in particular those due to some specific input data origin and to different cross-section libraries, and propagated in the analysis of hot spots in the core; this could help also in understanding suitable design margins to some limiting temperatures (e.g., 550 °C on the cladding), which are mandatory for the demonstation aim of ALFRED;
more detailed neutronic analyses (e.g.: thermal expansions should be evalutaed also by MCNPX) are envisaged to improve the reference configuration, in particular whether the latter has been adjusted taking into account possible feedbacks coming from T/H and safety verifications;
the dpa on the inner vessel after 40 years (4.6 dpa) are above the design limit of 2 dpa. It is necessary to investigate corrective measures for overcoming this issue;
while many parameters have been checked by 2 independent codes (MCNPX and ERANOS) by ENEA and CEA, the reactivity coefficients have been calculated only by ERANOS by CEA. An independent check, together with some uncertainty considerations, would be recommended;
the safety requirements for the control and safety systems have to be verified, together with an evaluation of the evolution of their performances with irradiation. Furthermore, a cross-check with the results of safety analyses should provide the required insertion time, which has to be guaranteed by the detailed mechanical design of the control and safety systems;
further detailed analyses are envisaged for defining the purity level required for the coolant in order to guarantee an acceptable and manageable production of pollutants (in particular 210Po); then, more precise evaluations on the amount of impurities removed from the internals by corrosion – taking also into account their activation – are required to assess the source term for radioprotection point of view;
an enlargement of the cross-section of the FA spike is envisaged, the current design implying pressure losses almost comparable to the ones in the pins bundle.
References
1. Lead-cooled European Advanced DEmonstration Reactor (LEADER) – Annex I “Description of Work”, rev. 0. Grant agreement no. FP7-249668, May 2010.
2. Sustainable Nuclear Energy Technology Platform. Strategic Research and Innovation
Agenda. March 2013.
3. C. Petrovich et al. Definition of the ETDR core and neutronic characterization. LEADER DEL007-2012, rev. 1, LEADER project, March 2013.
4. K. Mikityuk et al. Thermal-hydraulic assessment of the ETDR core. LEADER DOC056-2012, rev. 0, LEADER project, March 2013.
5. D. Gugiu and C. Petrovich. ETDR core: DPA rates in the main components, activation,
doses. LEADER TEC061-2012, rev.0, LEADER project, January 2013.
6. F. Manni and D. Vitale Di Maio. Mechanical design and drawings of ETDR pin/assembly
core. LEADER DOC-054, rev. 0, LEADER project, June 2012.
7. D. De Bruyn. Short minutes of the Joint WP1-WP2-WP3 meeting FP7 LEADER, 6 May
2010, Bologna. LEADER MIN104-2010, rev. 0, June 2010.
8. G. Grasso et al. A core design approach aimed at the sustainability and intrinsic safety of
the European Lead-cooled Fast Reactor. International conference of Fast Reactors and
related fuel cycles (FR13), Paris, France, 2013.
9. A. Woaye Hune. AREVA fuel fabrication capabilities: minimum allowable pin diameter
and maximum fuel Pu enrichment. CDT-FASTEF project meeting, Brussels, 2009.
10. W. Maschek et al. SIMMER-III and SIMMER-IV safety code development for reactors with
transmutation capability. International conference on Mathematics and Computation,
Supercomputing, Reactor Physics and Biological Applications (M&C 2005), Avignon, France, 2005. Contributed paper (CD-ROM).
11. D. Lamberts (SCKCEN/PSD), Control rods and safety rods, LEADER project meeting, Bologna, 25th October 2011.
12. D.B. Pelowitz et al. MCNPX 2.7.E Extension. Technical Report LA-UR-11-01502, Los Alamos, March 2011.
13. G. Rimpault. The ERANOS code and data system for fast reactor neutronic analyses. International conference on the PHYSics Of Reactors (PHYSOR2002), Seoul, Korea, 2002. 14. A. Koning et al. The JEFF-3.1 Nuclear Data Library, JEFF Report 21, NEA No. 6190,
ISBN 92-64-02314-3, OECD 2006.
15. M.J. Norgett, M.T. Robinson, I.M. Torrens, A Proposed Method of Calculating