Autore:
Fulvio Terzuoli ______________________
Relatori:
Prof. Francesco D’Auria ____________________ Prof. Walter Ambrosini ____________________ Dr. Fabio Moretti ____________________
ROLE OF CFD ANALYSIS IN NUCLEAR
REACTOR LICENSING AND DESIGN
Anno 2011
Scuola di Dottorato in Ingegneria “Leonardo da Vinci”
Corso di Dottorato di Ricerca in
INGEGNERIA NUCLEARE/SICUREZZA NUCLEARE E
INDUSTRIALE
AKNOWLEDGMENTS
At first, I express my gratitude to Prof. Francesco D’Auria (UNIPI-GRNSPG), for the invaluable possibility he gave me to learn and for the huge contribution to my scientific and professional growth.
I‟d like to acknowledge Oscar Mazzantini (NA-SA), for the invaluable possibility of learning from a real nuclear power plant under construction, and for the fantastic periods I spent in Argentina.
I express special thanks to my CFD colleagues at the GRNSPG: Fabio Moretti, Daniele Melideo, Maria Cristina Galassi and Lorenzo Mengali, for the always helpful discussions and much valuable availability.
ABSTRACT
Computational Fluid Dynamics (CFD) is a well-established industrial design tool for non-nuclear applications, helping to reduce design time scales and to improve processes throughout the engineering world, providing a cost-effective and accurate alternative to scale model testing.
Within the Nuclear Reactor Safety (NRS) framework, the traditionally adopted tools for safety analysis evaluation (i.e. integral thermal-hydraulic codes) are not capable of predicting the effect of inherently three-dimensional flow fields and mixing phenomena in complex geometries, therefore the application of CFD technique is considered to potentially bring real benefits in terms of deeper understanding of involved phenomena and of increased safety.
However, CFD tools are not yet considered mature enough to be applied to the wide spectrum of nuclear safety related issues, hence further code assessment is still necessary. Nevertheless, the intensive code development and assessment work carried out in recent years and the dramatic increase in computing power are quite promising, and CFD already plays an important role as a support tool for NRS analyses involving single-phase flows.
In this framework, the present thesis provides a contribution to the definition of the possible current role and the future perspectives of the application of CFD tools to NRS problems within both licensing and design frameworks.
In particular, the present research activity focused on the implementation of CFD technique within a best estimate methodology to address the licensing analyses of a Nuclear Power Plant (NPP), namely the analysis of the Double Ended Guillotine Break Loss Of Coolant Accident (DEGB-LOCA) scenario of the Atucha-II NPP, which is included into the Chapter 15 of its Final Safety Analysis Report (FSAR). The adopted methodology involves the coupled application of best estimate thermal-hydraulic, neutron physics and fuel pin performance computer codes, together with the evaluation of the related uncertainties. A systematic and integrated application of CFD techniques to NRS analyses for licensing purposes is presented, able to go beyond state-of-the-art approaches in this field of application. The present research is also contributing to the assessment of CFD codes in their application to problems related to nuclear safety and technology, in particular for the predictive analysis of in-vessel flows and of the related transport and mixing phenomena, as well as the evaluation of concentrated pressure losses in complex geometries.
SOMMARIO
Le tecniche di Fluidodinamica Computazionale (CFD) sono uno strumento il cui utilizzo si è ormai consolidato nelle applicazioni in campo convenzionale, in particolare grazie alla loro capacità di ridurre i tempi di progettazione per un ampio spettro di applicazioni industriali, offrendo inoltre l‟opportunità di ridurre i costi connessi allo sviluppo di campagne sperimentali.
Nel campo delle analisi di sicurezza per i reattori nucleari, gli strumenti tradizionalmente utilizzati (codici di termoidraulica di sistema) non offrono sufficienti capacità predittive se applicati alle analisi di flussi intrinsecamente tridimensionali o a fenomeni di miscelamento all‟interno di strutture a geometria complessa. In questo specifico campo di applicazione, l‟utilizzo di tecniche CFD potrebbe potenzialmente apportare rilevanti benefici in termini di comprensione approfondita dei fenomeni fisici coinvolti, con dirette ricadute benefiche sui livelli di sicurezza raggiungibili.
Tuttavia, gli strumenti CFD non sono attualmente considerati sufficientemente maturi per la loro applicazione a problemi legati alla sicurezza degli impianti nucleari a causa del loro processo di qualifica, considerato ancora incompleto. Nonostante ciò, lo sviluppo intensivo dei codici CFD ed i vari studi di qualifica completati negli ultimi anni, insieme all‟esponenziale incremento delle potenze di calcolo disponibili, alimentano aspettative crescenti. Inoltre non è trascurabile il fatto che la CFD già attualmente svolga un ruolo importante come strumento di supporto per le analisi di sicurezza nucleare di flussi monofase.
In questo ambito, il presente lavoro di Tesi fornisce un contributo alla definizione del possibile ruolo attuale e delle prospettive future sull‟uso di strumenti CFD nel campo del licensing e della progettazione di impianti nucleari.
In particolare, la presente attività di ricerca è focalizzata sull‟implementazione delle tecniche CFD all‟interno di una metodologia “best estimate” atta ad affrontare le analisi di sicurezza inserite nel processo di licensing di un impianto nucleare; nello specifico è stata affrontata l‟analisi dello scenario incidentale Double Ended Guillotine Break Loss Of Coolant Accident (DEGB-LOCA) riguardante la centrale nucleare Atucha-II, analisi che è inclusa nel Capitolo 15 del Final Safety Analysis Report (FSAR) dell‟impianto.
La metodologia adottata implica l‟applicazione accoppiata di codici “best estimate” di termoidraulica, cinetica neutronica e analisi del combustibile, combinata con la valutazione delle relative incertezze. Nella presente Tesi è presentata un‟applicazione sistematica ed integrata di tecniche CFD ad analisi di sicurezza di un reattore nucleare, capace di andare oltre gli approcci allo stato dell‟arte adottati in questo campo di applicazione.
Infine, la presente attività di ricerca fornisce un contributo al processo di qualifica dei codici CFD per la loro applicazione a problemi relativi alla tecnologia ed alla sicurezza nucleare; in particolare per l‟applicazione ad analisi predittive di campi di moto interni al reattore ed ai relativi fenomeni di trasporto e miscelamento, così come per la valutazione di perdite di carico concentrate in strutture a geometria complessa.
INDEX
AKNOWLEDGMENTS ... 2 ABSTRACT ... 3 SOMMARIO ... 4 INDEX ... 5 ABBREVIATIONS ... 11 LIST OF FIGURES ... 13 LIST OF TABLES ... 21 1. INTRODUCTION ... 23 1.1 INTERNATIONAL FRAMEWORK ... 241.2 STRUCTURE OF THE DOCUMENT ... 26
2. THE ROLE OF CFD CODES IN NUCLEAR REACTOR SAFETY ANALYSES . ... 29
2.1 INTRODUCTION TO CFDTECHNIQUES... 29
2.2 IDENTIFICATION OF NRSISSUES REQUIRING CFD ... 31
2.3 RELEVANCE OF IN-VESSEL FLOW INVESTIGATION TO NRS ... 32
2.3.1 Boron Dilution Transients ... 32
2.3.2 Overcooling Transients ... 33
2.4 STATE-OF-THE-ART IN CFDQUALITY ASSURANCE ... 33
3. DESCRIPTION OF CNA-2 LAYOUT AND MAIN SYSTEMS... 37
3.1 LAYOUT ... 37
3.2 PRIMARY SYSTEM ... 37
3.2.1 Reactor System (JA) ... 37
3.2.2 Reactor Coolant System (JF)... 40
3.2.3 Reactor Moderator System ... 42
3.2.4 Steam Generators and Main Pumps ... 43
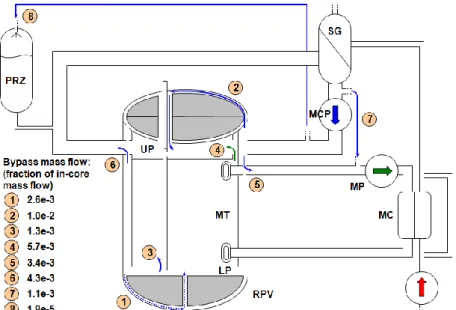
3.2.5 Bypass Flows in the Primary System ... 44
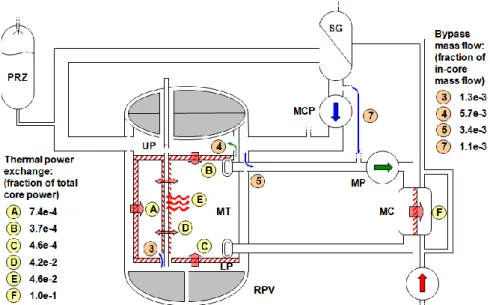
3.2.6 Thermal Power Exchange from Coolant to Moderator ... 44
3.2.7 Residual Heat Removal (KAG) and Safety Injection System (JND) ... 45
3.2.8 Boron Injection System (JDJ) ... 47
3.2.9 Pressurizing Spray Systems ... 48
3.2.10 Volume Control System (KBA) ... 48
3.3 SECONDARY SYSTEM ... 49
3.3.1 Main Steam Line (LBA) ... 50
3.3.2 Condenser and Condensing System (MAG) ... 51
3.3.3 By pass System (MAN) ... 52
3.3.4 Feedwater Line (LAB) ... 52
3.4 DESCRIPTION OF CNA2RPV AND ITS INTERNALS ... 53
3.4.1 Reactor Pressure Vessel ... 54
3.4.2 Lower/Upper Filler ... 55
3.4.4 Moderator Tank Closure Head ... 59
3.4.5 Moderator Inlet/Outlet System ... 60
3.4.6 Core Coolant Channels ... 61
3.4.7 Boron Injection Lances ... 63
3.5 FUEL MANAGEMENT ... 64
4. 2A-LOCA SCENARIO IN ATUCHA-II NPP ... 67
4.1 PHENOMENOLOGICAL WINDOWS ... 67
4.1.1 I Ph.W. – Fission Power Excursion (RIA) ... 67
4.1.2 II Ph.W. – CHF Occurrence & Clad Temperature Excursion ... 68
4.1.3 III Ph.W. – Quenching & Fuel Channels Refill ... 68
4.1.4 IV Ph.W. – Long Term Cooling ... 68
4.2 KEY ASPECTS OF CNA-2RELEVANT TO LB-LOCA ... 69
4.2.1 Primary system components ... 69
4.2.2 Primary system parameters ... 70
4.3 LICENSINGFRAMEWORK ... 72
4.3.1 The Regulatory Framework ... 72
4.3.2 The International Practice ... 72
4.3.3 The ARN Requirements and the Current Status of the Licensing Process.... 73
4.4 THE BEPUAPPROACH ... 74
4.5 CODE CHAINS AND COUPLING FOR CNA-2FSARANALYSES ... 75
4.6 INTEGRATED CODE STRATEGY TO HANDLE THE 2A-LOCASCENARIO: THE ROLE OF CFD ... 75
4.7 DESCRIPTION OF THE INVOLVED CODES ... 78
4.7.1 Thermal-Hydraulic System Code ... 78
4.7.2 3D NK-TH Coupled Code ... 79
4.7.3 Computational Fluid-Dynamics Code ... 84
4.7.3.1 The ANSYS CFX CFD Code ... 84
4.7.3.1.1 Qualification Level ... 85
4.7.3.1.2 Equations Solved ... 86
4.7.3.1.3 Discretization ... 87
4.7.3.2 The ANSYS ICEM-CFD Meshing Tool ... 88
4.7.3.3 Meshing Strategy and Approach ... 89
4.7.4 Fuel Behavior Code: TRANSURANUS ... 90
4.8 DESCRIPTION OF THE NODALIZATIONS ... 91
4.8.1 Thermal-Hydraulic Nodalizations ... 91
4.8.1.1 NASA 36 Core Channels ... 92
4.8.1.2 UNIPI 280 Core Channels ... 92
4.8.1.3 UNIPI 60 Core Channels Modeling ... 95
4.8.2 Neutron-Kinetics Nodalization ... 96
5. CFD ASSESSMENT OF COOLANT IN-VESSEL FLOW IN STEADY-STATE NOMINAL CONDITIONS ... 97
5.1 INVESTIGATION OF DC AND LPFLOW FIELD AND MIXING ... 97
5.1.1 Development of DC and LP Computational Grids ... 97
5.1.1.1 Identification of the Computational Domain ... 97
5.1.1.2 Development of the Reference Grid ... 99
5.1.1.2.1 Nozzle Region ... 100
5.1.1.2.2 Downcomer Region ... 100
5.1.1.2.4 Lower Plenum ... 101
5.1.1.2.5 Channel Inlets ... 102
5.1.1.2.6 Outlet Volume ... 102
5.1.1.2.7 Assemblage of the Reference Grid ... 102
5.1.1.3 Auxiliary Grids ... 104
5.1.2 Set-up of Steady-state Simulations of Lower Plenum Flow ... 105
5.1.2.1 General Modeling Choices ... 105
5.1.2.2 Boundary Conditions ... 106
5.1.2.3 Assessment of Coolant Channel Pressure Losses ... 107
5.1.2.4 Performed Calculations and Sensitivity Analyses ... 110
5.1.2.5 Convergence Criteria ... 111
5.1.3 Results of Steady-state Simulations of Lower Plenum Flow ... 112
5.1.3.1 Results of Reference Calculation ... 112
5.1.3.1.1 Velocity Field ... 112
5.1.3.1.2 Flow Distribution through the Coolant Channels ... 113
5.1.3.1.3 Pressure Field ... 114
5.1.3.1.4 Massflow Exchange between the Boxes... 115
5.1.3.1.5 DC Flow Rotation ... 117
5.1.3.2 Results of Sensitivity Calculations... 117
5.1.3.2.1 Flow Distribution through the Coolant Channels ... 118
5.1.3.2.2 DC Flow Rotation ... 118
5.1.3.2.3 Massflow Exchange between the Boxes... 120
5.1.4 Additional Investigation of Downcomer Flow Rotation ... 121
5.1.4.1 Experimental Evidence ... 121
5.1.4.2 Additional Computational Grids ... 122
5.1.4.3 Results from Additional Calculations ... 124
5.1.5 Conclusions on the Investigation of DC and LP Flow Field and Mixing ... 126
5.2 INVESTIGATION OF UPFLOW FIELD AND MIXING... 128
5.2.1 Development of UP Computational Grids ... 128
5.2.1.1 Identification of the Computational Domain ... 128
5.2.1.2 Development of the Reference Grid ... 130
5.2.1.3 Auxiliary Grids ... 130
5.2.2 Set-up of Steady-state Simulations of Upper Plenum Flow ... 131
5.2.2.1 General Modeling Choices ... 131
5.2.2.2 Boundary Conditions ... 131
5.2.2.3 Performed Calculations and Sensitivity Analyses ... 132
5.2.3 Results of Steady-state Simulations of Upper Plenum Flow ... 132
5.2.3.1 Results of Reference Calculation ... 132
5.2.3.2 Results of Sensitivity Calculations... 134
5.2.4 Conclusions on the Investigation of UP Flow Field and Mixing... 134
5.3 ASSESSMENT OF CORE PRESSURE LOSSES ... 135
5.3.1 Calculation of Pressure Drops through the Inlet of Coolant Channels ... 135
5.3.1.1 Description of the Coolant Channel Inlet ... 135
5.3.1.2 Development of CFD Models for the Coolant Channel Inlet ... 135
5.3.1.2.1 Identification of the Computational Domain ... 135
5.3.1.2.2 Development of 3D CAD Models ... 137
5.3.1.2.3 Development of Computational Grids ... 138
5.3.1.3 Set-up of Steady-state Simulations of Channel Inlet Flows ... 140
5.3.1.3.1 General Modeling Choices ... 140
5.3.1.3.2 Boundary Conditions ... 141
5.3.1.3.3 Performed Calculations and Sensitivity Analyses ... 142
5.3.1.4.2 Pressure Losses ... 145
5.3.1.4.3 Sensitivity Analyses ... 147
5.3.1.5 Conclusions on Pressure Loss Calculation of Channel Inlet ... 151
5.3.2 Calculation of Pressure Drops through the Outlet of Coolant Channels ... 152
5.3.2.1 Description of the Coolant Channel Outlet ... 152
5.3.2.2 Development of CFD Models for the Coolant Channel Outlet ... 154
5.3.2.2.1 Identification of the Computational Domain ... 154
5.3.2.2.2 Development of 3D CAD Models ... 155
5.3.2.2.3 Development of Computational Grids ... 156
5.3.2.3 Set-up of Steady-state Simulations of Channel Outlet Flows ... 156
5.3.2.3.1 General Modeling Choices ... 156
5.3.2.3.2 Boundary Conditions ... 157
5.3.2.3.3 Performed Calculations and Sensitivity Analyses ... 158
5.3.2.4 Obtained CFD Results ... 159
5.3.2.4.1 Velocity and Pressure Fields ... 159
5.3.2.4.2 Pressure Losses ... 159
5.3.2.4.3 Sensitivity Analyses ... 161
5.3.2.5 Conclusions on Pressure Loss Calculation of Channel Outlet ... 162
5.3.3 Assessment of Pressure Drops through the FA Spacer Grids and Qualification against Experimental Data ... 163
5.3.3.1 Description of the FA Spacer Grids ... 163
5.3.3.1.1 The Elastic Spacer Design (KWU) ... 163
5.3.3.1.2 The Rigid Spacer Design (IEC) ... 164
5.3.3.2 Experimental Data ... 165
5.3.3.3 Development of CFD Models for the KWU Spacer Grids ... 166
5.3.3.3.1 Identification of the Computational Domain ... 166
5.3.3.3.2 Development of 3D CAD Models ... 167
5.3.3.3.3 Development of Computational Grids ... 168
5.3.3.4 Set-up of Steady-state Simulations of KWU Spacer Grid Flow ... 168
5.3.3.4.1 General Modeling Choices ... 168
5.3.3.4.2 Boundary Conditions ... 169
5.3.3.4.3 Performed Calculations and Sensitivity Analyses ... 170
5.3.3.5 KWU Spacer Grid: Obtained Results and Comparison Against Experimental Data ... 170
5.3.3.6 Development of CFD Models for the IEC Spacer Grids ... 171
5.3.3.6.1 Identification of the Computational Domain ... 171
5.3.3.6.2 Development of 3D CAD Models ... 172
5.3.3.6.3 Development of Computational Grids ... 173
5.3.3.7 Set-up of Steady-state Simulations of IEC Spacer Grid Flow ... 173
5.3.3.7.1 General Modeling Choices ... 173
5.3.3.7.2 Boundary Conditions ... 174
5.3.3.7.3 Performed Calculations and Sensitivity Analyses ... 174
5.3.3.8 IEC Spacer Grid: Obtained Results and Comparison Against Experimental Data .... ... 175
5.3.3.9 Design Optimization Studies ... 177
5.3.3.10 Conclusions on Pressure Loss Calculation of FA Spacer Grids ... 178
5.4 DEVELOPMENT OF A GLOBAL RPVMODEL ... 179
5.4.1 Identification of the Computational Domain ... 179
5.4.2 Development of RPV Computational Grid ... 180
5.4.3 Set-up of CFD Simulations ... 182
5.4.3.1 General Modeling Choices ... 182
5.4.3.2 Boundary Conditions ... 182
5.4.3.4 Heat Flux ... 183
5.4.3.5 Performed Calculations ... 184
5.4.4 Obtained CFD Results for the Global RPV Model ... 184
5.4.5 Conclusions on Global RPV Model ... 189
6. CFD ANALYSES OF THE FAST BORON INJECTION SYSTEM INTERVENTION DURING A LBLOCA SCENARIO ... 191
6.1 DESCRIPTION OF THE BORON INJECTION SYSTEM ... 192
6.2 ASSESSMENT OF MTFLOW FIELD AND MIXING IN STEADY-STATE NORMAL OPERATION ... 196
6.2.1 Development of MT Computational Grids ... 196
6.2.1.1 Identification of the Computational Domain ... 196
6.2.1.2 Development of Reference Grid ... 199
6.2.1.3 Auxiliary Grids ... 200
6.2.2 Set-up of Steady-state Simulations of Moderator Flow ... 201
6.2.2.1 General Modeling Choices ... 201
6.2.2.2 Boundary Conditions ... 201
6.2.2.3 Performed Calculations and Sensitivity Analyses ... 202
6.2.3 Results of Steady-state Simulations of Moderator Flow ... 203
6.2.3.1 Results of Reference Calculation ... 203
6.2.3.2 Results of Sensitivity Analyses ... 204
6.2.3.3 Results of Additional Analyses ... 206
6.2.4 Conclusions on the Investigation of MT Flow Field and Mixing ... 207
6.3 ASSESSMENT OF THE PRESSURE LOSSES AFFECTING THE FBISYSTEM INTERVENTION ... 209
6.3.1 Assessment of Pressure Drops through the Rupture Disk Device and Comparison against Experimental Data ... 209
6.3.1.1 Description of the Rupture Disk Device ... 209
6.3.1.2 Development of CFD Models for the Rupture Disk ... 210
6.3.1.2.1 Identification of the Computational Domain ... 210
6.3.1.2.2 Development of 3D CAD Models ... 211
6.3.1.2.3 Development of Computational Grids ... 212
6.3.1.3 Set-up of Steady-state Simulations of Rupture Disk Flows ... 213
6.3.1.3.1 General Modeling Choices ... 213
6.3.1.3.2 Boundary Conditions ... 214
6.3.1.3.3 Performed Calculations and Sensitivity Analyses ... 214
6.3.1.4 Obtained CFD Results ... 216
6.3.1.4.1 Velocity and Pressure Fields ... 216
6.3.1.4.2 Pressure Losses ... 217
6.3.1.4.3 Sensitivity Analyses ... 219
6.3.1.5 Validation against Experimental Data from Atucha-I Rupture Disk ... 220
6.3.1.5.1 Experimental Test and Available Data ... 220
6.3.1.5.2 Lack of Information and Related Assumptions ... 222
6.3.1.5.3 Development of CFD Models for CNA-I Rupture Disk ... 222
6.3.1.5.4 Set-up of Steady-state Simulations for CNA-I Rupture Disk ... 223
6.3.1.5.5 Obtained CFD Results ... 225
6.3.1.5.6 Comparison against Experimental Data ... 228
6.3.1.6 Conclusions on Pressure Loss Calculation of Rupture Disk ... 230
6.3.2 Calculation of the Pressure Losses through the Injection Lance ... 231
6.3.2.1 Description of the Injection Lance ... 231
6.3.2.2 Development of CFD Models for the Injection Lance ... 231
6.3.2.2.2 Development of 3D CAD Models ... 232
6.3.2.2.3 Development of Computational Grids ... 232
6.3.2.3 Set-up of CFD Simulations of Injection Lance Flows ... 235
6.3.2.3.1 General Modeling Choices ... 235
6.3.2.3.2 Boundary Conditions ... 236
6.3.2.3.3 Performed Calculations and Sensitivity Analyses ... 236
6.3.2.4 Obtained CFD Results ... 237
6.3.2.4.1 Velocity and Pressure Fields ... 237
6.3.2.4.2 Pressure Losses and Sensitivity Analyses ... 238
6.3.2.5 Conclusions on Pressure Loss Calculation of Injection Lance ... 240
6.4 RELAP5SIMULATION OF FBISYSTEM INTERVENTION ... 241
6.5 CFDINVESTIGATION OF THE FAST BORON INJECTION SYSTEM INTERVENTION DURING A DEGB-LOCASCENARIO ... 244
6.5.1 Experimental Information on Boron Injection ... 244
6.5.2 CFD Simulation of Boron Injection Experiment ... 248
6.5.2.1 Identification of the Computational Domain ... 248
6.5.2.2 Development of the Computational Grid ... 249
6.5.2.3 Set-up of CFD Simulation ... 249
6.5.2.3.1 General Modeling Choices ... 249
6.5.2.3.2 Initial and Boundary Conditions ... 249
6.5.2.4 CFD Results of the Selected Experiment ... 250
6.5.2.4.1 Convergence Behavior ... 250
6.5.2.5 Comparison against Experimental Data ... 250
6.5.2.6 Conclusions on CFD Simulation of Boron Injection Experiment ... 253
6.5.3 CFD Transient Analyses of Fast Boron Injection during a DEGB-LOCA Scenario ... 254
6.5.3.1 Set-up of the Transient Calculation... 254
6.5.3.1.1 Boron Concentration ... 254
6.5.3.1.2 Numerical Schemes ... 255
6.5.3.1.3 Boundary Conditions ... 255
6.5.3.2 Results of the Transient Calculation ... 256
6.5.3.2.1 Velocity Field ... 257
6.5.3.2.2 Boron Concentration Field ... 259
6.5.3.3 Conclusions on Boron Injection during a DEGB-LOCA Scenario ... 267
6.6 CFD-NKCOUPLING ... 267
6.6.1 Averaging CFD Results over 3D NK Nodalization ... 268
6.6.2 Averaging CFD Results Over 1D NK Nodalization ... 271
6.6.3 Conclusions CFD-NK Coupling ... 273
CONCLUSIONS ... 275
ABBREVIATIONS
BC Boundary Conditions
BDBA Beyond Design Basis Accident BEPU Best Estimate Plus Uncertainties BFBT BWR Full-size Fine-mesh Bundle Tests BPG Best Practice Guidelines
BSLRSM Baseline Reynolds Stress Model BWR Boiling Water Reactor
CAD Computer Aided Design
CC Coolant Channel
CFD Computational Fluid Dynamics CHF Critical Heat Flux
CL Cold Leg
CNA-1 Central Nuclear Atucha-I (Nuclear Power Plant Atucha-I) CNA-2 Central Nuclear Atucha-II (Nuclear Power Plant Atucha-II)
CR Control Rod
CSNI Committee on the Safety of Nuclear installation DBA Design Basis Accident
DC Down Comer
DEGB Double Ended Guillotine DES Detached Eddy Simulation
DIMNP Department of Mechanics, Nuclear and Production Engineering DNB Departure from Nucleate Boiling
DNS Direct Numerical Simulation ECCS Emergency Core Cooling System
ENACE Nuclear Argentine Company for Electrical Power Generation
EU European Union
FA Fuel Assembly
FBI Fast Boron Injection FEM Finite Element Method FSAR Final Safety Analysis Report
FZD-R Forschungszentrum Dresden – Rossendorf GGI General Grid Interface
GPMF Gidropress Mixing Facility
GRNSPG Gruppo di Ricerca Nucleare San Piero a Grado
HL Hot Leg
HR High Resolution
HZ Hydraulic Zone
IAEA International Atomic Energy Agency
IVF In-Vessel Flow
KWU Kraftwerk Union AG
LB-LOCA Large Break LOCA LES Large Eddy Simulation LOCA Loss Of Coolant Accident
LP Lower Plenum
LWR Light Water Reactor
NK Neutron Kinetic
MSLB Main Steam Line Break MS-IV Main Steam Isolation Valve
MS-IVUSV Isolation Valve Upstream of Main Steam Safety Salve MS-PRIV Main Steam Pressure Relief Isolation Valve
MS-SV Main Steam Safety Valve
MT Moderator Tank
NA-SA Nucleoélectrica Argentina – Sociedad Anonima NEA Nuclear Energy Agency
NPP Nuclear Power Plant
NRC Nuclear Regulatory Commission NRS Nuclear Reactor Safety
OECD Organization for the Economic Cooperation and Development PCT Peak Cladding Temperature
Ph.W. Phenomenological Window PHWR Pressurized Heavy Water Reactor
PIRT Phenomena Identification and Ranking Table PCI Pellet Cladding Interaction
PSU Pennsylvania State University PTS Pressurised Thermal Shock PWR Pressurized Water Reactor
RANS Reynolds Average Navier Stokes (equations) RCS Reactor Coolant System
RDD Rupture Disk Device RHR Residual Heat Removal RIA Reactivity-Initiated Accident
RMS Root Mean Square
ROCOM Rossendorf Coolant Mixing (facility) RPV Reactor Pressure Vessel
RT Reinforcing Tube
SBDBA Selected Beyond Design Basis Accidents
SG Steam Generator
SST Shear Stress Transport
TACIS Technical Assistance to the Commonwealth of the Independent States
TH-SYS Thermal-Hydraulics System (codes) UNIPI University of Pisa
UP Upper Plenum
LIST OF FIGURES
Fig. 1 – Reactor Pressure Vessel (RPV). ... 40
Fig. 2 – Fuel Assembly: drawing (a) and cross-section (b). ... 40
Fig. 3 – Reactor coolant piping and pressurizing systems. ... 41
Fig. 4 – Reactor coolant system: logical layout. ... 42
Fig. 5 – Moderator system layout. ... 43
Fig. 6 – Bypass flow paths in primary system, and relative mass flowrate. ... 44
Fig. 7 – Coolant to moderator thermal power exchange, and relative
amount... 45
Fig. 8 – Primary system in normal operation. ... 46
Fig. 9 – Primary system in RHR configuration. ... 46
Fig. 10 – ECC configuration. ... 47
Fig. 11 – Layout of a line of the Fast Boron Injection system. ... 48
Fig. 12 – Simplified overview of secondary side and thermal balance. ... 50
Fig. 13 – RPV vertical cross section. ... 53
Fig. 14 – Penetrations on the RPV belt line. ... 54
Fig. 15 – Penetrations on the RPV closure head... 55
Fig. 16 – Lower filler. ... 56
Fig. 17 – Upper filler. ... 56
Fig. 18 – NA-SA CAD model of the Moderator Tank (with closure head). ... 57
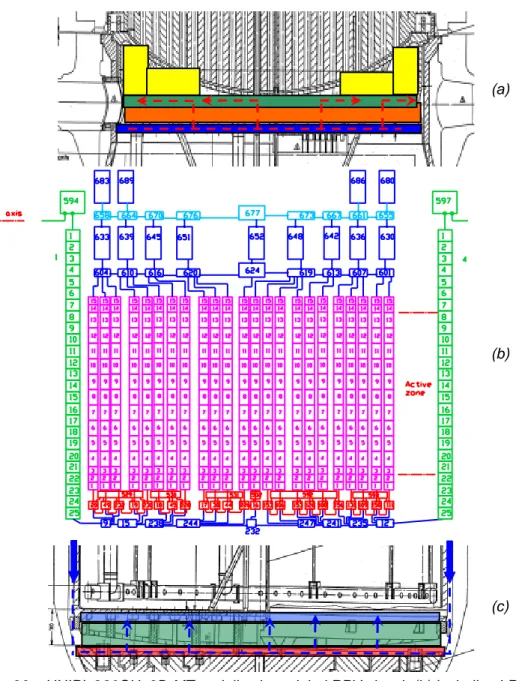
Fig. 19 – Grid structure at MT bottom: NA-SA CAD model (a) and drawing
(b). ... 58
Fig. 20 – Pictures of the MT grid structure. ... 58
Fig. 21 – MT closure head (red dotted line). ... 59
Fig. 22 – MT closure head reinforcing tubes. ... 60
Fig. 23 – Moderator inlet/outlet system. ... 60
Fig. 24 – Coolant channel inlet: cross-section (a) and CAD representation
(b). ... 61
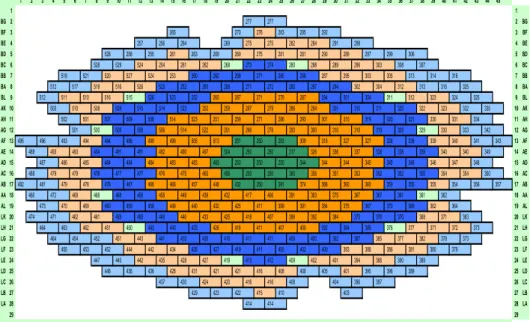
Fig. 25 – Core subdivision in hydraulic zones. ... 62
Fig. 26 – Layout of boron injection lances. ... 63
Fig. 27 – Details of the boron lance (CAD model)... 64
Fig. 28 – Fuel burnup zones. ... 65
Fig. 29 – Definition of the LBLOCA phenomenological windows. ... 68
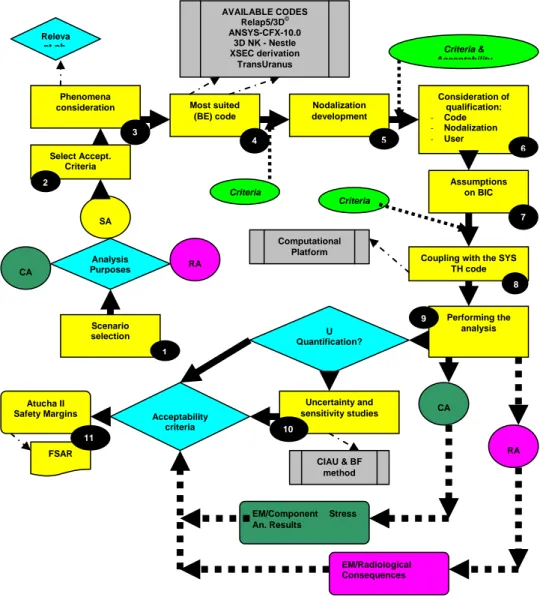
Fig. 30 – Simplified flowchart for the BEPU approach adopted for Atucha II
FSAR accident analysis. ... 74
Fig. 31 – Description of the interaction between the codes. ... 75
Fig. 32 – Description of the interaction between the codes. ... 77
Fig. 33. Types of elements. ... 87
Fig. 34. Definition of finite control volumes from nodes and elements (2D
example). ... 88
Fig. 35 – UNIPI_280CH_3D-MT nodalization: core channel and connected
geometrical relevant positions. ... 93
Fig. 36 – UNIPI_280CH_3D-MT nodalization: global RPV sketch (b)
including LP (c) and UP (a) conceptual discretizations based
on preliminary CFD results. ... 94
Fig. 37 – UNIPI_280CH_3D-MT nodalization: the moderator tank 3D
model, front and top view, developed to use CFD boron results. ... 95
Fig. 38 – RELAP5-3D© TH-NK coupling map for the fuel channels. ... 96
Fig. 39 – Selected computational domain (cold legs not shown): 2D cross
section (a) and 3D view of the solid model prior to meshing (b). ... 98
Fig. 40 – Geometrical model: grid structure at the bottom of the MT (a);
simplified channel inlets (b) and dummy outlet volume (c) ... 99
Fig. 41 – “Nozzle Region” sub-domain: block-structure (a) and resulting
mesh (b). ... 100
Fig. 42 – “Downcomer Region” sub-domain: extrusion (a) and detail of
node radial distribution across the DC gap (b). ... 100
Fig. 43 – “Cold Legs” sub-domain: extrusion (a) and resulting mesh (b). ... 101
Fig. 44 – “Lower Plenum” sub-domain: mesh (a) and detail of grid
structure and inlet of channels (b). ... 101
Fig. 45 – “Channels Inlet” sub-domain: lower part (violet), upper part
(green) and extrusion (red arrow) ... 102
Fig. 46 – “Outlet Volume” sub-domain: adopted grid ... 102
Fig. 47 – Reference grid A1: vertical cross-section (a), detail of element
distribution in the downcomer (b) and in the channel inlets
region (c). ... 103
Fig. 48 – Grid A2: same as A1, without Cold Legs ... 104
Fig. 49 – Grid A3: same as A1, without Cold Legs and Downcomer
penetrations ... 104
Fig. 50 – Grid A4: same as A1, with double outlet volume ... 104
Fig. 51 – Grid A5: same as A1, with double grid-lower filler gap ... 104
Fig. 52 – Grid A6: same as A1, coarsened. ... 105
Fig. 53 – Identification of inlet (blue) and outlet (red) boundaries. ... 107
Fig. 54 − Hydraulic zones. ... 108
Fig. 55 – CFD modeling of coolant channels. ... 109
Fig. 56 – Achievement of the adopted convergence criteria: momentum and
mass residuals (a) and tracer value at channel inlets (b). ... 111
Fig. 57 – Reference calculation: velocity vectors. ... 112
Fig. 58 – Reference calculation: streamlines from CL1... 113
Fig. 59 – Flow rate distribution over the coolant channels: comparison
against nominal values... 114
Fig. 60 – LP pressure field (horizontal cut of the LP)... 115
Fig. 61 – Numbering criterion for rhomboidal sub-plena and connections. ... 116
Fig. 62 – Counter-clockwise flow rotation: side view (a) and view from the
bottom (b). ... 117
Fig. 63 – Sensitivity calculations: flow rate distribution over the coolant
channels. ... 118
Fig. 64 – The flow rotation effect: results from grids with (a) and without
cold legs (b). ... 119
Fig. 65 – Angular momentum at cold leg nozzles. ... 120
Fig. 66 – Computational grid DC1. ... 122
Fig. 67 – Computational grid DC2. ... 123
Fig. 68 – “Swirl” effect from additional calculations. ... 125
Fig. 69 – Selected computational domain: 2D cross section (a), CAD model
of moderator tank closure head (b), UP model (c). ... 129
Fig. 70 – Selected computational domain: Type I, II and III reinforcing
tubes (a); CFD model of the coolant channels (b). ... 129
Fig. 71 – Reference grid B1: different colors indicate different types of
reinforcing tubes around channels. ... 130
Fig. 72 – Results of UP reference simulation (B1.0): streamlines of velocity
field. ... 133
Fig. 73 – Results of UP reference simulation (B1.0): velocity vectors
projected on a vertical plane. ... 134
Fig. 74 – Assembly drawing of the Coolant Channel Inlet region (throttle not
included). ... 136
Fig. 75 – Example of (a) throttle type “b” and (b) throttle type “c”. ... 137
Fig. 76 – Vertical cross-section of the developed 3D CAD models for each
HZ: HZ1 – throttle type 1b (a), HZ2 – throttle type 2b (b), HZ3
– throttle type 3b (c), HZ4 – throttle type 5c (d), HZ5 – no
throttle (e). ... 138
Fig. 77 – Sub-domains: FA region (a), throttle region (b) and Inlet region
(c). ... 139
Fig. 78 – Identification domain boundaries: solid walls, internal interfaces
(green), inlet (blue) and outlet (red). ... 142
Fig. 79 – Results from the reference calculation of HZ1: 3D streamlines (a)
and pressure field (b). ... 144
Fig. 80 – Results from the reference calculation of HZ4: 3D streamlines (a)
and pressure field (b). ... 145
Fig. 81 – Location of planes for calculating pressure differences: inlet
(a, blue), outlet (d, red) and in-between planes (b and c). ... 146
Fig. 82 – Outlet of Coolant Channel: assembly drawing (a) and detail (b)... 153
Fig. 83 – Reinforcing Tubes: different configurations available (a) and
location in the UP cross-section (b) ... 153
Fig. 84 – Core Hydraulic Zones ... 154
Fig. 85 – Coolant Channel Outlet region: part of FA included in the domain
(a) and assembly drawing including the RT (b) ... 155
Fig. 86 – Developed 3D CAD models for the CC outlet: standard
configuration (a) and with RT included (b), detail of channel
and FA steel supports (c) ... 155
Fig. 87 – Identification of solid walls (grey), inlet (blue) and outlet (red)
boundaries... 157
Fig. 88 – Results from HZ5 calculation of CC outlet in its standard
configuration (Std_HZ5): 3D streamlines (a) and
pressure field (b). ... 159
Fig. 89 – Results from HZ5 calculation of CC outlet with RT included
(RT_HZ5): 3D streamlines (a) and pressure field (b). ... 160
Fig. 90 – The elastic spacer design (KWU). ... 164
Fig. 91 – The rigid spacer design (IEC). ... 164
Fig. 92 – Layout of the experimental facility. ... 165
Fig. 93 – KWU computational domain. ... 166
Fig. 94 – KWU computational domain. ... 167
Fig. 95 – KWU 3D CAD model. ... 167
Fig. 96 – KWU computational grid: external overview (a) and horizontal
cross-section (b). ... 168
Fig. 97 – IEC computational domain: subdivision in Sectors (a) and single
model (b). ... 172
Fig. 98 – IEC 3D CAD model... 172
Fig. 99 – Details of IEC computational grid. ... 173
Fig. 100 – IEC inlet (blue) and outlet (red) surfaces for reference
calculation (short) and sensitivity analysis (long) ... 174
Fig. 101 – IEC design optimization: original (a), chamfer on grid (b),
small (c) and bigger (d) chamfer on grid and “patines”. ... 178
Fig. 102 – Computational domain of RPV. ... 180
Fig. 103 – Grid of sub-domain C: external overview (a) and detail of
superficial elements (b). ... 181
Fig. 104 – Core hydraulic zone, each zone account for a specific wall heat
flux... 184
Fig. 105 – RPV results: 3D streamlines (a) and tracer distribution on the
walls (b). ... 185
Fig. 106 – Tracer distribution on the LP bottom (top) and on a horizontal
cross-section of the UP at nozzle level (bottom) for both
calculations. ... 185
Fig. 107 – Pressure distribution in LP (horizontal cutting plane). ... 186
Fig. 108 – Coolant distribution over the channels: comparison between
PRV-1 and RPV-2 results and the reference case A1.0 (see
Section 5.1.3) ... 187
Fig. 109 – Coolant temperature in the core (RPV-2 case) ... 187
Fig. 110 – Coolant temperature (RPV-2 case): definition of cutting planes
(a), horizontal cross-section at nozzle level (b), plane IN (c) and
plane OUT (d). ... 188
Fig. 111 – Sketch of the boron injection system. ... 193
Fig. 112 – Sketch of boron injection system (downstream of the boron tanks). ... 193
Fig. 113 – Positioning of injection lance in RPV. ... 195
Fig. 115 – Selected computational domain: 2D cross section (a) and
3D view (b). ... 197
Fig. 116 – Boron injection lance: and CFX model. ... 197
Fig. 117 – Computational domain: view of moderator circuit (a);
moderator suction (b) and injection (c) rings, and their
simplified models (d) (e). ... 198
Fig. 118 – Moderator injection: front (a) and top views (b); and simplified
model (c). ... 198
Fig. 119 – Moderator suction: front (a) and top views (b), and simplified
model (c). ... 199
Fig. 120 – Reference grid C1: global view (a), injection lance details (b) and
vertical cross-section through lance axis (c). ... 200
Fig. 121 – Boundary conditions: overview (a), outlet (b) and inlet (c)
boundaries. ... 202
Fig. 122 – Results of reference calculation C1.0: 3D streamlines from inlet
(a) and from bypass (b) ... 203
Fig. 123 – Results of reference calculation C1.0: velocity vectors projected
in a vertical plane (a) and temperature stratification (b) ... 204
Fig. 124 – Velocity vectors on a vertical plane: calculation with larger inlet
area (C01.2) ... 205
Fig. 125 – C01.1 results (no bypass flow): velocity vectors projected in a
vertical plane (a) and temperature stratification (b) ... 206
Fig. 126 – Improved convergence of additional calculation: momentum and
mass (a) and turbulence (b) RMS equation residuals. ... 207
Fig. 127 – Steady-state moderator flow from additional calculations: a)
velocity vectors (a) and temperature profile (a) on a vertical
cross section. ... 207
Fig. 128 – Assembly drawing of the Rupture Disk Device:
1) flange – secondary side, 2) flange – primary side,
5) strainer cylinder, 6) bolt, 12) loose flange. ... 210
Fig. 129 – Rupture Disk Device: D
3BO
3(red)
and D
2O (blue) regions. ... 210
Fig. 130 – 3D solid models of the RDD main components. ... 211
Fig. 131 – Cross-section of the RDD 3D solid model. ... 211
Fig. 132 – Details of the reference grid RD03: strainer cylinder with holes
and caps (a); burst insert (b); zoom of prism layers on
strainer cylinder holes (c). ... 212
Fig. 133 – Identification of walls (grey), inlet (blue) and outlet (red)
boundaries... 214
Fig. 134 – RD05_020 results: 3D streamlines (a) and velocity vectors (b) ... 216
Fig. 135 – Comparison between RD03_020, RD04_020 and RD05_020
results: relative pressure along the central axis (a); relative
pressure along 3D streamlines (b); computational domain (c) ... 217
Fig. 136 – Pressure loss coefficient as function of imposed inlet mass
flowrate. ... 218
Fig. 137 – Experimental Facility. ... 221
Fig. 138 – Experimental Result as a Function of Reynolds Number. ... 221
Fig. 139 – Calculated loss factors as function of Reynolds Number ... 226
Fig. 140 – Single Air Test Results. ... 228
Fig. 141 – Comparison against experimental values at different Reynolds
number. ... 230
Fig. 142 – Computational domain ... 232
Fig. 143 – Injection lance: 3D CAD model subdivided in 3 sections. ... 233
Fig. 144 – Developed Grids: cross section views (a) and detail (b) for the
grids IL.0, IL.1 and IL.3 (from the top). ... 234
Fig. 145 – Effects of mesh adaption algorithm: reference grid IL.1 (a) and
the refined grid IL.2 (b)... 234
Fig. 146 – Velocity field: streamlines. ... 237
Fig. 147 – Velocity field: vectors at lance holes. ... 238
Fig. 148 – Time history of pressure in MT (RELAP5 – UNIPI). ... 241
Fig. 149 – Time history of injection velocity (at flange) and mass flowrate. ... 242
Fig. 150 – Time history of volume of solution injected (and related boron
mass) through the flange ... 243
Fig. 151 – Time history of boron concentration at the flange. ... 243
Fig. 152 – Sketch of the experimental facility. ... 245
Fig. 153 – MT scaled model: vertical cross-section (a) and top view (b) ... 245
Fig. 154 – Photos of the tracer clouds during Experiment #9, at several
selected instants. ... 247
Fig. 155 – Computational domain of the test facility. ... 248
Fig. 156 – Plots of RMS residuals (a) and monitor points(b). ... 250
Fig. 157 – Qualitative comparison against experiment. ... 252
Fig. 158 – Iso-surfaces for different boron concentration. ... 253
Fig. 159 – Boron solution injection flowrate (1 lance) from RELAP
calculation. ... 255
Fig. 160 – Concentration fronts: RELAP result (a) and CFX boundary
condition (b). ... 256
Fig. 161 – Definition of a sharp temperature front as BC for CFX
calculation. ... 256
Fig. 162 – Velocity field: streamlines before (a) and during (b) injection ... 257
Fig. 163 – Plots of velocity vectors on a vertical plane at some selected
instants ... 258
Fig. 164 – 2D contours of boron concentration on a vertical plane passing
by one lance axis. ... 259
Fig. 165 – Iso-surfaces of boron concentration at some selected instants
(7 ppm) ... 260
Fig. 166 – 2D contours of boron concentration on a horizontal plane
(z = 5.44 m). ... 261
Fig. 167 – 2D contours of boron concentration on a horizontal plane
(z = 5 m). ... 262
Fig. 168 – 2D contours of boron concentration on a horizontal plane
(z = 4.47 m). ... 263
Fig. 169 – 2D contours of boron concentration on a horizontal plane
(z = 3.94 m). ... 264
Fig. 170 – 2D contours of boron concentration on a horizontal plane
(z = 3.41 m). ... 265
Fig. 171 – 2D contours of boron concentration on a horizontal plane
(z = 2.88 m). ... 266
Fig. 172 – Sketch of RELAP5-3D nodalization of the MT ... 269
Fig. 173 – Injected mass of boron in some selected volumes of RELAP5-3D
nodalization ... 270
Fig. 174 – Time history of injected boron mass in coaxial zones of
RELAP5-3D nodalization ... 270
Fig. 175 – Total mass of injected boron: comparison between CFD and BC
from RELAP5 ... 271
Fig. 176 – Identification of zones in 1D NK nodalization ... 271
Fig. 177 – Sketch of the fine hexagonal discretization ... 272
LIST OF TABLES
Tab. 1 – NRS issues needing CFD (from Ref [12]) ... 31
Tab. 2 – CNA-2 NPP: main features. ... 38
Tab. 3 – Comparison between CNA-2 and main NPP design. ... 39
Tab. 4 – CNA-2 NPP: main features of secondary side. ... 51
Tab. 5 – Relevant parameters of the Hydraulic Zones. ... 62
Tab. 6 – Significant LBLOCA parameters of Atucha-2 and comparison with
typical PWR. ... 71
Tab. 7 – Adopted code coupling within the FSAR Chapter 15 analyses. ... 76
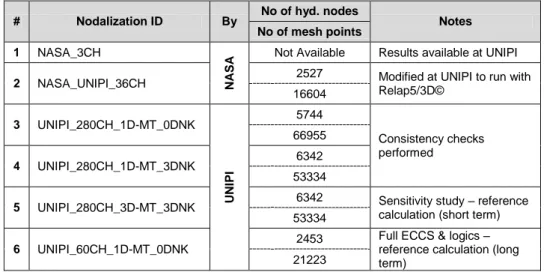
Tab. 8 – Nodalizations for SYS TH considered for the LBLOCA analysis of
CNA-2. ... 91
Tab. 9 – NASA_UNIPI_36CH nodalization: adopted code resources. ... 92
Tab. 10 – UNIPI_280CH_3D-MT nodalization: adopted code resources. ... 95
Tab. 11 – UNIPI_60CH_1D-MT nodalization: adopted code resources. ... 96
Tab. 12 – Pressure loss coefficients ... 110
Tab. 13 – Mass flow distribution over the channels: comparison against
DRUD2O values. ... 114
Tab. 14 – Mass exchange between rhomboidal sub-plena (extract from
comlete table). ... 116
Tab. 15 – Mass flow distribution over the channels: comparison against
DRUD2O values. ... 118
Tab. 16 – Mass exchange between rhomboidal sub-plena (extract from
complete table). ... 121
Tab. 17 – Relevant parameters of developed grids. ... 123
Tab. 18 – Rotation angle from additional calculations. ... 124
Tab. 19 – UP inlet values based on LP reference calculation ... 132
Tab. 20 – List of symmetry characteristics of relevant component ... 137
Tab. 21 – List of the most relevant geometrical features for each throttle ... 138
Tab. 22 – Relevant parameters of each sub-domain grid. ... 140
Tab. 23 – Relevant parameters of the assembled grids. ... 140
Tab. 24 – ID of performed CFD analyses. ... 143
Tab. 25 – Comparison between CFD calculated pressure drops and
DRUD2O values, different contributions are indicated. ... 146
Tab. 26 – Comparison between pressure loss coefficients calculated at
different mass flow rates and adopting grids without prism
layers for each HZ (calculated reference values indicated in
bold characters). ... 149
Tab. 27 – Comparison of pressure losses resulting from sensitivity analyses
on numerical settings, turbulence modeling and boundary
conditions. ... 150
Tab. 28 – Comparison of pressure losses resulting from sensitivity analyses
on equation solving procedures. ... 150
Tab. 29 – Comparison of pressure losses from reverse flow calculations. ... 151
Tab. 30 – Relevant linking parameters between Hydraulic Zones and
Reinforcing Tubes. ... 154
Tab. 31 – Relevant parameters of developed grids. ... 156
Tab. 32 – ID of performed CFD analyses. ... 158
Tab. 33 – Comparison between CFD calculated pressure drops and
DRUD2O values for both CC outlet configurations. ... 160
Tab. 34 – Comparison between calculated pressure drop coefficients for
both CC outlet configurations. ... 161
Tab. 35 – Comparison of pressure losses resulting from sensitivity analyses
on numerical settings, turbulence modeling and boundary
conditions. ... 162
Tab. 36 – Nominal boundary conditions adopted for the experiments. ... 165
Tab. 37 – Experimental values used for the comparison with CFD results. ... 166
Tab. 38 – Summary of performed CFD calculations. ... 170
Tab. 39 – Comparison with the experimental data... 171
Tab. 40 – IEC Reference results. ... 176
Tab. 41 – Results from 1
stgroup of sensitivity analysis on IEC Sector 1. ... 176
Tab. 42 – Results from 2
ndgroup of sensitivity analysis on IEC Sector 1. ... 177
Tab. 43 – Results from design optimization studies on IEC Sector 2: relative
difference with respect to original design pressure loss. ... 177
Tab. 44 – Imposed heat fluxes at CC walls. ... 183
Tab. 45 – Relevant parameters of developed grids. ... 200
Tab. 46 – Relevant parameters of developed grids. ... 212
Tab. 47 – ID number of performed CFD analyses. ... 215
Tab. 48 – Calculated pressure loss coefficient. ... 218
Tab. 49 – Results from sensitivity analysis on Rupture Disk pressure. ... 220
Tab. 50 – CNA-1 RDD grid: Comparison of relevant parameters against
CNA-2 RDD grid. ... 223
Tab. 51 – Relevant parameters of reference calculations. ... 224
Tab. 52 – Reference calculations: pressure losses. ... 225
Tab. 53 – Sensitivity analyses: pressure loss factor. ... 227
Tab. 54 – Comparison against single air test. ... 229
Tab. 55 – Main features of the developed grids. ... 233
Tab. 56 – Lance pressure losses calculated with reference setup. ... 238
Tab. 57 – Lance pressure losses: results from 1
stgroup of sensitivity
analysis. ... 239
Tab. 58 – Lance pressure losses: sensitivity on wall roughness. ... 239
Tab. 59 – Matrix of experiments conducted by SIEMENS. ... 246
1. INTRODUCTION
Computational Fluid Dynamics (CFD) is a well-established industrial design tool for non-nuclear applications, helping to reduce design time scales and to improve processes throughout the engineering world, providing a cost-effective and accurate alternative to scale model testing.
Within the Nuclear Reactor Safety (NRS) framework, the traditionally adopted tools for safety analysis evaluation (i.e. integral thermal-hydraulic codes) are not capable of predicting the effect of inherently three-dimensional flow fields and mixing phenomena in complex geometries, therefore the application of CFD techniques is considered to potentially bring real benefits in terms of deeper understanding of involved phenomena and of increased safety.
However, in many statements about the need to further validate CFD codes for nuclear reactor applications, there is an underlying belief that, behind the attractive features of CFD interfaces, there is not a completely reliable predictive tool, at least not reliable enough for being applied to safety related problems.
CFD codes are not yet – generally speaking – fully reliable tools: being inherently “three-dimensional” and “local” does not constitute a sufficient condition for assuring that 3D and local phenomena are accurately predicted. Colorful pictures and high definition movies that can easily be produced with CFD post-processing tools often give the illusion of a realistic and trustworthy representation of the reality, but may hide code deficiencies in achieving the needed level of accuracy. On the other hand, intensive CFD code development and assessment work has been and is being carried out in recent years, made more and more effective by the availability of increasing computing resources.
Such advancements are certainly oriented to obtaining reliable and efficient predictive tools; however, some additional efforts are necessary to meet the quality assurance requirements that would make such tools applicable to the nuclear reactor technology, and in particular to the safety analysis within the licensing process.
In this framework, the present thesis provides an outline of the methodology for the use of CFD analysis as support to the licensing process of a Nuclear Power Plant (NPP), namely Atucha-II NPP (CNA-2); thus contributing to the definition of the possible current role and the future perspectives of the application of CFD tools to NRS problems within both a licensing and a design framework.
CNA-2 is a 745 MW(e) natural uranium reactor constructed by the Nuclear Argentine Company for Electrical Power Generation (ENACE) and SIEMENS AG KWU. It belongs to a second generation reactor type using a unique Pressurized Heavy Water Reactor (PHWR) configuration. Its construction started in 1980, but stopped some years later. Partly as a response to the energy shortage caused by natural gas crisis of 2004, the issue of Atucha-II was taken up by the Argentine government, which has planned the completion of the construction in 2011. In this framework the Argentinean utility Nucleoeléctrica Argentina S.A. (NA-SA) and University of Pisa (UNIPI) reach in 2007 an agreement to support NA-SA in the areas of thermal-hydraulic and neutron kinetic design and of safety technology of Atucha-II (Ref. [1]). This agreement had a 2 years follow-up in 2008-9 (Ref. [2]) and has been extended for 2 years further. The aim of the agreement was the issuing
of the Chapter 15 of its Final Safety Analysis Report (FSAR) in order to finalize the CNA-2 licensing process.
Based on qualified tools and analytical procedures developed or available at UNIPI, a modern and technically consistent approach has been built upon best estimate methods including an evaluation of the uncertainty in the calculated results (Best Estimate Plus Uncertainties or BEPU approach). Adopting a “best estimate approach” for safety analyses means that, for each expected phenomenon, the best available tools and codes should be used. The last sentence constitutes an entry point for the application of CFD technique to NRS analyses, since it constitutes the only available technique able to analyze highly three-dimensional flow filed developing in extremely complex geometries.
In particular, the present research activity focused on the implementation of CFD techniques within a best estimate methodology in order to address the analysis of the Double Ended Guillotine Break Loss Of Coolant Accident (DEGB-LOCA or 2A-LOCA) scenario, which is included in the Chapter 15 of CNA-2 FSAR.
The DEGB-LOCA scenario was handled by means of developing a procedure adopting internal and external coupled application of best estimate thermal-hydraulic, neutron physics and fuel pin performance computer codes, together with the evaluation of the related uncertainties.
The coupled Thermal-Hydraulics System (TH-SYS) and Neutron Kinetic (NK) code analysis of the 2A-LOCA scenario needs to account for the neutronic feedback due to the fast boron injection into the moderator provided by the Fast Boron Injection (FBI) system intervention. The emergency boron injection system is a backup system for the fast shutdown of CNA-2 reactor, in addition to the control rods. The boron injection, powered by pressurized air, is meant to be actuated whenever the intervention of control rods is supposed to be not sufficiently fast to shutdown the reactor. In the postulated scenario, the pressure waves caused by the break of the pipe make the control rod insertion unfeasible, thus giving to the FBI effectiveness the responsibility of shutting down the reactor.
The time- and space-dependent distribution of injected boron inside the Reactor Pressure Vessel (RPV) are needed as boundary condition for the lumped parameter code analysis, accounting for the effect of inherently three-dimensional flow filed and mixing phenomena in a complex geometry such that inside the Moderator Tank (MT).
A systematic and integrated application of CFD techniques to NRS analysis for licensing purposes is presented, able to go beyond state-of-the-art approaches in this field of application. The present research is also contributing to the assessment of CFD codes in their application to problems related to nuclear safety and technology, in particular for the predictive analysis of in-vessel flows and of the related transport and mixing phenomena, together with the evaluation of concentrated pressure losses.
1.1 International Framework
The research has been carried out in the framework of the CFD-related activities and international research projects in progress at the San Piero a Grado Nuclear Research Group (GRNSPG) – University of Pisa, and has thus profited of the availability of large experimental databases and numerical resources, as well as of the connection to a wide number of internationally recognized experts in the fields
of nuclear reactor safety and thermal-hydraulic and CFD code development and assessment.
A representative list of the main international Projects that have constituted the framework of this research is given below.
Research Agreement between UNIPI and NA-SA
UNIPI and the Argentinean utility NA-SA have established a cooperation agreement in 2006, within which UNIPI provides support to the safety analysis of the PHWR Atucha-II (currently under construction in Argentina), with the aim of issuing the FSAR for the plant.
In this context, many CFD investigations have been and are being performed among other studies, addressing specific issues relevant to the safety and operation of Atucha-II reactor (including in-vessel flow).
OECD “V1000CT-2” Benchmark, “VVER-1000 Coolant Transient: Coolant Mixing Tests and MSLB”
This international benchmark, in which UNIPI participated, had the purpose of testing existing tools for computation of coolant mixing in reactivity transients, such as for instance a Main Steam Line Break (MSLB) scenario in a PWR. The benchmark was based on measured plant data from Kozloduy NPP Unit 6 (Refs. [3] and [4]). Both system codes and CFD codes were adopted by the participants (including UNIPI: Ref. [5], [6] and [7]) to simulate the transient and quasi steady-state phases of the scenario.
Project TACIS R2.02/02, “Simulation tools for transients involving spatial variations of coolant properties”
This project funded by the European Commission was a part of the TACIS programme (Technical Assistance to the Commonwealth of the Independent States), and was conducted in the period January 2005 to June 2007. The work was conducted by a Consultant – a consortium formed by AREVA (the Project leader), the University of Pisa UNIPI and the Forschungszentrum Dresden- Rossendorf (FZD) – in cooperation with a Director of Experiments (the Russian utility Gidropress), and had as a “beneficiary” the Rosenergoatom, i.e. the Russian Ministry for the atomic energy.
The objective of the project was to provide a validation database for a set of selected Russian thermal-hydraulics system codes, regarding the investigation of mixing inside the RPV during transients involving perturbation of the coolant properties distribution at the core inlet. The validation database achieved is constituted by ten experiments conducted in the Gidropress Mixing Facility (GPMF) and pre- and post-test calculations with the selected system codes. All experiments were also simulated (both by UNIPI and FZD) with the CFD code ANSYS CFX, which provided a valuable support to the system code validation process. The CFD validation was obviously a useful by-product of the activity.
Agreement UNIPI-FZD
A long lasting research cooperation agreement exists between FZD and the Department of Mechanics, Nuclear and Production Engineering (DIMNP). In this framework, FZD provided UNIPI specialists with measured data from some
experiments have been simulated both with CFD codes (such as ANSYS-CFX, Fluent and Trio_U) and the system code RELAP5-3D.
NURESIM Integrated Project (EU 6th FP), “European Platform for Nuclear Reactor Simulations”
This project, part of the 6th Framework Programme of the EURATOM, was conducted by a consortium of more than twenty European participants (including University of Pisa, Ref. [8], [9] and [10]) in the period 2005-2007, with the objective of developing and establishing a common European software platform for nuclear reactor simulation. One of the five sub-projects dealt with the development and the validation of thermal-hydraulics tools, and in particular of specific models to be implemented into the French CFD code NEPTUNE_CFD (owned by CEA and EDF) for the simulation of two-phase phenomena occurring in light water reactors during accidental scenario (e.g., boiling crisis and pressurized thermal shock). NURESIM is also a long-term development program, of which the NURESIM IP was the first step. The next step is the Project NURISP which is just starting. OECD – NUPEC “BFBT” Benchmark
This international benchmark was based on NUPEC BWR Full-size Fine-mesh Bundle Tests (BFBT) and was aimed at assessing the boiling flow modeling capabilities of existing CFD and sub-channel codes. The test facility had provided in the past very accurate measurements of the void fraction at the outlet of a boiling channel for several experiments at different operating conditions, and such data constitute a valuable database for two phase flow CFD code validation.
UNIPI participated in the benchmark performing CFD simulations with both CFX and NEPTUNE_CFD codes.
1.2 Structure of the Document
The present document, in addition to this Introduction, is subdivided into 5 other Chapters.
In particular, Chapter 2 outlines the current role and future perspectives of CFD codes within the Nuclear Reactor Safety (NRS) analyses framework, underlining the outcome of the Committee on the Safety of Nuclear installation (CSNI) Writing Groups on CFD.
Chapter 3 contains an overview of the Atucha-II Nuclear Power Plant, highlighting the peculiarities of the plant design and focusing on the Reactor Pressure Vessel internals.
Then, Chapter 4 briefly describes the 2A-LOCA scenario in Atucha-II NPP, addressing the peculiarities of its unique design. This Chapter highlight the need for an overall and systematic analysis approach, going beyond the common current practice in NRS analyses.
Chapter 5 deals with the CFD assessment of the coolant in-vessel flow in nominal conditions. The flow field and mixing has been investigated in the Downcomer (DC), the Lower Plenum (LP) and the Upper Plenum (UP) regions. Moreover, the assessment of the core pressure losses is documented in this Chapter, which address the estimation of several contribution to the overall pressure loss, comparing the results against available experimental data.
Then, Chapter 6 focuses on the CFD analyses of the Fast Boron Injection (FBI) system intervention during the 2A-LOCA scenario. The investigation of the moderator in-vessel flow in nominal conditions is presented, together with the assessment of the most relevant pressure losses affecting the injection effectiveness by means of comparison against experimental data. Moreover, the CFD transient simulation of the boron injection is documented, as well as a simulation of an experimental test for CFD model assessment purposes.
2. THE ROLE OF CFD CODES IN NUCLEAR REACTOR SAFETY
ANALYSES
An exhaustive description of the state-of-the-art in the application of CFD codes to NRS problems has recently been produced by the three “Writing Groups on CFD”, those groups of experts were created by the CSNI in 2002, and have periodically met (twice per year) with the aims of providing Best Practice Guidelines (BPG), evaluating the existing CFD assessment database and related limitations, and exploring the possibilities of extension to two-phase flows. They have met until the end of 2006, 2007 and 2008 respectively, and the result of their work consists of three reports (Ref. [11], [12] and [13]).
Moreover, several experimental campaigns and code development and assessment activities have been carried out in the recent years, both in international and national frameworks, as well as international workshops and conferences devoted to the CFD application in the nuclear field.
This Chapter includes both a brief introduction to CFD techniques and information from the aforementioned CSNI reports (in particular the first two, since two-phase flow is not addressed in this document), as well as from the surveyed literature.
2.1 Introduction to CFD Techniques
CFD is a computer-based tool for simulating the behavior of systems involving fluid flow, heat transfer, and other related physical processes. It works by solving the equations of fluid flow (accounting in detail for turbulence effects) over a region of interest, with specified boundary conditions.
For many years numerous programs have been written to solve either specific fluid flow problems or specific classes of fluid flow problems. From the mid-1970‟s, the complex mathematics required to generalize the algorithms began to be understood, and general purpose CFD solvers were developed.
These began to appear in the early 1980‟s and required what were then very powerful computers, as well as an in-depth knowledge of fluid dynamics, and large effort to set up simulations. Consequently, CFD was a tool used almost exclusively in research.
Recent advances in computing power, together with powerful graphics and interactive 3D manipulation of models have made the process of setting up a CFD model and analyzing results much less labor intensive, reducing time and, hence, cost. Advanced solvers contain algorithms which enable robust solutions of the flow field in a reasonable time.
As a result of these development, CFD is now an established industrial design tool, helping to reduce design time scales and improve processes throughout the engineering world. CFD provides nowadays a cost-effective and accurate alternative to scale model testing, with variations on the simulation being performed quickly, offering obvious advantages.
In normal usage CFD now implies solution of Navier-Stokes (as opposed to Euler) equations with some special provision for modeling turbulence.
An early decision in modeling any turbulent flow is the high level approach to turbulence modeling. A brief definitions of four approaches are provided here as part of basic CFD terminology. Distinctions between the approaches are based on