PAPER • OPEN ACCESS
First results of the Hoyle-Gamma experiment: study of the excited levels
in carbon-12 gamma decay
To cite this article: F. Favela et al 2018 J. Phys.: Conf. Ser. 1078 012010
View the article online for updates and enhancements.
Content from this work may be used under the terms of theCreative Commons Attribution 3.0 licence. Any further distribution
First results of the Hoyle-Gamma experiment: study of
the excited levels in carbon-12 gamma decay
F. Favela1,2, L. Acosta2,1, L. Auditore1, A. Camaiani4, G. Cardella1, E. De Filippo1, S. De Luca5,1, N. Gelli4, B. Gnoffo1,8,
D.J. Marín-Lámbarri2, G. Lanzalone3,6, C. Maiolino3,
N.S. Martorana3, A. Nannini4, A. Pagano1, E.V. Pagano3, M. Papa1, S. Pirrone1, G. Politi8,1, E. Pollacco7, L. Quattrocchi5,1, F. Rizzo8,3, P. Russotto3, A. Trifirò5,1, M. Trimarchi5,1
1 INFN sezione di Catania, Via Santa Sofia 64 I-95123, Catania, Italy.
2Instituto de Física, Universidad Nacional Autónoma de México, 01000, México, D.F., México 3INFN LNS, Via Santa Sofía 62 I-95123, Catania, Italy.
4INFN sezione di Firenze and Dip. di Fisica Università di Firenze, Italy 5Dipartimento di Scienze MIFT, Università di Messina, Messina, Italy. 6Facoltà di Ingegneria e Architettura, Università Kore, Enna, Italy. 7CEA IRFU Saclay, Gif sur Yvette, France.
8Dipartimento di Fisica e Astronomia, Università di Catania, Italy. E-mail: [email protected]
Abstract. Preliminary analysis of the Hoyle-Gamma experiment is presented, where simultaneous gamma-particles detection for the α +12C → α + (12C∗+ γ) reaction is used to suppress the background various orders of magnitude. This will allow us to measure very small Γ partial widths of 12C. Details of the method, the implementation and CHIMERA software analysis are presented as well as preliminary results.
1. Introduction
In previous measurements we have shown the possibility to measure gamma rays with CHIMERA detector array looking to the 4.44 decay of 12C [1]. To use such ability and the large solid angle covered by this detector array, we are interested in observing the gamma decay of 12C states above the particle emission threshold, important for astrophysical studies [2], of the Hoyle (at 7.65 MeV) and the 9.6 MeV states.
A multicoincidence technique analysis has been developed in order to obtain a very high rejection fraction of the background, necessary to measure the rare gamma decays of these states. The contemporary detection and identification of particles and gamma rays with the 4π detector CHIMERA [3] guarantee the large efficiency necessary for such a method.
CHIMERA has 18 rings in the forward part (covering from ≈ 1◦ to 30◦), and 17 rings in the sphere (≈ 30◦ to 175◦). Using the azimuthal symmetry, each ring corresponds to a different θ value and the φ depends of the specific detector in a particular ring. The target is centered at the center of the sphere. As a convention we put the rings of the forward part in 9 groups with 2 sub-rings each, we differentiate between two sub-rings by tagging them with an “i” or an “e” referring to internal or external sub-ring (for example “8i” refers to ring 8 internal sub-ring). For
2
the sphere we continue the numeration of the rings up to 26, starting from 10. Here we don’t need sub-rings tagging and as a convention we add an “S” at the beginning of the group number to obviate that we are referencing a ring on the sphere (for example “S14” refers to ring 14 on the sphere). To refer to any particular telescope in a given ring we put a number next to the ring that contains it, this number goes from zero to the number of detectors of that ring minus one, for example “S11 11” refers to the twelfth telescope on ring “S11”. We can also address the telescopes by an absolute number going from 0 (“1i 0”) to 1191 (“S26 7”), for example telescope “S11 11” is equivalent to telescope 731. The former way of addressing the telescopes is a ring relative form while the latter is an absolute form.
On this experiment a 64MeV alpha beam was used to impinge a carbon target (106 μm/cm2), with the intention of populating various excitation levels of 12C and measuring the gamma ray angular correlation. On the following sections the suppression method and part of the analysis is shown using the explained conventions.
2. Suppression Method
There has been previous work in using CHIMERA for gamma rays identification in [1, 4]. Measuring just the gamma rays will not give us any useful information about our system. We need to suppress the background using particle coincidences.
We can start by selecting the rings that should be in kinematic coincidence (using the azimuthal symmetry) and then get to the detector level. Table 1 gives the set of rings that should be in kinematical coincidence for several states in 12C including the Hoyle state, taking into account that the12C was able to punch through the target and the alpha particle was able to reach a CsI detector. The minimum and maximum rings for the residual particle (12C) are due to the Δθ on the ejectile ring.
ground 4.4 7.65 9.64
αring 12Cmin 12Cmax αring 12Cmin 12Cmax αring 12Cmin 12Cmax αring 12Cmin 12Cmax
9i S15 S15 8e S14 S14 8i S14 S14 7e S14 S14 9e S15 S15 9i S14 S14 8e S14 S14 8i S14 S14 S10 S14 S15 9e S14 S14 9i S14 S14 8e S14 S14 S11 S13 S14 S10 S13 S14 9e S14 S14 9i S14 S14 S12 S13 S13 S11 S13 S13 S10 S13 S14 9e S13 S14 S13 S12 S13 S12 S12 S13 S11 S13 S13 S10 S13 S13 S14 S11 S12 S13 S12 S12 S12 S12 S13 S11 S12 S13 S15 S11 S11 S14 S11 S12 S13 S12 S12 S12 S12 S12 S16 S10 S11 S15 S11 S11 S14 S11 S12 S13 S11 S12 S17 S10 S10 S16 S10 S11 S15 S11 S11 S14 S11 S11 S18 9e S10 S17 S10 S10 S16 S10 S11 S15 S10 S11 S19 9i 9e S18 9e S10 S17 S10 S10 S16 S10 S10 S20 8e 9i S19 9i 9e S18 9e S10 S17 S10 S10
Table 1. Coincidences between rings of CHIMERA for the ground state and the first levels of
12C (considering a 64 MeV alpha beam on 12C).
As we can see from Table 1, we notice that most of the coincidences are in fact on the sphere, however given the distance from the target to the detector and the size of the detector we end up with a Δθ = 8◦ (nevertheless, a kinematical coincidence technique can greatly improve the angular resolution [5]), this means that for a specific reaction the alpha energy may vary up to 3 MeV for a given telescope on the sphere.
This energy spread is too large and can be very dangerous for the experiment we performed. We can recover from this and get a good resolution by adding the energies of both particles
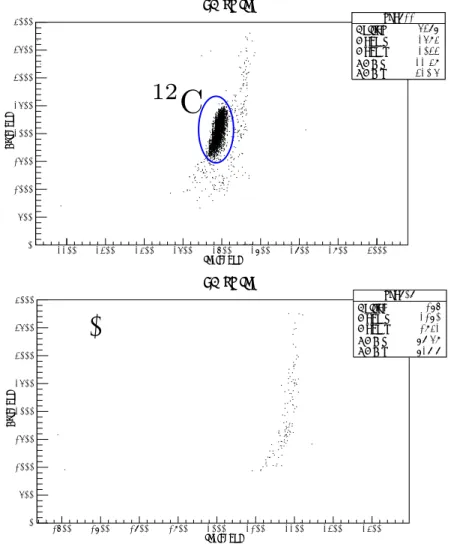
(alpha and 12C) and obtaining the Q-value spectrum. This allows to make cuts around specific peaks (corresponding to 12C excited levels) and finding the corresponding alphas and carbon particles (see Figure 1, adapted from [6], as an example of a Q-value spectrum that we have to build once the calibration for each of the detectors is ready).
We can further improve the background suppression by kinematically selecting the detectors in coincidence as follows.
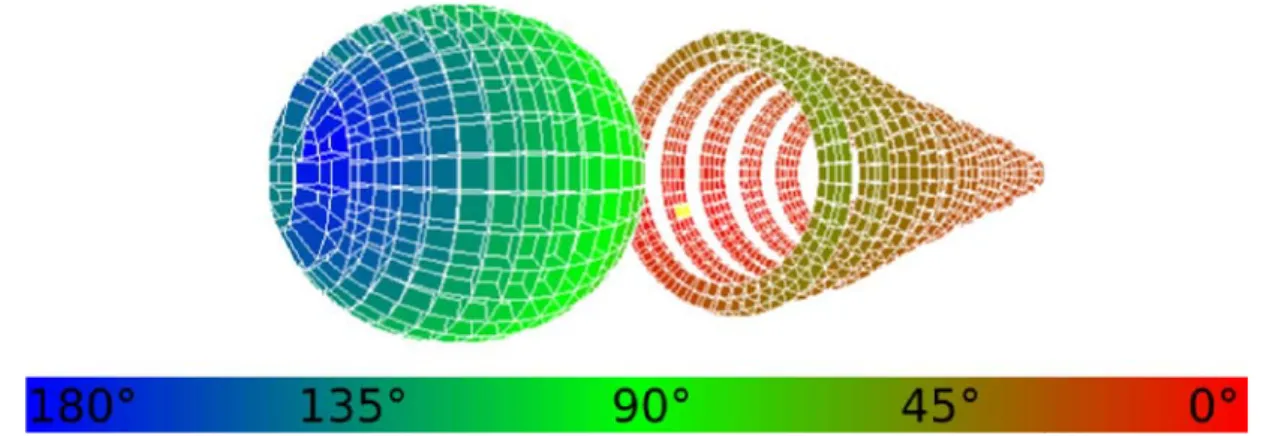
Figure 1. Q-value spectrum from a previous experiment [6] with p +12C at 24 MeV. In accordance to Table 1, in Figure 2 we see that if an alpha particle (ejectile, blue) is detected in ring “8i” (when populating the Hoyle state), then the corresponding 12C is detected in ring “S14” at the sphere (red).
Figure 2. Rings in kinematic coincidence. An alpha particle arrives at ring “8i” (blue on the right) and the corresponding 12C arrives at “S14” on the sphere (red on the left). Specific detectors in coincidence are shown on yellow.
4
in φ). Note that for a fixed alpha particle angle, the coincident 12C recoil could be detected (event by event) in different angularly close telescopes.
In order to properly profit from the 4π nature of CHIMERA we need to take into account
every telescope. For each telescope where a 12C has been detected, inside the specific cut for a specific excitation energy region (on the Q-value spectra) in coincidence with an alpha particle, we have to search for all the telescopes where the corresponding gamma rays on the CsI have been detected.
The better way to extract the angular distribution of emitted gamma rays is to consider as reference the 12C recoil angle. Therefore we must determine the relative angle between a telescope where the 12C has been detected and the one where a gamma ray has been detected. The nice symmetry for different rings corresponding to different theta values is broken. Section 2.1 speaks of software tools that have been developed in order to automate this and other tasks. Figure 3 shows the results of such calculations in a specific case for a detector in ring “8i” (the yellow telescope in the middle where a12C is found). In red are marked the detectors that have a relative angle (with respect to the yellow one) close to0◦, in green the ones close to90◦ and in blue the ones close to 180◦. The zero degree line is defined from the target to the center of the telescope where the12C has been detected.
We can take into account for the scarce statistics (specially expected for the 9.6 MeV state) by adding all the gamma histograms that come from the coincidences with a corresponding12C. There should be 2 gamma rays for each 12C (for the aforementioned levels above the 4.4 MeV), making in total a 4 fold particle coincidence increasing even more the background suppression.
A fraction of the gamma rays from the 9.6 MeV level could go directly to the ground state, making some of the coincidences 3 fold.
2.1. Software Development
The analysis is greatly simplified and sped up by the developed software named alchemist (previously named binCor). It uses isonav [7] as a kinematic engine. You can find alchemist under the isonavScripts folder provided at the link on the reference.
It receives as input a file with the reaction details, beam energy projectile isotope, residual isotope, excitation energy of the residual particle and target thickness and depending on the selected option it will output a table with the corresponding rings in coincidence, the energies of the particles before and, if chosen, the energy loss after the silicon detector. It also includes time of flight and specific detector operations. Table 1 as well Figures 2 and 3 where made with the help of this software. It also provides general information of CHIMERA and example generation.
3. Experimental procedure
The experiment was performed at the “Laboratori Nazionali del Sud” (INFN-LNS Catania, Italy). We used a 64MeV alpha beam impinging on a natural carbon target (≈ 98.9%12C and ≈ 1.1%13C for our intended purposes).
The used natural carbon targets had densities of 50, 69 and 106 μm/cm2. Having an
approximate abundance in the order of one percent on the natural carbon, 13C may play an important source of spurious reactions. We take this into account by using a pure13C target as a control with 50μm/cm2 as density.
A hybrid acquisition system has been implemented (VME and GET [8]) as part of a continuous upgrade in order to satisfy our experimental needs.
The system was set to trigger on multiplicity≥ 2 on the silicons; of course the gamma rays arrive first but the rise-time of the CsI is so large (≈ 1μ sec) that the charged particles signals catch up and get in time for the triggering.
Figure 3. Relative angle of all the telescopes in CHIMERA with respect to the yellow one (in the middle).
4. Preliminary results
Figure 4 shows a Si vs fast (CsI) spectra on the 731 telescope (“S11 11”). We can clearly see the regions of p, d, t, the3He and the alpha. We are also able to fairly distinguish the different alphas corresponding to the different excitation levels, given the angular coverage of the detector, the energies are not well resolved as in [9] but, as it has been previously mentioned, the Q-value spectra will help us overcome any overlaps between levels.
CsI fast (chan)
200 400 600 800 1000 1200 1400 1600 Si [chan] 0 500 1000 1500 2000 2500 3000 3500 4000 h50731 Entries 27346 Mean x 738 Mean y 2098 RMS x 428 RMS y 672.7 h50731 Entries 27346 Mean x 738 Mean y 2098 RMS x 428 RMS y 672.7 TEL731-sifastHG
Figure 4. Si-fast spectra of the 731 telescope (“S11 11”). Alpha and 3He particles are seen at the top while the 3 regions at the bottom correspond to p, d, t (protons, deuterons and tritons). If we choose a specific energy to study (for example the Hoyle state) and select the alpha particles on a particular telescope (in this case 731 or “S11 11”) we could also locate the corresponding detector where the residual 12C particle should be found. We know from Table 1 that for this reaction “S11” (ejectile) ring is in kinematic coincidence with ring “S13” (residual).
6
More specifically “S11 11” (731) and “S13 27” (811) should be in kinematic coincidence for the selected reaction (in a similar manner as in Figure 2).
Figure 5 shows a comparison of two dE vs tof plots of telescopes that are close by in the same ring, 811 (“S13 27”) and 808 (“S13 24”). As aforementioned, given the telescope 731 the kinematic coincidence points to telescope 811 (Figure 5.a shows the carbons), that means that there cannot be carbons in other telescopes even if they are close by, this is demonstrated in Figure 5.b.
However alpha particles were seen, as expected from the fragmentation of the 12C∗, in all detectors. Figures 5.a and 5.b show these.
tof [chan] 2200 2300 2400 2500 2600 2700 2800 2900 3000 Si [chan] 0 500 1000 1500 2000 2500 3000 3500 4000 spe811 Entries 5387 Mean x 2594 Mean y 2033 RMS x 22.49 RMS y 320.5 spe811 Entries 5387 Mean x 2594 Mean y 2033 RMS x 22.49 RMS y 320.5 dE vs tof
a)
tof [chan] 1600 1700 1800 1900 2000 2100 2200 2300 2400 Si [chan] 0 500 1000 1500 2000 2500 3000 3500 4000 spe808 Entries 176 Mean x 2170 Mean y 1942 RMS x 78.59 RMS y 728.8 spe808 Entries 176 Mean x 2170 Mean y 1942 RMS x 78.59 RMS y 728.8 dE vs tofb)
Figure 5. dE vs tof for detectors 811 (in kinematic coincidence) and 808 (not in coincidence). Alpha particles from 12C∗ can be seen in both plots.
In accordance to Table 1 if the ejectile reached a detector in ring S13 then, for both the ground and the 4.44 levels, the carbon in kinematic coincidence should be in ring S12. This can readely be shown in Figure 6 where the carbon energy on the front silicon detector is shown for telescope 774 (S12 22) versus the energy (in channels) deposited by the ejectile (alpha) particle from telescope 790 (S13 6). The region enclosed by the polygon is the ground state whereas the region to the left corresponds to the 4.44 level. The energy spread is due to the angular span of the telescopes.
It is important to mention that given the high number of detectors involved in CHIMERA, not all of the detectors were expected to work properly during all the runs. Therefore, in order
alphas CsI energy [chan]
0 200 400 600 800 1000 1200 1400 1600 1800 2000
Carbon-12 energy [MeV]
0 5 10 15 20 25 30 hE774R790 Entries 6275 Mean x 994 Mean y 17.42 RMS x 130.6 RMS y 1.774 hE774R790 Entries 6275 Mean x 994 Mean y 17.42 RMS x 130.6 RMS y 1.774 Carbon-12 (S12 22) vs alpha (S13 6)
Figure 6. Carbon energy [MeV] in Si (telescope 790) vs alpha energy [channels] in CsI. (telescope 774)
to protect the trustworthiness of the data, we simply avoid using these detectors at all (at least in this initial analysis) and we will take this into account in the efficiency calculation.
5. Conclusions
We showed how the granularity challenge of the high angular coverage for each of the telescopes in the sphere can be overcomed by the Q-value plot (still pending for this experiment). And how subsequent background suppressions can be performed by means of kinematic coincidences, while at the same time take into account, telescope by telescope, the angular distribution of the gamma rays.
Up to a 4 fold coincidence can be obtained by simultaneous measurements of charged particles with gamma rays, making the technique a good background suppression tool.
We were able to acquire the data with a hybrid system successfully and performed basic analysis allowing us to confirm the reliability of the data in order to make the final analysis.
The analysis software seems to work properly and will help to speed up the process. It is under continuous improvement, future upgrades will provide more options and a better graphic display. It allows to immediately start handling similar types of experiments, where a binary reaction is studied with CHIMERA.
References
[1] Cardella G et al. 2015 Nuclear Instruments and Methods in Physics Research Section A: Accelerators,
Spectrometers, Detectors and Associated Equipment 799 64 – 69 URL
http://www.sciencedirect.com/science/article/pii/S0168900215008839 [2] Herwig F, Austin S M and Lattanzio J C 2006 Phys. Rev. C 73(2) 025802 URL
https://link.aps.org/doi/10.1103/PhysRevC.73.025802 [3] Pagano A et al. 2004 Nuclear Physics A 734 504 – 511 URL
http://www.sciencedirect.com/science/article/pii/S0375947404001137 [4] Martorana N 2018 submitted to Phys. Lett. B
[5] Acosta L et al. 2013 Nuclear Instruments and Methods in Physics Research Section A: Accelerators,
Spectrometers, Detectors and Associated Equipment 715 56 – 61 URL
http://www.sciencedirect.com/science/article/pii/S0168900213003161 [6] Cardella G et al. 2017 EPJ Web Conf. 165 01009 URL
8 [7] Favela F 2018 isonav
https://github.com/ffavela/isonav
[8] Pollacco E et al. 2018 Nuclear Instruments and Methods in Physics Research Section A: Accelerators,
Spectrometers, Detectors and Associated Equipment 887 81 – 93 URL
http://www.sciencedirect.com/science/article/pii/S0168900218300342 [9] Favela F et al. 2015 Phys. Rev. ST Accel. Beams 18(12) 123502 URL

![Figure 1. Q-value spectrum from a previous experiment [6] with p + 12 C at 24 MeV. In accordance to Table 1, in Figure 2 we see that if an alpha particle (ejectile, blue) is detected in ring “8i” (when populating the Hoyle state), then the corresponding 12](https://thumb-eu.123doks.com/thumbv2/123dokorg/4570075.38244/4.892.289.606.315.617/spectrum-previous-experiment-accordance-ejectile-detected-populating-corresponding.webp)
![Figure 6. Carbon energy [MeV] in Si (telescope 790) vs alpha energy [channels] in CsI](https://thumb-eu.123doks.com/thumbv2/123dokorg/4570075.38244/8.892.189.712.181.436/figure-carbon-energy-mev-telescope-alpha-energy-channels.webp)
