SEVEN-DAY PROFILE PUBLICATION
Potentially modifiable factors
contributing to outcome from acute respiratory
distress syndrome: the LUNG SAFE study
John G. Laffey
1,2*, Giacomo Bellani
3,4, Tài Pham
5,6,7, Eddy Fan
8,9, Fabiana Madotto
10, Ednan K. Bajwa
11,
Laurent Brochard
12,13, Kevin Clarkson
14, Andres Esteban
15, Luciano Gattinoni
16, Frank van Haren
17,
Leo M. Heunks
18, Kiyoyasu Kurahashi
19, Jon Henrik Laake
20, Anders Larsson
21, Daniel F. McAuley
22,
Lia McNamee
22, Nicolas Nin
15, Haibo Qiu
23, Marco Ranieri
24, Gordon D. Rubenfeld
25, B. Taylor Thompson
11,
Hermann Wrigge
26, Arthur S. Slutsky
12,13,27, Antonio Pesenti
28,29and The LUNG SAFE Investigators and the
ESICM Trials Group
© 2016 Springer-Verlag Berlin Heidelberg and ESICM
Abstract
Purpose: To improve the outcome of the acute respiratory distress syndrome (ARDS), one needs to identify poten-tially modifiable factors associated with mortality.
Methods: The large observational study to understand the global impact of severe acute respiratory failure (LUNG SAFE) was an international, multicenter, prospective cohort study of patients with severe respiratory failure, con-ducted in the winter of 2014 in a convenience sample of 459 ICUs from 50 countries across five continents. A pre-specified secondary aim was to examine the factors associated with outcome. Analyses were restricted to patients (93.1 %) fulfilling ARDS criteria on day 1–2 who received invasive mechanical ventilation.
Results: 2377 patients were included in the analysis. Potentially modifiable factors associated with increased hospital mortality in multivariable analyses include lower PEEP, higher peak inspiratory, plateau, and driving pressures, and increased respiratory rate. The impact of tidal volume on outcome was unclear. Having fewer ICU beds was also asso-ciated with higher hospital mortality. Non-modifiable factors assoasso-ciated with worsened outcome from ARDS included older age, active neoplasm, hematologic neoplasm, and chronic liver failure. Severity of illness indices including lower pH, lower PaO2/FiO2 ratio, and higher non-pulmonary SOFA score were associated with poorer outcome. Of the 578 (24.3 %) patients with a limitation of life-sustaining therapies or measures decision, 498 (86.0 %) died in hospital. Fac-tors associated with increased likelihood of limitation of life-sustaining therapies or measures decision included older age, immunosuppression, neoplasia, lower pH and increased non-pulmonary SOFA scores.
*Correspondence: [email protected]
1 Departments of Anesthesia and Critical Care Medicine, Keenan Research
Centre for Biomedical Science, St Michael’s Hospital, Toronto, Canada Full author information is available at the end of the article The LUNG SAFE investigators and National coordinators are listed in Appendix 1 and 2 of the supplementary materials.
Take-home message: In patients enrolled in LUNG SAFE, potentially modifiable factors associated with survival include higher PEEP, lower peak inspiratory, plateau, and driving pressures, and lower respiratory rate. Non-modifiable factors associated with worse outcome from ARDS included older patient age, active neoplasm, hematologic neoplasm, and chronic liver failure.
Introduction
Acute respiratory distress syndrome (ARDS) is character-ized by acute inflammatory lung injury, associated with increased pulmonary vascular permeability, increased lung weight, and loss of aerated lung tissue [1].
The large observational study to understand the global impact of severe acute respiratory failure (LUNG SAFE) was recently undertaken in 459 intensive care units (ICUs) in 50 countries in five continents [2]. The results showed that ARDS continues to represent a global public health problem, occurring in 10 % of patients admitted to ICUs. ARDS was under-recognized by clinicians, while the use of contemporary evidence-based ventilatory strategies and adjuncts was lower than expected. Of most concern, ARDS continues to confer a high mortality, with 40 % of patients with ARDS dying in hospital. The wide geographic spread of participating ICUs, the large patient sample size, and the use of the Berlin criteria to classify patients independent of clinician recognition are impor-tant strengths of this study [2].
A key pre-specified secondary aim of the LUNG SAFE study was to examine the factors associated with out-comes in patients with ARDS in the era of the Berlin definition of ARDS. We were particularly interested in identifying potentially modifiable risk factors, such as those relating to patient management. In particular, we wished to understand the relationship between ventila-tor-related parameters and patient outcome from ARDS. In addition, we wished to determine the contribution of demographic factors, ARDS risk factors, and illness severity to patient outcome, as well as the factors associ-ated with decisions to limit care.
Methods and materials Study design
The detailed methods and protocol have been published elsewhere [2]. In brief, LUNG SAFE was an international, multicenter, prospective cohort study, with a 4-week enrollment window in the winter season [2]. The study, funded by the European Society of Intensive Care Medi-cine (ESICM), was endorsed by multiple national societies/ networks (Appendix 1). All participating ICUs obtained ethics committee approval, and either patient consent or ethics committee waiver of consent. National coordina-tors (Appendix 1) and site investigacoordina-tors (Appendix 2) were
responsible for obtaining ethics committee approval and for ensuring data integrity and validity.
Patients, study design, and data collection
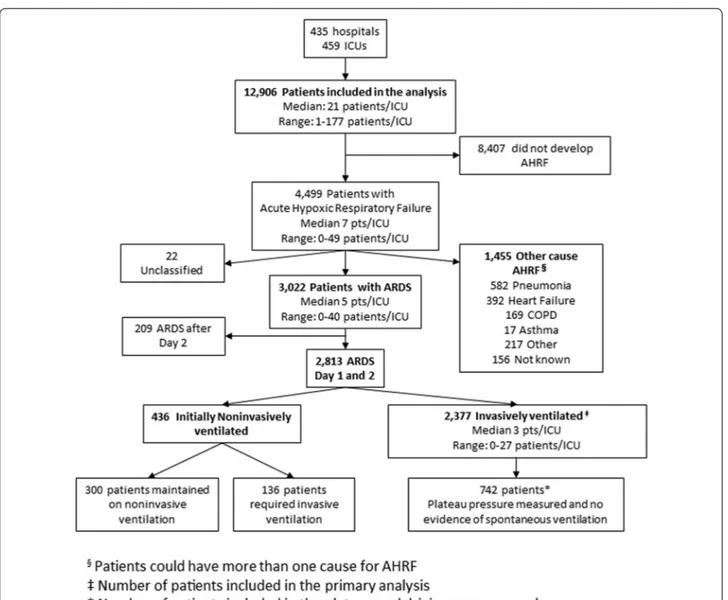
Inclusion criteria were admission to a study ICU (includ-ing ICU transfers) within the 4-week enrollment window and receipt of invasive or noninvasive ventilation (NIV). Exclusion criteria were age less than 16 years or inabil-ity to obtain informed consent, where required. Patients were classified as having ARDS on the basis of whether or not they fulfilled all of the Berlin criteria rather than by clinician determination, as previously described [2]. To ensure a more homogenous dataset, we restricted subse-quent analyses to the large subset of patients (93.1 %) that fulfilled ARDS criteria on day 1 or day 2 following the onset of acute hypoxemic respiratory failure (AHRF) and who received invasive mechanical ventilation (Fig. 1). All data were recorded for each patient at the same time each day within participating ICUs, normally as close as possi-ble to 10 a.m. each day. Data on ventilatory settings were recorded simultaneously with arterial blood gas analysis. Data definitions
We defined ARDS severity according to the Berlin defini-tion: mild (PaO2/FiO2 ratio 201–300 mmHg), moderate (PaO2/FiO2 ratio 101–200 mmHg), and severe (PaO2/ FiO2 ratio ≤100 mmHg). ICU and hospital survival were evaluated at ICU or hospital discharge, or at day 90, whichever occurred first.
Patients were considered to have a pulmonary etiology of their ARDS if they had one or more pulmonary risk factors (e.g., pneumonia, aspiration, lung contusion, inhalation injury), and to have an extrapulmonary etiology if they had one or more non-pulmonary risk factors (e.g., systemic sepsis, burn, blood transfusion). Patients with both types of risk factors were considered as a separate category.
Driving pressure was defined as plateau pressure minus PEEP, and was calculated only in patients who had no evidence for spontaneous ventilation, i.e., where set and measured respiratory rates were equal (N = 742 patients). Data management and statistical analyses
Descriptive statistics included proportions for categorical and mean (standard deviation) or median (interquartile range) for continuous variables. The amount of missing
Conclusions: Higher PEEP, lower peak, plateau, and driving pressures, and lower respiratory rate are associated with improved survival from ARDS.
Trial Registration: ClinicalTrials.gov NCT02010073.
Keywords: Acute respiratory distress syndrome, Positive end-expiratory pressure, Patient outcome, Driving pressure, Peak inspiratory pressure
data was low as previously reported [2], and no assump-tions were made for missing data. Proporassump-tions were compared using Chi-squared or Fisher exact tests, and continuous variables were compared using T-test or Wil-coxon rank sum test, as appropriate. Shapiro–Wilks test was used to assess normality in data distribution.
In each ARDS severity category (mild, moderate, severe), we estimated the relative risk (RR) of ICU and hospital mortality stratifying the study sample according tidal volume (<8 ml/kg, ≥8 ml/kg), PEEP (<12 cmH2O, ≥12 cmH2O), driving pressure (<14 cmH2O, ≥14 cmH2O),
and plateau pressure (<25 cmH2O, ≥25 cmH2O) measured at ARDS onset. These thresholds were each defined a pri-ori on the basis of previous studies [3–5] or, in the case of PEEP, a consensus decision.
To identify predictors of hospital and ICU mortality and limitation of life-sustaining therapies or measures decision during hospital stay, we conducted a bivariable analysis for each demographic factor, ARDS risk factor, patients’ comorbidity, illness severity, and management factor measured on the day of ARDS onset and ICU organizational factors. A stepwise regression approach
Fig. 1 Flowchart of patient’s screening and enrollment. Data on 12,906 ventilated patients enrolled during the study period were analyzed. 4499
patients developed acute hypoxemic respiratory failure (AHRF), of which 3022 fulfilled acute respiratory distress syndrome (ARDS) criteria accord-ing to the Berlin definition. In 22 “unclassified” patients it was not possible to determine whether they fulfilled the criteria for ARDS because of incomplete data. This report focuses on the 2377 patients that developed ARDS within 1–2 days of developing AHRF and who were managed with invasive mechanical ventilation. For the analyses relating to driving and plateau pressure, we restricted the population to the patients in whom plateau pressure was measured and in whom there was no evidence of spontaneous ventilation (N = 742 patients)
with significance alpha levels of 0.05 (both for entry and retention) was used to establish a set of independent variables associated with mortality. Stepwise regression is an iterative process whereby we checked the statistical significance of all variables at each stage and the process ends when none of the effects outside the model has an
F statistic significant at the entry probability level and
every effect in the model is significant at the retention probability level. Results are shown as odds ratios (ORs) with 95 % confidence interval (CI).
A robust locally weighted scatter plot smoothing (LOWESS) method was applied to investigate the rela-tionship between the proportion of deaths (in ICU and in hospital) and plateau pressure, driving pressure, peak inspiratory pressure, and PaO2/FiO2 ratio on the first day of ARDS. The smoothing curves used a bandwidth of 0.66, a polynomial regression with 1 degree of freedom, and a tricubic weight function so that observations fur-thest from the point of interest were assigned the least weight.
All P-values were two-sided, with P-values less than 0.05 considered as statistically significant. The study pro-tocol and case report form are included in Appendix 3. Statistical analyses were performed with R, version 3.0.2 (R Project for Statistical Computing, http://www.R-pro-ject.org) and SAS software, version 9.4 (SAS Institute, Cary, NC, USA).
Results
As previously reported [2], 459 participating ICUs from 50 countries enrolled 4499 patients with AHRF to the LUNG SAFE study. This analysis is confined to the 2377 patients invasively ventilated and with ARDS diagnosed on day 1 (n = 2243) or day 2 (n = 134) following develop-ment of AHRF (Fig. 1). In-hospital mortality was 35 % in patients with mild ARDS, 40 % in moderate ARDS, and 46 % in severe ARDS.
Factors contributing to outcome from ARDS
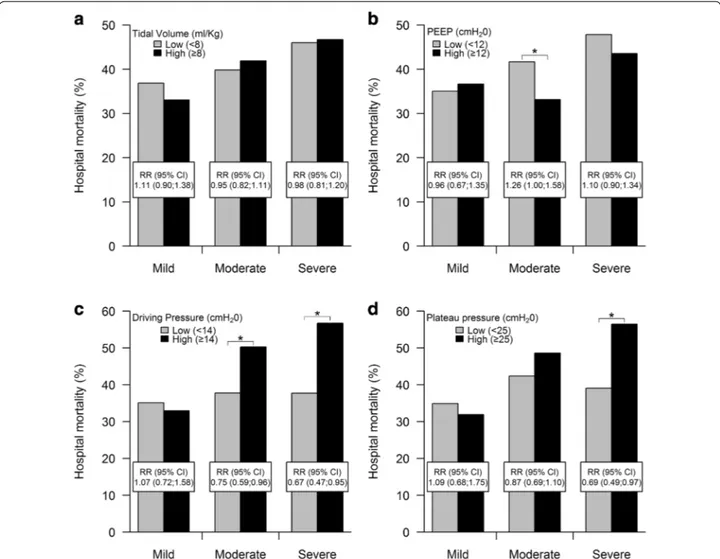
Table 1 reports the comparison of ARDS survivors (59.6 %) to non-survivors (40.4 %) at hospital discharge. The range of tidal volumes used was relatively narrow (Fig. e1) and the mean tidal volume used did not dif-fer between survivors and non-survivors (Table 1). The unadjusted impact of ventilation-related variables in each severity category of ARDS is shown in Fig. 2. Hos-pital mortality risk was similar in patients with lower tidal volume [<8 cmH2O ml/kg predicted body weight (PBW)] compared to those with higher tidal volume (Fig. 2a). In patients with moderate ARDS, patients with a lower PEEP (<12 cmH2O) had a risk of hospital mor-tality 26 % greater than those observed in patients with higher PEEP [RR 1.26 (95 % CI 1.00–1.58)] (Fig. 2b). This
was not seen in mild or severe ARDS. Lower driving pressure (<14 cmH2O) was associated with a decreased risk of hospital mortality in patients with moderate [RR 0.75 (95 % CI 0.59–0.96)] and severe [RR 0.67 (95 % CI 0.47–0.95)] ARDS, respectively (Fig. 2c). Lower plateau pressure (<25 cmH2O) was associated with a decreased risk of hospital mortality in patients with severe ARDS [RR 0.69 (95 % CI 0.49–0.97)] (Fig. 2d). The relationships between tidal volume, PEEP, driving and plateau pres-sures and ICU mortality are shown in Fig. e2.
The factors included in the bivariable analyses for hospital mortality are listed in Table e1. In subsequent multivariate analyses, older age, active neoplasm, hema-tologic neoplasm, immunosuppression, and chronic liver failure were associated with increased hospital mortal-ity (Table 2). Outcome was independent of pulmonary versus extrapulmonary etiology of ARDS (Table e1). Ill-ness severity factors associated with worse outcome comprised lower pH, lower PaO2/FiO2 ratio, and higher non-pulmonary sequential organ failure assessment (SOFA) score (Table 2). Ventilation parameters includ-ing lower respiratory rate, higher PEEP, and lower peak inspiratory pressure were each associated with decreased hospital mortality. Tidal volume was not associated with outcome. A greater number of ICU beds was associ-ated with improved hospital survival, but not ICU sur-vival (Table e2). Similar findings were seen in analyses of factors associated with 28-day and with ICU survival (Tables e2 and e3). In multivariate analyses confined to patients who had “true” plateau pressure measured, i.e., those in whom there was no evidence for spontaneous ventilation (N = 742 patients), both higher driving pres-sure and higher plateau prespres-sure were independently associated with worse hospital survival (Tables e4 and e5).
Patients with a driving pressure of equal to or greater than the median value 14 cmH2O on day 1 of ARDS cri-teria had a higher mortality (P = 0.0124, log-rank test) (Fig. e3a). Patients with a plateau pressure equal to or greater than the median value of 23 cmH2O on day 1 of ARDS criteria had a higher mortality (P = 0.0024, log-rank test) (Fig. e3b). There was no difference in survival in patients with a tidal volume of equal to or greater than the median value of 7.1 ml/kg/PBW (Fig. e3c).
Relationship between ventilator variables and outcome
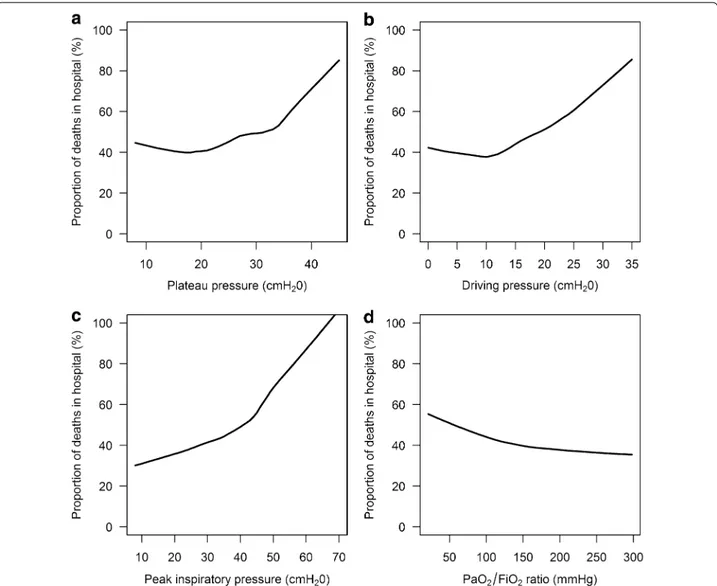
Figure 3 shows the relationship between ventilation parameters on the first day of ARDS and the propor-tion of in-hospital deaths using LOWESS plots. The slope of the curves for risk of mortality increase at plateau pressures above 20 cmH2O and again above 30 cmH2O (Figs. 3a and e4a). For plateau pressures below 20 cmH2O, there was no clear relationship with
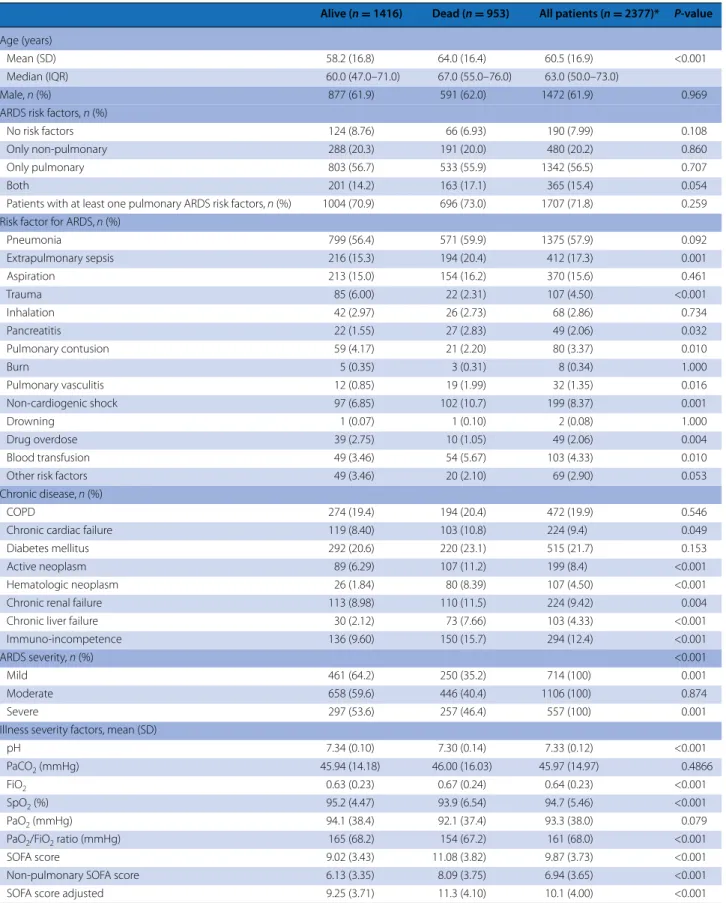
Table 1 Comparison of survivors versus non-survivors at hospital discharge in invasively ventilated patients with ARDS (n = 2377)
Alive (n = 1416) Dead (n = 953) All patients (n = 2377)* P-value
Age (years)
Mean (SD) 58.2 (16.8) 64.0 (16.4) 60.5 (16.9) <0.001
Median (IQR) 60.0 (47.0–71.0) 67.0 (55.0–76.0) 63.0 (50.0–73.0)
Male, n (%) 877 (61.9) 591 (62.0) 1472 (61.9) 0.969
ARDS risk factors, n (%)
No risk factors 124 (8.76) 66 (6.93) 190 (7.99) 0.108
Only non-pulmonary 288 (20.3) 191 (20.0) 480 (20.2) 0.860
Only pulmonary 803 (56.7) 533 (55.9) 1342 (56.5) 0.707
Both 201 (14.2) 163 (17.1) 365 (15.4) 0.054
Patients with at least one pulmonary ARDS risk factors, n (%) 1004 (70.9) 696 (73.0) 1707 (71.8) 0.259 Risk factor for ARDS, n (%)
Pneumonia 799 (56.4) 571 (59.9) 1375 (57.9) 0.092 Extrapulmonary sepsis 216 (15.3) 194 (20.4) 412 (17.3) 0.001 Aspiration 213 (15.0) 154 (16.2) 370 (15.6) 0.461 Trauma 85 (6.00) 22 (2.31) 107 (4.50) <0.001 Inhalation 42 (2.97) 26 (2.73) 68 (2.86) 0.734 Pancreatitis 22 (1.55) 27 (2.83) 49 (2.06) 0.032 Pulmonary contusion 59 (4.17) 21 (2.20) 80 (3.37) 0.010 Burn 5 (0.35) 3 (0.31) 8 (0.34) 1.000 Pulmonary vasculitis 12 (0.85) 19 (1.99) 32 (1.35) 0.016 Non-cardiogenic shock 97 (6.85) 102 (10.7) 199 (8.37) 0.001 Drowning 1 (0.07) 1 (0.10) 2 (0.08) 1.000 Drug overdose 39 (2.75) 10 (1.05) 49 (2.06) 0.004 Blood transfusion 49 (3.46) 54 (5.67) 103 (4.33) 0.010
Other risk factors 49 (3.46) 20 (2.10) 69 (2.90) 0.053
Chronic disease, n (%)
COPD 274 (19.4) 194 (20.4) 472 (19.9) 0.546
Chronic cardiac failure 119 (8.40) 103 (10.8) 224 (9.4) 0.049
Diabetes mellitus 292 (20.6) 220 (23.1) 515 (21.7) 0.153
Active neoplasm 89 (6.29) 107 (11.2) 199 (8.4) <0.001
Hematologic neoplasm 26 (1.84) 80 (8.39) 107 (4.50) <0.001
Chronic renal failure 113 (8.98) 110 (11.5) 224 (9.42) 0.004
Chronic liver failure 30 (2.12) 73 (7.66) 103 (4.33) <0.001
Immuno-incompetence 136 (9.60) 150 (15.7) 294 (12.4) <0.001
ARDS severity, n (%) <0.001
Mild 461 (64.2) 250 (35.2) 714 (100) 0.001
Moderate 658 (59.6) 446 (40.4) 1106 (100) 0.874
Severe 297 (53.6) 257 (46.4) 557 (100) 0.001
Illness severity factors, mean (SD)
pH 7.34 (0.10) 7.30 (0.14) 7.33 (0.12) <0.001
PaCO2 (mmHg) 45.94 (14.18) 46.00 (16.03) 45.97 (14.97) 0.4866
FiO2 0.63 (0.23) 0.67 (0.24) 0.64 (0.23) <0.001
SpO2 (%) 95.2 (4.47) 93.9 (6.54) 94.7 (5.46) <0.001
PaO2 (mmHg) 94.1 (38.4) 92.1 (37.4) 93.3 (38.0) 0.079
PaO2/FiO2 ratio (mmHg) 165 (68.2) 154 (67.2) 161 (68.0) <0.001
SOFA score 9.02 (3.43) 11.08 (3.82) 9.87 (3.73) <0.001
Non-pulmonary SOFA score 6.13 (3.35) 8.09 (3.75) 6.94 (3.65) <0.001
hospital or ICU mortality. Mortality was relatively flat up to a driving pressure of 10 cmH2O; above this value, mortality increased relatively linearly with increasing driving pressure (Figs. 3b and e4b). In contrast, while the slope of the curve of peak inspiratory pressure ver-sus mortality increased at values over 40 cmH2O, the curve did not flatten out below this value (Figs. 3c and e4c). For PaO2/FiO2 ratio, the relationship with mortal-ity risk was relatively flat at ratios above 150 mmHg, but mortality risk increased at lower PaO2/FiO2 ratios (Figs. 3d and e4d).
Limitation of life‑sustaining therapies or measures
Of the 578 (24.3 %) patients with a limitation of life-sus-taining therapies or measures decision, 7 patients (1.2 %) had this decision in place prior to developing ARDS, while in 525 (90.8 %) patients, this decision was made at or after the development of ARDS. In 46 (8.0 %) patients, the timing of the decision was unclear (Fig. e5). Six of the seven patients with prior limitation of life-sustaining therapies or measures decision survived to hospital dis-charge. Overall, 498 (86 %) of patient with orders limiting care died in hospital.
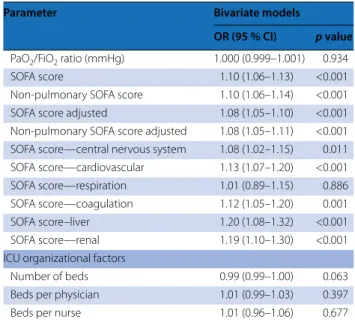
In a bivariate analysis, increased age, immunosup-pression, the presence of active or hematologic neo-plasm, and chronic liver failure were each associated with increased likelihood of limitation of life-sustaining therapies or measures (Table 3). Disease severity factors including lower pH and higher adjusted non-pulmonary SOFA score were also associated with limitation of life-sustaining therapies or measures.
Discussion
The LUNG SAFE study is the largest epidemiologic study of patients with ARDS and acute hypoxic respiratory fail-ure to date, with data on patients admitted to 459 ICUs in 50 countries across five continents. We found that older patient age, presence of neoplastic disease, and severity of illness markers such as lower pH, lower PaO2/FiO2 ratio, and higher non-pulmonary SOFA scores were asso-ciated with worsened patient outcome. Potentially modi-fiable factors associated with increased hospital mortality in multivariable analyses include lower PEEP, higher peak inspiratory, plateau, and driving pressures, increased res-piratory rate, and lower number of ICU beds.
Factors contributing to outcome from ARDS
Our finding that older age was independently associated with worse outcome is in accord with multiple prior stud-ies [6–8], and with prognosis scores such as the simplified acute physiology score (SAPS). The presence of risk fac-tors such as active neoplasm, hematologic neoplasm, and chronic liver failure independently worsened outcome, and are largely consistent with prior studies [8, 9]. Severity of ill-ness factors associated with worse outcome included lower pH, lower PaO2/FiO2 ratio, and increasing non-pulmonary SOFA score [8]. The lack of association between risk factor type, i.e., pulmonary versus extrapulmonary, and outcome from ARDS contrasts with some previous smaller studies [10], but is consistent with a prior meta-analysis [11].
We found that key aspects of ventilator management were associated with patient outcome. The use of higher PEEP in patients with moderate or severe ARDS was Inclusion criteria: ARDS onset within 48 h from AHRF; patients received invasive mechanical ventilation in the first 48 h from ARDS onset
All clinical parameters were measured at ARDS onset
ARDS acute respiratory distress syndrome, COPD chronic obstructive pulmonary disease, SOFA sequential organ failure assessment, RR respiratory rate, PEEP positive end-expiratory pressure, PBW predicted body weight, SD standard deviation, IQR interquartile range
* Vital status was evaluated at hospital discharge or at 90 days after onset of AHRF, which ever event occurred first. This information was missing for 8 patients (0.3 %) Table 1 continued
Alive (n = 1416) Dead (n = 953) All patients (n = 2377)* P-value
Non-pulmonary SOFA score adjusted 6.06 (3.62) 8.09 (4.11) 6.87 (3.95) <0.001
SOFA score—central nervous system 1.98 (1.63) 2.31 (1.69) 2.12 (1.66) <0.001
SOFA score—cardiovascular 1.95 (1.71) 2.63 (1.68) 2.23 (1.73) <0.001
SOFA score—respiration 2.88 (0.72) 3.01 (0.73) 2.93 (0.73) <0.001
SOFA score—coagulation 0.90 (1.28) 1.23 (1.40) 1.04 (1.34) <0.001
SOFA score—liver 0.51 (0.91) 0.75 (1.12) 0.60 (1.01) <0.001
SOFA score—renal 0.67 (1.08) 1.05 (1.19) 0.82 (1.14) <0.001
Management factors, mean (SD)
RR total (breaths/min) 20.3 (6.43) 21.6 (11.1) 20.8 (8.64) <0.001
PEEP (cm H2O) 8.49 (3.34) 8.36 (3.34) 8.44 (3.34) 0.243
Peak inspiratory pressure (cmH2O) 26.5 (8.10) 27.9 (8.22) 27.0 (8.18) <0.001
Tidal volume/PBW (mL/kg) 7.65 (1.87) 7.56 (1.90) 7.61 (1.88) 0.366
independently associated with improved hospital sur-vival, supporting prior findings from an individual patient data meta-analysis [12], as well as a preponderance of preclinical evidence suggesting benefits with higher PEEP particularly in more severe ARDS.
The lack of a relationship between tidal volume and outcome in our patients likely reflects the relatively lim-ited range of tidal volumes used, which was concentrated in a range around a median of 7.1 ml/kg. In particular, the use of tidal volumes below 6 or above 10 ml/kg PBW was relatively low in these patients. In addition, there may be
a potential confounding effect of the use of lower tidal volumes in more severely ill patients, which is difficult to fully dissect out in an observational dataset such as this. Our data does not imply that tidal volume is unim-portant, but rather suggests the widespread adoption of lower tidal volume ventilation. We know from large well-conducted prospective randomized clinical trials that reducing tidal volume is a key component of protective lung ventilation and saves lives [3, 13].
The association between peak, plateau, and driv-ing pressures and both hospital and ICU outcome also
Fig. 2 Relationship between lower versus higher tidal volume, PEEP, driving pressure, and plateau pressure and hospital mortality. a There was no
relationship between lower (<8 ml/kg PBW) versus higher (≥8 ml/kg PBW) tidal volume and hospital mortality in patients with mild, moderate, or severe ARDS. b In patients with moderate ARDS, lower PEEP (i.e., PEEP <12 cmH2O) was associated with increased hospital mortality. This was not
seen in mild or severe ARDS. c In patients with moderate and severe ARDS, higher driving pressure (i.e., ≥14 cmH2O) was associated with increased
hospital mortality. This was not seen in mild ARDS. d In patients with severe ARDS, higher plateau pressure (i.e., ≥25 cmH2O) was associated with
increased hospital mortality. This was not seen in mild or moderate ARDS. *P -value < 0.05, comparison between risks. Mortality is defined as mor-tality at hospital discharge or at 90 days after onset of AHRF, which ever event occurred first. All clinical independent parameters were measured at ARDS onset. Driving pressure analysis confined to patients in whom plateau pressure was measured and in whom there was no evidence of spon-taneous ventilation (N = 742 patients). All other analyses completed on the entire patient dataset (n = 2377 patients). RR relative risk, CI confidence interval
confirms prior findings [14]. The finding of a positive association between lower respiratory rate and patient outcome is a novel finding, and is supported by prior experimental data [15, 16]. This finding may support the hypothesis that energy transfer to the lung is an impor-tant contributor to ventilator-induced lung injury [17,
18].
Relationships between ventilatory parameters and outcome
The LOWESS curve of the relationship between pla-teau pressure and the risk of ICU and hospital death did appear to flatten out below 20 cmH2O. This finding contrasts with that of Hager et al., who did not find a lower “safe” plateau pressure [19]. In relation to driving pressure, the proportion of deaths increased relatively linearly at pressures above 10 cmH2O, while the curve is flat below this value. These findings are suggestive of
the potential utility of this index as a prognostic index in non-trial, “real world” patients [14]. It is important to note that we classified driving pressure and plateau pres-sures as potentially modifiable but they also contain an important element that depends on the patient’s lung injury severity. The inflection in the relationship between PaO2/FiO2 ratio and mortality observed at values around 120–150 mmHg supports the empirical decisions of selecting these value for enrollment in clinical trials [20] or secondary analyses [21].
The finding that lower ICU bed number was associated with higher hospital, but not ICU, mortality is of con-cern. It suggests that ICU organizational factors and/or resource constraints may impact on ICU discharge deci-sions, and hence on patient outcome. It supports older studies demonstrating that patients discharged from ICU at times of high bed occupancy are sicker and have had a shorter ICU stay than patients discharged when more Table 2 Factors associated with hospital mortality in invasively ventilated patients (n = 2377)
The term ref. indicates the reference group useful to interpret the model parameter and the estimate of odds ratio
Hospital mortality is defined as mortality at hospital discharge or at 90 days after onset of AHRF, which ever event occurred first. This information was missing for 8 patients (0.3 %)
Inclusion criteria: ARDS onset within 48 h from AHRF; patients received invasive mechanical ventilation in the first 48 h from ARDS onset All clinical independent parameters (pH, FiO2, SOFA score, etc.) were measured at ARDS onset
PaCO2 not included in stepwise selection process for this analysis. SpO2, SOFA score, non-pulmonary SOFA score not included in stepwise selection because there were many missing values (35.6, 42.3, and 42.3 %, respectively)
ARDS acute respiratory distress syndrome, SOFA sequential organ failure assessment, RR respiratory rate, PEEP positive end-expiratory pressure, ICU intensive care unit, OR odds ratio, CI confidence interval
Parameter Multivariate model (n = 2091)
OR (95 % CI) p-value
Demographic factors
Age 1.03 (1.019–1.032) <0.001
Risk factors Active neoplasm
Yes (ref. no) 1.83 (1.31–2.57) <0.001
Immunosuppression
Yes (ref. no) 1.42 (1.04–1.93) 0.027
Hematologic neoplasm
Yes (ref. no) 4.77 (2.82–8.04) <0.001
Chronic liver failure
Yes (ref. no) 3.28 (1.99–5.40) <0.001
Illness severity factors
pH 0.12 (0.05–0.29) <0.001
PaO2/FiO2 ratio (mmHg) 0.998 (0.997–1.000) 0.025
Non-pulmonary SOFA score adjusted 1.12 (1.09–1.15) <0.001
Management factors
RR total (breaths/min) 1.03 (1.01–1.04) 0.003
PEEP (cmH2O) 0.95 (0.92–0.98) 0.001
Peak inspiratory pressure (cmH2O) 1.02 (1.01–1.04) 0.002
ICU organizational factors
beds were available [22]. Prior studies also demonstrate that a significant proportion of patients that die in hos-pital following ICU discharge were expected to live at the time of ICU discharge [23, 24].
Limitation of life-sustaining therapies or measures
The majority of decisions to limit care were made after development of ARDS. Interestingly, survival in the small proportion of patient that had a limitation of life-sustain-ing therapies or measures decision prior to developlife-sustain-ing ARDS was surprisingly high. Less surprising was the fact that 86 % of patients in whom decisions to limit care were
made after the development of ARDS died in hospital. Increased age and the presence of active or hematologic neoplasm, immune suppression, chronic liver failure, and indices of greater illness severity were associated with lim-itation of life-sustaining therapies or measures, consistent with prior findings [25]. Overall, there were similarities between the factors associated with patient outcome and those associated with limitation of life-sustaining thera-pies or measures. This may be consistent with the fact that death in the ICU not infrequently occurs in the context of decisions to limit life-sustaining therapies or measures as a result of perceived futility [26, 27].
Fig. 3 Relationship between ventilation parameters and hospital mortality. Robust locally weighted regression and smoothing (LOWESS) plot
(bandwidth 2/3, 1 degree of polynomial regression) of hospital mortality and plateau pressure (a), driving pressure (b), peak inspiratory pressure (c), and PaO2/FiO2 ratio (d) measured on the first day of ARDS onset. Mortality is defined as mortality at hospital discharge or at 90 days after onset
of AHRF, which ever event occurred first. All clinical independent parameters were measured at ARDS onset. Plateau pressure and driving pressure analyses confined to patients in whom plateau pressure was measured and in whom there was no evidence of spontaneous ventilation (N = 742 patients). All other analyses completed on the entire patient dataset (n = 2377 patients)
Limitations
This study has a number of limitations. Our focus on winter months, while allowing us to examine the burden of ARDS during the same season across the globe, and our convenience sample approach may be prone to selec-tion biases that may limit generalizability in regard to factors associated with ARDS outcome. Similar to other epidemiologic studies, we did not have access to the source data for the patients in the enrolling ICUs, and it is possible that some patients with hypoxemia, and thus ARDS, in participating centers were missed. It is impor-tant to stress, however, that ICUs were participating whether or not they identified any patient having ARDS and that the diagnosis of ARDS was not based on chart records. In addition, enrollment of patients with ARDS from participating ICUs met expectations based on their recorded 2013 admission rates, while data from lower recruiting ICUs were not different from higher enrolling ICUs, suggesting the absence of reporting biases. While we classified ventilator-related variables as potentially modifiable, it is important to acknowledge that non-modifiable factors, particularly disease severity, also play an important role in ventilator settings. In addition, we did not ask investigators how they measured total PEEP, and it is possible that total PEEP was not measured after Table 3 Bivariate logistic regression analysis of factors
associated with limitation of life-sustaining therapies or measures in invasively ventilated patients (n = 2377)
Parameter Bivariate models
OR (95 % CI) p value Demographic factors
Age (years) 1.03 (1.02–1.03) <0.001
Gender
Male (ref. female) 0.95 (0.79–1.16) 0.626
Risk factors
Pulmonary ARDS risk factors
Yes (ref. no) 1.01 (0.82–1.25) 0.922
Pneumonia
Yes (ref. no) 1.04 (0.87–1.25) 0.724
Non-pulmonary ARDS risk factors
Yes (ref. no) 0.99 (0.78–1.25) 0.932
Non-pulmonary sepsis
Yes (ref. no) 1.24 (0.97–1.57) 0.081
No ARDS risk factors
Yes (ref. no) 0.99 (0.70–1.41) 0.972
ARDS risk factors
Only pulmonary (ref. none) 1.00 (0.67–1.48) 0.991 Only non-pulmonary (ref. none) 1.01 (0.71–1.44) 0.963
Both (ref. none) 1.01 (0.67–1.52) 0.964
COPD
Yes (ref. no) 1.05 (0.83–1.32) 0.697
Diabetes mellitus
Yes (ref. no) 1.07 (0.85–1.34) 0.580
Chronic renal failure
Yes (ref. no) 1.34 (0.99–1.81) 0.060
Active neoplasm
Yes (ref. no) 1.70 (1.25–2.31) 0.001
Immunosuppression
Yes (ref. no) 1.71 (1.31–2.23) <0.001
Hematologic neoplasm
Yes (ref. no) 2.37 (1.59–3.51) <0.001
Chronic heart failure
Yes (ref. no) 1.28 (0.94–1.73) 0.120
Chronic liver failure
Yes (ref. no) 2.53 (1.70–3.79) <0.001
Home ventilation
Yes (ref. no) 0.97 (0.45–2.05) 0.928
Active or hematologic neoplasm or immunosuppression
Yes (ref. no) 1.72 (1.38–2.13) <0.001
COPD or home ventilation
Yes (ref. no) 1.06 (0.84–1.33) 0.628
Illness severity factors
pH 0.21 (0.10–0.45) <0.001
FiO2 0.87 (0.59–1.31) 0.509
SpO2 (%) 0.99 (0.97–1.01) 0.213
PaO2 (mmHg) 0.998 (0.996–1.001) 0.222
Table 3 continued
Parameter Bivariate models
OR (95 % CI) p value PaO2/FiO2 ratio (mmHg) 1.000 (0.999–1.001) 0.934
SOFA score 1.10 (1.06–1.13) <0.001
Non-pulmonary SOFA score 1.10 (1.06–1.14) <0.001
SOFA score adjusted 1.08 (1.05–1.10) <0.001
Non-pulmonary SOFA score adjusted 1.08 (1.05–1.11) <0.001 SOFA score—central nervous system 1.08 (1.02–1.15) 0.011 SOFA score—cardiovascular 1.13 (1.07–1.20) <0.001
SOFA score—respiration 1.01 (0.89–1.15) 0.886
SOFA score—coagulation 1.12 (1.05–1.20) 0.001
SOFA score–liver 1.20 (1.08–1.32) <0.001
SOFA score—renal 1.19 (1.10–1.30) <0.001
ICU organizational factors
Number of beds 0.99 (0.99–1.00) 0.063
Beds per physician 1.01 (0.99–1.03) 0.397
Beds per nurse 1.01 (0.96–1.06) 0.677
The term ref. indicates the reference group useful to interpret the model parameter and the estimate of odds ratio
Inclusion criteria: ARDS onset within 48 h from AHRF; patients received invasive mechanical ventilation in the first 48 h from ARDS onset
All clinical independent parameters were measured at ARDS onset
ARDS acute respiratory distress syndrome, COPD chronic obstructive pulmonary disease, SOFA sequential organ failure assessment, RR respiratory rate, PEEP positive end-expiratory pressure, ICU intensive care unit, OR odds ratio, CI confidence interval
end-expiratory occlusion in some patients, which may have led to an overestimation of plateau and driving pres-sure in some patients. To enpres-sure data quality, we insti-tuted a robust data quality control program in which all centers were requested to verify data that appeared inconsistent or erroneous. The absence of data on other aspects of ICU management, e.g., fluid therapy, may limit the conclusions that can be drawn. Lastly, our assump-tions that patients discharged from the hospital before day 28 were alive at that time point and that inpatients at day 90 survived to hospital discharge are further limitations.
Conclusions
In this prospective study carried out in ICUs across 50 countries, potentially modifiable factors associated with increased hospital mortality in multivariable analyses include lower PEEP, higher peak inspiratory, plateau and driving pressures, increased respiratory rate, and a lower number of ICU beds. These findings provide insight into current management practices in relation to ARDS and relationships between modifiable and non-modifiable factors and patient outcome from ARDS.
Electronic supplementary material
The online version of this article (doi:10.1007/s00134-016-4571-5) contains supplementary material, which is available to authorized users.
Author details
1 Departments of Anesthesia and Critical Care Medicine, Keenan Research
Centre for Biomedical Science, St Michael’s Hospital, Toronto, Canada.
2 Departments of Anesthesia, Physiology, Interdepartmental Division
of Critical Care Medicine, University of Toronto, Toronto, Canada. 3 School
of Medicine and Surgery, University of Milan-Bicocca, Monza, Italy. 4
Depart-ment of Emergency and Intensive Care, San Gerardo Hospital, Monza, Italy.
5 AP-HP, Hôpital Tenon, Unité de Réanimation médico-chirurgicale, Pôle
Thorax Voies aériennes, Groupe hospitalier des Hôpitaux Universitaires de l’Est Parisien, Paris, France. 6 UMR 1153, Inserm, Sorbonne Paris Cité, ECSTRA Team,
Université Paris Diderot, Paris, France. 7 UMR 915, Inserm, Université Paris Est
Créteil, Créteil, France. 8 Department of Medicine, University Health Network,
Mount Sinai Hospital, Toronto, Canada. 9 Interdepartmental Division of Critical
Care Medicine and Institute of Health Policy, Management and Evaluation, University of Toronto, Toronto, Canada. 10 Research Center on Public Health,
School of Medicine and Surgery, University of Milano-Bicocca, Monza, Italy.
11 Division of Pulmonary and Critical Care Unit, Department of Medicine,
Massachusetts General Hospital, Harvard Medical School, Boston, MA, USA.
12 Keenan Research Centre, Li Ka Shing Knowledge Institute, St Michael’s
Hos-pital, Toronto, Canada. 13 Interdepartmental Division of Critical Care Medicine,
University of Toronto, Toronto, Canada. 14 Department of Anaesthesia, National
University of Ireland, Galway University Hospitals, Galway, Ireland. 15 Hospital
Universitario de Getafe, CIBER de Enfermedades Respiratorias, Madrid, Spain.
16 Department of Anesthesiology, Emergency and Intensive Care Medicine
Universitätsmedizin Göttingen, Robert Koch Strasse 40, 37073 Göttingen, Ger-many. 17 Intensive Care Unit, The Canberra Hospital, Australian National
Univer-sity, Canberra, Australia. 18 Department of Intensive Care Medicine, Radboud
University Medical Center, Nijmegen, The Netherlands. 19 Department of
Anes-thesiology, Yokohama City University Medical Center, Kanagawa, Japan.
20 Division of Critical Care, Department of Anaesthesiology, Rikshospitalet
Medical Centre, Oslo University Hospital, Oslo, Norway. 21 Section of
Anesthesi-ology and Intensive Care, Department of Surgical Sciences, Uppsala University, Uppsala, Sweden. 22 Centre for Experimental Medicine, Queen’s University
of Belfast, Wellcome-Wolfson Institute for Experimental Medicine, Belfast and Regional Intensive Care Unit, Royal Victoria Hospital, Grosvenor Road,
Belfast, Northern Ireland, UK. 23 Department of Critical Care Medicine, Nanjing
Zhongda Hospital, School of Medicine, Southeast University, Nanjing 210009, People’s Republic of China. 24 SAPIENZA Università di ROMA, Dipartimento
di Anestesia e Rianimazione, Policlinico Umberto I, Viale del Policlinico 155, 00161 Rome, Italy. 25 Interdepartmental Division of Critical Care Medicine,
University of Toronto and Program in Trauma, Emergency and Critical Care, Sunnybrook Health Sciences Center, Toronto, Canada. 26 Department of
Anes-thesiology and Intensive Care Medicine, University of Leipzig, 04103 Leip-zig, Germany. 27 Department of Medicine, University of Toronto, Toronto,
Canada. 28 Dipartimento di Anestesia, Rianimazione ed Emergenza Urgenza,
Fondazione IRCCS Cà Granda-Ospedale Maggiore Policlinico, Toronto, Canada.
29 Dipartimento di Fisiopatologia Medico-Chirurgica e dei Trapianti, Università
degli Studi di Milano, Milan, Italy. Acknowledgments
Funding/support: This work was funded and supported by the European Society of Intensive Care Medicine (ESICM), Brussels, Belgium, by St Michael’s Hospital, Toronto, Canada, and by the University of Milan-Bicocca, Monza, Italy.
Role of the funders: The ESICM provided support in data collection and study coordination. ESICM, St Michael’s Hospital, and University of Milan-Bicocca had no role in the design and conduct of the study; management, analysis, and interpretation of the data; preparation, review, or approval of the manuscript; or decision to submit the manuscript for publication.
Compliance with ethical standards Conflicts of interest
The authors attest that they have no conflicts of interest in regard to the subject of this manuscript.
Received: 6 July 2016 Accepted: 22 September 2016 Published online: 18 October 2016
References
1. Ranieri VM, Rubenfeld GD, Thompson BT, Ferguson ND, Caldwell E, Fan E, Camporota L, Slutsky AS (2012) Acute respiratory distress syndrome: the Berlin definition. JAMA 307:2526–2533
2. Bellani G, Laffey JG, Pham T, Fan E, Brochard L, Esteban A, Gattinoni L, van Haren F, Larsson A, McAuley DF, Ranieri M, Rubenfeld G, Thompson BT, Wrigge H, Slutsky AS, Pesenti A, LUNG SAFE Investigators, ESICM Trials Group (2016) Epidemiology, patterns of care, and mortality for patients with acute respiratory distress syndrome in intensive care units in 50 countries. JAMA 315:788–800
3. The Acute Respiratory Distress Syndrome Network (2000) Ventilation with lower tidal volumes as compared with traditional tidal volumes for acute lung injury and the acute respiratory distress syndrome. N Engl J Med 342:1301–1308
4. Amato MB, Meade MO, Slutsky AS, Brochard L, Costa EL, Schoenfeld DA, Stewart TE, Briel M, Talmor D, Mercat A, Richard JC, Carvalho CR, Brower RG (2015) Driving pressure and survival in the acute respiratory distress syndrome. N Engl J Med 372:747–755
5. Fanelli V, Ranieri MV, Mancebo J, Moerer O, Quintel M, Morley S, Moran I, Parrilla F, Costamagna A, Gaudiosi M, Combes A (2016) Feasibility and safety of low-flow extracorporeal carbon dioxide removal to facilitate ultra-protective ventilation in patients with moderate acute respiratory distress sindrome. Crit Care 20:36
6. Rubenfeld GD, Caldwell E, Peabody E, Weaver J, Martin DP, Neff M, Stern EJ, Hudson LD (2005) Incidence and outcomes of acute lung injury. N Engl J Med 353:1685–1693
7. Rubenfeld GD, Herridge MS (2007) Epidemiology and outcomes of acute lung injury. Chest 131:554–562
8. Brun-Buisson C, Minelli C, Bertolini G, Brazzi L, Pimentel J, Lewandowski K, Bion J, Romand JA, Villar J, Thorsteinsson A, Damas P, Armaganidis A, Lemaire F (2004) Epidemiology and outcome of acute lung injury in Euro-pean intensive care units. Results from the ALIVE study. Intensive Care Med 30:51–61
9. Gong MN, Thompson BT, Williams P, Pothier L, Boyce PD, Christiani DC (2005) Clinical predictors of and mortality in acute respiratory
distress syndrome: potential role of red cell transfusion. Crit Care Med 33:1191–1198
10. Kim SJ, Oh BJ, Lee JS, Lim CM, Shim TS, Lee SD, Kim WS, Kim DS, Kim WD, Koh Y (2004) Recovery from lung injury in survivors of acute respiratory distress syndrome: difference between pulmonary and extrapulmonary subtypes. Intensive Care Med 30:1960–1963
11. Agarwal R, Srinivas R, Nath A, Jindal SK (2008) Is the mortality higher in the pulmonary vs the extrapulmonary ARDS? A meta analysis. Chest 133:1463–1473
12. Briel M, Meade M, Mercat A, Brower RG, Talmor D, Walter SD, Slutsky AS, Pullenayegum E, Zhou Q, Cook D, Brochard L, Richard JC, Lamontagne F, Bhatnagar N, Stewart TE, Guyatt G (2010) Higher vs lower positive end-expiratory pressure in patients with acute lung injury and acute respiratory distress syndrome: systematic review and meta-analysis. JAMA 303:865–873
13. Amato MB, Barbas CS, Medeiros DM, Magaldi RB, Schettino GP, Lorenzi-Fihlo G, Kairalla RA, Deheinzelin D, Munoz C, Oliveira R, Takagaki TY, Carvalho CR (1998) Effect of a protective-ventilation strategy on mortality in the acute respiratory distress syndrome. N Engl J Med 338:347–354 14. Kregenow DA, Rubenfeld GD, Hudson LD, Swenson ER (2006)
Hypercap-nic acidosis and mortality in acute lung injury. Crit Care Med 34:1–7 15. Vaporidi K, Voloudakis G, Priniannakis G, Kondili E, Koutsopoulos A,
Tsat-sanis C, Georgopoulos D (2008) Effects of respiratory rate on ventilator-induced lung injury at a constant PaCO2 in a mouse model of normal
lung. Crit Care Med 36:1277–1283
16. Grasso S, Stripoli T, Mazzone P, Pezzuto M, Lacitignola L, Centonze P, Guar-racino A, Esposito C, Herrmann P, Quintel M, Trerotoli P, Bruno F, Crovace A, Staffieri F (2014) Low respiratory rate plus minimally invasive extracor-poreal CO2 removal decreases systemic and pulmonary inflammatory
mediators in experimental acute respiratory distress syndrome. Crit Care Med 42:e451–e460
17. Marini JJ (2014) Spontaneous breathing, extrapulmonary CO(2) removal, and ventilator-induced lung injury risk: less power to the people? Crit Care Med 42:758–760
18. Cressoni M, Gotti M, Chiurazzi C, Massari D, Algieri I, Amini M, Cammaroto A, Brioni M, Montaruli C, Nikolla K, Guanziroli M, Dondossola D, Gatti S, Valerio V, Vergani GL, Pugni P, Cadringher P, Gagliano N, Gattinoni L (2016) Mechanical power and development of ventilator-induced lung injury. Anesthesiology 124:1100–1108
19. Hager DN, Krishnan JA, Hayden DL, Brower RG, Network ACT (2005) Tidal volume reduction in patients with acute lung injury when plateau pres-sures are not high. Am J Respir Crit Care Med 172:1241–1245 20. Guerin C, Reignier J, Richard JC, Beuret P, Gacouin A, Boulain T, Mercier
E, Badet M, Mercat A, Baudin O, Clavel M, Chatellier D, Jaber S, Rosselli S, Mancebo J, Sirodot M, Hilbert G, Bengler C, Richecoeur J, Gainnier M, Bayle F, Bourdin G, Leray V, Girard R, Baboi L, Ayzac L (2013) Prone positioning in severe acute respiratory distress syndrome. N Engl J Med 368:2159–2168
21. Papazian L, Forel JM, Gacouin A, Penot-Ragon C, Perrin G, Loundou A, Jaber S, Arnal JM, Perez D, Seghboyan JM, Constantin JM, Courant P, Lefrant JY, Guerin C, Prat G, Morange S, Roch A (2010) Neuromuscular blockers in early acute respiratory distress syndrome. N Engl J Med 363:1107–1116
22. Strauss MJ, LoGerfo JP, Yeltatzie JA, Temkin N, Hudson LD (1986) Ration-ing of intensive care unit services. An everyday occurrence. JAMA 255:1143–1146
23. Goldhill DR, Sumner A (1998) Outcome of intensive care patients in a group of British intensive care units. Crit Care Med 26(8):1337–1345 24. Wallis CB, Davies HT, Shearer AJ (1997) Why do patients die on general
wards after discharge from intensive care units? Anaesthesia 52(1):9–14 25. Lautrette A, Garrouste-Orgeas M, Bertrand PM, Goldgran-Toledano D,
Jamali S, Laurent V, Argaud L, Schwebel C, Mourvillier B, Darmon M, Ruckly S, Dumenil AS, Lemiale V, Souweine B, Timsit JF, Outcomerea Study Group (2015) Respective impact of no escalation of treatment, withholding and withdrawal of life-sustaining treatment on ICU patients’ prognosis: a multicenter study of the Outcomerea Research Group. Intensive Care Med 41:1763–1772
26. Downar J, Delaney JW, Hawryluck L, Kenny L (2016) Guidelines for the withdrawal of life-sustaining measures. Intensive Care Med 42:1003–1017 27. Phua J, Joynt GM, Nishimura M, Deng Y, Myatra SN, Chan YH, Binh NG, Tan CC, Faruq MO, Arabi YM, Wahjuprajitno B, Liu SF, Hashemian SM, Kashif W, Staworn D, Palo JE, Koh Y, ACME Study Investigators, Asian Critical Care Clinical Trials Group (2016) Withholding and withdrawal of life-sustaining treatments in low-middle-income versus high-income Asian countries and regions. Intensive Care Med 42:1118–1127