Università degli Studi di Ferrara
DOTTORATO DI RICERCA IN
SCIENZE BIOMEDICHE
CICLO XXVII
COORDINATORE Prof. Capitani Silvano
Electrophysiological analysis of
voltage-dependent currents in two types of
periglomerular cells in the mouse olfactory bulb
Settore Scientifico Disciplinare BIO/09
Dottorando Tutore
Dott. Fogli Iseppe Alex Prof. Belluzzi Ottorino
Table of contents
Introduction ... 1
Olfactory Bulb ... 5
Structure ... 5
Cellular heterogeneity in the glomerulus ... 7
TH-positive PG cells ... 9 CR-positive PG cells ... 11 h-current ... 13 Historical notes ... 13 HCN channels... 14 Structure ... 14
Basic biophysical properties ... 17
Ion selectivity ... 17
Modulation by cAMP ... 18
Pharmacology ... 18
Functional properties of Ih ... 20
Resting membrane potential control ... 20
Dendritic integration ... 20
Spontaneous activity ... 20
Synaptic transmission ... 21
Materials and Methods ... 22
Animals ... 23
Ethical statement... 23
Surgical procedures ... 23
Recording conditions ... 24
Patch clamp technique ... 25
Solutions ... 26
Data analysis ... 28
Results ... 29
Identification ... 30
Basic properties ... 32
Effect of temperature ... 34
Blockers ... 35
Role in autorhythmicity... 36
Modulation by intracellular cAMP ... 36
Modulation by neurotransmitters ... 37
Fast transient sodium current in CR-positive PG cells ... 46
Activation ... 46
Inactivation ... 47
Deactivation ... 48
A-type potassium current in CR-positive PG cells ... 50
Activation ... 50
Inactivation ... 51
Deactivation ... 52
L-type calcium current in CR-positive PG cells ... 54
Barium substitution ... 55
Cadmium block ... 56
Nifedipine block ... 56
Discussion... 57
Dopaminergic periglomerular cells ... 58
CR-positive periglomerular cells ... 62
Conclusion ... 63
Abbreviations ... 66
1
2
From the beginning, every life form necessitates to process information from the external environment in order to survive. For this purpose, chemical senses arose and, in the course of time, developed to be able to identify a very large range of different chemical molecules.
Olfaction is probably the most ancient member belonging to this group of senses. Its aim is to acquire the greatest number possible of data about the quantity and quality of external chemicals, termed odorants. Consequently, a great number of physiological responses can be elicited. Olfactory stimuli are involved in universal basic functions like feeding and reproduction. In addition, social behaviors, as clan or mother-infant recognition, are also influenced by sense of smell. Nonetheless, most of its fundamental processes are still unknown.
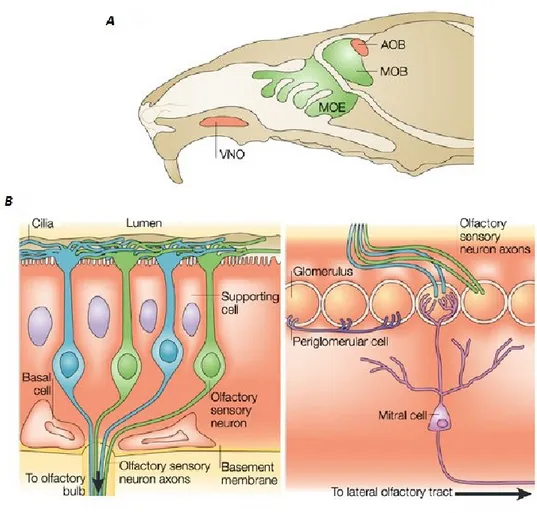
In mammals, the processing of olfactory information can be distinguished in a precise sequence of events occurring in distinct anatomical regions (Figure 1A).
Figure 1 Mammalian olfactory system. A: Schematic representation of mouse head. From the main olfactory epithelium (MOE), axonal fibers of olfactory sensory neurons project to the main olfactory bulb (MOB). In addition, the vomeronasal organ (VNO) and the accessory olfactory bulb (AOB) are shown. B: Cross-section of the main olfactory epithelium on the left, and cross-section of the peripheral part of the main olfactory bulb on the right. Image adapted from (Mombaerts, 2004).
3
Initially, volatile odorants enter in the nasal cavity, which is lined in part by a layer of cells termed olfactory epithelium (Figure 1B). Within this layer, olfactory sensory neurons (OSNs) are responsible for the first phase of the transduction process. Neurons belonging to this class are bipolar cells with a long unmyelinated axon at its basal pole. On the contrary, at the apical surface is located a characteristic structure. This process consists of a unique dendrite generating a rounded prominence with microvilli. These elements, termed olfactory cilia, are submerged in a layer of mucus; interestingly, in the mucus are contained some odorant binding proteins or OBPs, which help hydrophobic odorants to pass through this fluid (Bignetti et al., 1985).
Odorant receptors, belonging to the G-protein-linked receptor class, represent the key player of this very versatile sensor system. Since their molecular cloning in 1991 (Buck and Axel, 1991), more than 1000 genes encoding for odorant receptors has been discovered, making their family the largest in the mammalian genome (Young et al., 2002; Zhang and Firestein, 2002). Moreover, odorant receptors have been identified in a great number of species, underlying their important role in survival. Interestingly, the percentage of functional genes in primates seems to decrease from monkey to hominoids. The reduction of olfactory abilities has been suggested to be related with this observation (Niimura and Nei, 2003, 2005, 2007).
The olfactory transduction starts when the binding between the odorant and the specific receptor (direct or OBP-mediated) occurs, activating a particular heterotrimeric G-proteins (Golf)
expressed by the receptor. This, in turn, induce a rise of cyclic adenosine monophosphate (cAMP) intracellular concentration by stimulation of type III adenylate cyclase. This event leads to the opening of cyclic nucleotide-gated (CNG) channels, which activate others membrane proteins and depolarize the apical region of the OSN. The membrane depolarization proceeds along apical dendrite and soma of the neuron and, when reaches the trigger zone of the axon in the basal pole, originates an action potential transmitted to the olfactory bulb (OB) (Firestein, 2001; Ronnett and Moon, 2002). This cascade was considered the only one acting in OSNs for long time. However, recent studies demonstrated that some minor pathways, involving different second messengers, are involved in the regulation of the main process mentioned above (Schild and Restrepo, 1998; Elsaesser et al., 2005; Liberles and Buck, 2006; Lin et al., 2007).
OSN axons leaving the olfactory epithelium gather to generate several fascicles, which in turn originate the olfactory nerve (ON). Axonal bundles are kept together by the ensheathing cells, a glial subpopulation probably involved in the synchronization of the olfactory transmission (Bokil et al., 2001). The bundles of the ON passes through the cribriform plate and contacts the ipsilateral olfactory bulb (Figure 1B). Synapsis between axonal terminals of the nerve and dendrites of bulbar neurons take place in spheroidal structures termed glomeruli. Interestingly, OSNs sharing the same odorant receptor converge on a specific pair of glomeruli in each bulb (Mombaerts, 1996, 1999), but each glomerulus reacts to different olfactory stimuli. This evidence endorses the thesis
4
of a peculiar glomerular pattern activation in response to the odorant detection in the olfactory epithelium. How the glomerular segregation occurs is still not completely understood, but it has been demonstrated that, unlike other sensory system, a spatial correlation between sensory neuron location in the olfactory epithelium and glomerulus position is absent (Yu et al., 2004a; Sakano, 2010; Mori and Sakano, 2011; Takeuchi and Sakano, 2014).
Axonal terminals of the OSNs contacts primary dendrites of mitral cells inside the glomeruli. This neuronal population represents the first projection neurons of the olfactory bulb. In addition, two different modulatory circuits have been identified in the OB. The former involves principally juxtaglomerular cells, which extend their processes in the glomeruli and synapse the mitral cells. The latter consists of granular cells, which create dendro-dendritic connections with mitral cells in the external plexiform layer. A second class of output neurons is composed by the tufted cells, located in different areas of the OB depending on their subtype.
Finally, axons of mitral cells and tufted cells leave the OB and merge to create the olfactory tracts. This bundle relays to the higher-order brain regions (olfactory tubercle, amygdala, entorhinal cortex, piriform cortex and, later, hippocampus, thalamus, hypothalamus, and orbitofrontal cortex), where all the physiological responses to odorant stimuli arise (Shipley and Ennis, 1996). Interestingly, olfaction is the only sensory system that does not project to neocortex directly through the thalamus. On the contrary, output neurons send their axons to the piriform cortex (belonging to the three-layered archicortex), which is considered a specific processing region of the olfactory signals (Purves, 2004).
5
Olfactory Bulb
Structure
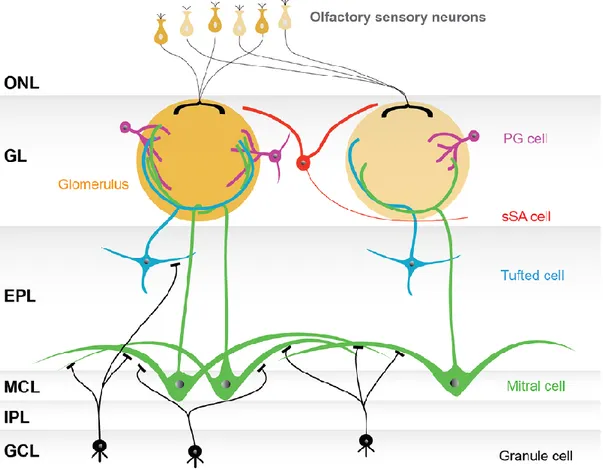
Since Ramon y Cajal’s pioneering anatomical descriptions (Ramon y Cajal, 1890, 1901, 1911), the anatomical structure of the main olfactory bulb can be described as a sequence of six concentric cell layers: olfactory nerve layer, glomerular layer, external plexiform layer, mitral cell layer, internal plexiform layer, and granule cell layer (Figure 2). Their properties are briefly illustrated below (for a complete review see Kosaka and Kosaka, 2009).
The most external layer is the olfactory nerve layer (ONL), composed by axonal fibers of the olfactory sensory neurons located in the olfactory epithelium. In addition, in this layer it is possible to identify ensheathing cells that keep together the axons.
The following layer is the glomerular layer (GL), which takes the name from the structure where the contact between OSN axonal terminals and apical dendrites of mitral cells occurs (Pinching and Powell, 1971a, 1971c; Kosaka et al., 1998; Kosaka and Kosaka, 2005). Furthermore, also neuronal processes of three types of interneurons contribute to generate the glomerular structure: periglomerular (PG) cells, external tufted (ET) cells and superficial short-axon (SSA) cells. These neurons are generally termed together as juxtaglomerular cells and are responsible for the glomerular microcircuit.
In the external plexiform layer (EPL) are located the middle and the deep tufted (MT and DT, respectively), which originate dendro-dendritic synapses with granular cells and some of their axons project to the brain (Jackowski et al., 1978; Macrides and Schneider, 1982; Schoenfeld et al., 1985).
Below the EPL resides the mitral cell layer (MCL). This thin layer mainly consists of mitral (M) cells, but also a small amount of deep short-axon (DSA) cells can be detected (Price and Powell, 1970a; Schneider and Macrides, 1978). Mitral cells can be distinguished in two group depending on the different morphology and abundance (Mori et al., 1983; Orona et al., 1984). Type 1 mitral cells represent the majority of mitral cells and extend their long dendrites in the deeper EPL. Conversely, type 2 cells are less numerous and show narrow dendritic processes.
Proceeding inside the olfactory bulb, the next layer is the internal plexiform layer (IPL). This region is occupied by axonal fibers of projection neurons, and only few cell bodies exist (Price and Powell, 1970a; Schneider and Macrides, 1978).
Finally, granule cell layer (GCL) is the innermost one. It takes its name by the granule (Gr) cells, small roundish interneurons without axonal processes (Price and Powell, 1970b, 1970c). Granule cells project their peripheral dendrites in the EPL and contact secondary dendrites of output neurons. Based on the position of their bodies in the GCL and on the arrangement of their
6
dendritic processes, granule cells can be discriminated in three subtypes (Price and Powell, 1970c; Schneider and Macrides, 1978).
Figure 2 Basic model of the olfactory bulb network. The figure represents the conventional organization of the olfactory bulb network. The olfactory sensory neurons project in the glomerular layer (GL), consisting of spherical structures called glomeruli. Olfactory sensory neurons expressing the same type of odorant receptor converge their axons into only a few glomeruli. Neurons surrounding glomeruli in the GL are called juxtaglomerular cells (JG cells), consisting of three morphologically distinct cell types: periglomerular (PG) cells, external tufted (ET) cells (not shown), and superficial short-axon (sSA) cells. The mitral cells and the tufted cells, sending their short-axonal fiber to the olfactory cortex, constitute the projection neurons. Mitral cells are located in the mitral cell layer (MCL), while the tufted cells are scattered throughout the EPL. In the glomeruli, both mitral and tufted cells receive synaptic inputs from the axons of OSNs and make reciprocal synapses with the dendrites of PG cells. Secondary dendrites of mitral and tufted cells are arborized in the external plexiform layer (EPL), where reciprocal synapses are generated with granule cell dendrites. The internal plexiform layer (IPL), in which axons from mitral cells and axon collaterals of ET cells run, and the granule cell layer (GCL), which is largely composed of granule cells, both lie beneath the MCL. Granule cells are interneurons extending their dendritic processes apically into the EPL. Abbreviation: ONL, olfactory nerve layer.
7
Cellular heterogeneity in the glomerulus
The glomerulus represents the first processing center of the olfactory information. Since the beginning, as seen above, this structure was defined as a rough globe surrounded by neuronal and glial cell bodies (Ramon y Cajal, 1911). The inner volume, to the contrary, is a neuropil, originating from dendrites of both projection cells and juxtaglomerular cells and OSN axons. However, new details about its structure arose over the years, highlighting several new traits (Pinching and Powell, 1971b; Schoenfeld et al., 1985; Halász, 1990; Kosaka et al., 1998).
First, juxtaglomerular cells, originally thought as a unique population, could be distinguished on the basis of their properties in three distinct types: periglomerular cells, external tufted cells and superficial short-axon cells. Dendritic processes of PG cells and ET cells extend into the glomeruli; conversely, the dendrites of the last neuronal group are arborized in the GL but avoid entering in the glomerular structure (Kosaka and Kosaka, 2005). Moreover, every class of JG cells show heterogeneity in morphological, chemical, and functional features, and can be separated in additional subtypes (Macrides et al., 1985; Nagayama et al., 2004; Kiyokage et al., 2010; Kosaka and Kosaka, 2011). In particular, PG cells shows a wide range of properties.
Considering the synaptic organization, the intraglomerular space has been divided in two areas: the olfactory nerve zone (ON zone) and the non-olfactory nerve zone (non-ON zone) (Chao et al., 1997; Kosaka et al., 1997; Kasowski et al., 1999). The olfactory nerve, in fact, do not form synapses in every point of the internal glomerular volume, but is confined only in well delimited regions. Processes of bulbar neurons fill the remaining areas. Interestingly, different PG neurons show preferential dendritic projections to ON or non-ON zone (). Whereas type 1 PG cells contact indifferently both intraglomerular compartments, type 2 PG cells generate dendro-dendritic synapses with bulbar neurons, but are not linked to the OSNs (Kosaka et al., 1998).
Figure 3 Types 1 and 2 periglomerular cells. A: Type 1 periglomerular cells send their intraglomerular dendrites into both the ON zone (red) and non-ON zone (yellow). B: Type 2 periglomerular cells send their intraglomerular dendrites only into the non-ON zone (yellow). C: Synaptic connections of types 1 and 2
periglomerular cells in the
glomerulus. Olfactory nerves (ONs; red) terminate onto mitral/tufted cells (M/Ts; brown) and type 1 periglomerular cells (blue), but not type 2 periglomerular cells (green). Both type 1 (blue) and type 2 (green) periglomerular cells synapse apical dendrites of M/Ts (brown). Image adapted from (Kosaka et al., 1998).
8
Furthermore, PG cells are different also from the chemical point of view. Considering the high variability of results in literature and the purpose of this work, I will restrict my discussion to murine data. In mouse models, three main chemical markers have been found: tyrosine hydroxylase (TH), calbindin (CB) and calretinin (CR). Since the immunoreactivity for these compounds is largely mutually exclusive, these three cellular subtypes are virtually nonoverlapping (Kosaka and Kosaka, 2007; Parrish-Aungst et al., 2007). Moreover, it has been reported that all the PG cells synthesize γ-amino butyric acid (GABA) and express at least one of the two glutamic acid decarboxylase (GAD) isoforms, with the exception of a small percentage of CR-positive neurons (Kosaka and Kosaka, 2007). Several studies have also tried to calculate how many PG cells belong to the different groups. Results suggest that CR-positive cells are the most abundant, while the CB-positive cells the fewest, but the proportions depend on the method employed (Kosaka and Kosaka, 2007; Panzanelli et al., 2007; Parrish-Aungst et al., 2007; Whitman and Greer, 2007).
In addition, it has been observed that TH-positive cells belong to the type 1 PG cells, since they are directly contact by the olfactory nerve. On the other hand, CR- and CB- positive cells project to the non-ON zone and are classified as type 2 (Kosaka and Kosaka, 2007).
Finally, different PG subtypes have also distinct temporal patterns of neurogenesis during the lifetime. In fact, periglomerular cells, together with granular cells, represents two neuronal population that are produced also in the adult (Altman, 1962, 1969; Hinds, 1968a, 1968b). Addition of CB-positive neurons to the GL is sizable in the neonate and decreases in the course of time. Vice versa, production of CR-positive cells increases in the adult. Experiments on the age-dependent neurogenesis of TH-positive cells produced contrasting data (De Marchis et al., 2007; Batista-Brito et al., 2008; Lledo et al., 2008).
In the following chapters, the attention is focused on TH- and CR-positive PG interneurons, which represent the topic of my thesis.
9
TH-positive PG cells
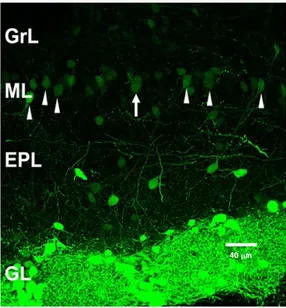
In the forebrain, bulbar dopaminergic cells represent the major dopaminergic population (Baker and Farbman, 1993; Cave and Baker, 2009). These neurons are mainly located in the GL (Figure 4), where they represent 10-20% of all JG cells (De Marchis et al., 2007; Kosaka and Kosaka, 2007; Panzanelli et al., 2007; Parrish-Aungst et al., 2007; Whitman and Greer, 2007). The identification of the dopaminergic cells is carried out by the marker TH, a rate-limiting enzyme in the biosynthetic pathway of dopamine (DA) (Nagatsu et al., 1964; Joh et al., 1973). Considering the absence of cells synthesizing other cathecolamines in the OB, all the TH-positive neurons are accounted as dopaminergic cells (Baker et al., 1983).
With regard to their location and size, dopaminergic cells in the GL can be further grouped in two populations (Baker et al., 1983; Halász, 1990; Pignatelli et al., 2005; Kosaka and Kosaka, 2008), one including small PG cells with a soma diameter ranging from 5 to 10 µm, and another including larger neurons (10-15 µm in diameter), belonging to ET or SSA cell type (Cave and Baker, 2009; Nagayama et al., 2014). Nonetheless, both populations are GABAergic and share the same electrophysiological properties (Pignatelli et al., 2005; Kosaka and Kosaka, 2007).
The first part of this work is focused on the dopaminergic PG cells, which represent the first population. According with their classification as type 1 PG interneurons, these cells receive direct synaptic inputs from the ON and in turn create dendro-dendritic contacts with the projection neurons. This arrangement has several consequences. Firstly, TH-positive PG cells are influenced by the activity of OSNs in both direct and indirect ways. ON terminals, in fact, directly stimulate TH-positive PG cells via glutamate release; in addition, bulbar output neurons, activated by electrical activity coming from olfactory epithelium, stimulate dopaminergic PG interneurons (Ennis et al., 1996, 2001; Aroniadou-Anderjaska et al., 1997).
Dopaminergic PG cells influence the glomerular activity. Indeed, these neurons are able to release both DA and GABA, with several consequences on the activity of other components of glomerular circuits, namely OSNs, mitral cells, and JG cells (Hsia et al., 1999; Berkowicz and Trombley, 2000; Ennis et al., 2001). Interestingly, in the OB, DA release can also alter cellular sensitivity to GABA, underling a peculiar modulatory mechanism (Brünig et al., 1999).
Figure 4 Dopaminergic periglomerular cells. Coronal section of the mouse olfactory bulb with dopaminergic cells expressing the GFP. Arrows indicate some dopaminergic cells faintly positive to the marker in the mitral layer.
10
From the electrophysiological point of view, a first description of dopaminergic PG cells has been provided by our group in 2005 (Pignatelli et al., 2005). In this study, the spontaneous activity in the absence of synaptic inputs, common feature of several dopaminergic populations (Grace and Onn, 1989; Hainsworth et al., 1991; Yung et al., 1991; Feigenspan et al., 1998; Neuhoff et al., 2002), has been proved to characterize also the bulbar dopaminergic neurons in GL. Furthermore, five different depolarization-activated conductances have been identified in these cells. A non-inactivating potassiumcurrent and a fast transient sodium current represent the two more sizable currents. In addition, one persistent sodium conductance and two different types of calcium conductances (L-type and T-type) have been pharmacologically isolated. Remarkably, only persistent sodium current and T-type calcium current are required to generate the autorhythmicity.
In more recent years two small conductances activated by hyperpolarization have also been described. The former is a fast-activating inward rectifier potassium current blocked by Ba2+
(Borin et al., 2014). The characterization of the latter, a mixed-cation conductance sustained by HCN channels important in the determination of the resting membrane potential, and thereby of the cell excitability profile, constitutes the first part of my thesis.
11
CR-positive PG cells
Calretinin is a very common marker of several neuronal types (Jacobowitz and Winsky, 1991; Miettinen et al., 1992; Resibois and Rogers, 1992; Rogers and Résibois, 1992; Schurmans et al., 1997; Huberman et al., 2008; Barinka and Druga, 2010). This protein, together with parvalbumin, secretagogin, and calbindin, belongs to the calcium-binding family (reviewed in Schwaller, 2014). It shows a hexa-EF-hand structure, with five helix-loop-helix domains able to bind Ca2+ ions. However, complex chemical interactions characterize binding sites of CR,
conferring peculiar kinetic properties to this protein (Schwaller et al., 1997; Stevens and Rogers, 1997; Palczewska et al., 2003; Faas et al., 2007).
In the cell, CR acts mainly as a calcium buffer, regulating the intracellular level of this ion and, consequently, the different physiological signaling cascades. Besides, additional roles have been confirmed in specific neuronal types. In the cerebellum of mice lacking CR, for instance, modifications in the firing properties of granule cell have been observed, presumably due to increased intracellular free Ca2+ concentration; remarkably, addition of the exogenous
fast-calcium buffer BAPTA (1,2-bis(o-aminophenoxy)ethane-N,N,N',N'-tetraacetic acid) brings back the firing to the normal condition (Gall et al., 2003). Furthermore, a direct binding site for CR has been identified in the sequence of the voltage-gated calcium channel 2.1; the interaction modulates ionic flux through the channel, leading to an altered cellular excitability (Christel et al., 2012).
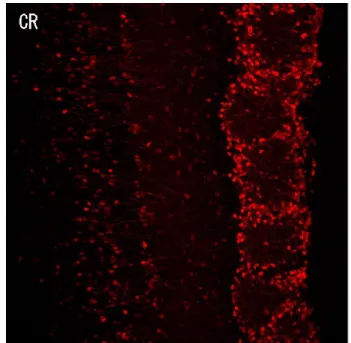
Many neuronal populations are also positive for the CR staining in several OB layers (Figure 5); only the ONL, in fact, lacks positivity to this marker (Parrish-Aungst et al., 2007). In the GL, CR-positive cells account for 28-44% of all JG cells (Kosaka and Kosaka, 2007; Panzanelli et al., 2007; Parrish-Aungst et al., 2007; Whitman and Greer, 2007). Dimensionally, this neuronal group is the smallest among PG cells, with a soma diameter varying from 6 to 8 µm (Kosaka and Kosaka, 2007; Parrish-Aungst et al., 2007; Batista-Brito et al., 2008).
Furthermore, CR-positive cells do not express cholinergic markers and, contrary to all other PG subtypes, only some of them are GABAergic, suggesting the existence of at least two populations (Kosaka and Kosaka, 2007; Parrish-Aungst et al., 2007; Krosnowski et al., 2012).
Figure 5 Calretinin-positive periglomerular cells. Coronal section of the mouse olfactory bulb with CR-positive cells in red.
12
CR neurons, together with CB-positive cells, constitute type 2 PG cells. They create contacts with other bulbar cells, but are not directly in contact with the ON axons. Activation of CR-positive neurons, consequently, is elicited by inputs from projection neurons (Kosaka and Kosaka, 2007). Interestingly, in the neocortex and hippocampus some CR-positive cells have been proved to synapse especially GABAergic interneurons, in order to modulate their inhibitory contribution to the neuronal network (Freund and Buzsáki, 1996; Gonchar and Burkhalter, 1999). This observation can highlight a possible parallelism with bulbar dopaminergic PG cells. Moreover, some studies reported that the amount of neo-generated CR-positive cells increases postnatally (De Marchis et al., 2007; Batista-Brito et al., 2008), suggesting an involvement in the adaptive adjustment of bulbar circuitry to external stimuli.
The exact role of CR-positive type II PG cells in the glomerular circuits is still unknown - more data on the electrical properties of CR-positive PG could help to find it; nevertheless, an electrophysiological characterization is still absent in the literature. The second part of my thesis is aimed at filling this gap.
13
h-current
Historical notes
The hyperpolarization-activated current was described for the first time in the rabbit sinoatrial node myocytes in 1976 (Noma and Irisawa, 1976), and in other cell types over the following years (Bader et al., 1979; Halliwell and Adams, 1982). Furthermore, in the early 1980s DiFrancesco provided the first accurate descriptions of this conductance in the sinoatrial node (Brown and DiFrancesco, 1980; DiFrancesco, 1981b, 1982). The experimental data revealed that the current under study begins to activate around -50 mV, raises in amplitude as hyperpolarized voltage steps increase and is carried by a mixed flux of K+ and Na+ ions. Because of its unusual
properties, primarily activation by membrane hyperpolarization, DiFrancesco decided to name it “funny” current.
In the CNS, an equivalent current was initially termed “queer” current by Halliwell and Adams in 1982, during their studies in the hippocampus (Halliwell and Adams, 1982). In the last years, this name has been mainly replaced by the term h-current, or Ih, to indicate the
hyperpolarization-activated current in the brain areas. To avoid any misunderstanding, I will use only the latter denomination in my thesis.
Since the beginning, it was clear that the hyperpolarization-activated current plays important roles in several physiological processes, still largely unidentified. This conductance, indeed, participates in the generation of the heartbeat (Yanagihara and Irisawa, 1980; DiFrancesco, 1981a), in the processing of visual signals (Attwell and Wilson, 1980; Bader et al., 1982; Demontis et al., 1999; Lee and Ishida, 2007), in the regulation of rhythmic activity in thalamic circuits (McCormick and Pape, 1990b; Soltesz et al., 1991), as well as in other basic neuronal mechanisms (Doan and Kunze, 1999; Beaumont and Zucker, 2000; Lupica et al., 2001). In addition, dysregulations of h-current have been also related to numerous pathologies, from Parkinson’s disease (PD) to epilepsy (Shin et al., 2008; Jung et al., 2010; Chan et al., 2011).
14
HCN channels
The ionic channels underlying Ih are also called Hyperpolarization-activated Cyclic
Nucleotide-gated or HCN channels for their dual mechanism of activation (Clapham, 1998), influenced by both membrane hyperpolarization and intracellular concentration of cyclic nucleotides.
These channels belong to the group of the cyclic nucleotide-regulated cation channels, including Eag-like K+ and CNG channels too (Yu et al., 2005; Craven and Zagotta, 2006).
Structure
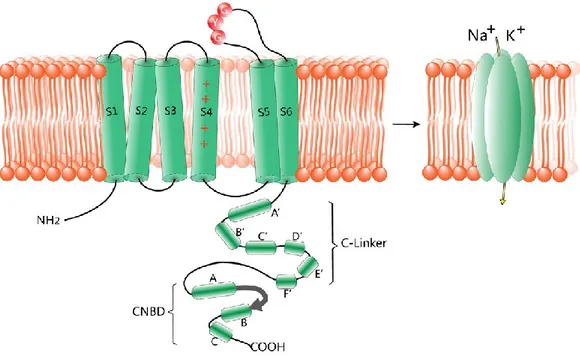
In their structure, HCN channels are polymeric complexes with four subunits organized around a central pore (Figure 6), an arrangement shared with many other voltage-gated pore loop channels (Doyle, 1998; Yu and Catterall, 2003). As well as in vertebrates, genes encoding for HCN subunits have been found also in some invertebrates, but are absent in prokaryotes and yeast (Gauss et al., 1998; Krieger et al., 1999; Marx et al., 1999). In mammals, four different HCN subunits, encoded by the HCN1-4 gene family, have been identified (Robinson and Siegelbaum, 2003).
Figure 6 Structure of HCN channels. Each subunit consists of six transmembrane segments (S1–S6), with the positive charged voltage sensor (S4) and the pore region carrying the GYG motif between S5 and S6. The C-terminal of HCN channels is composed of the C-linker and the cyclic nucleotide-binding domain (CNBD), which mediates their responses to cAMP. The C-linker consists of six a-helices: A’ to F’. The CNBD follows the C-linker domain and consists of three α-helices and eight-stranded antiparallel β-rolls. The four subunits assemble in tetrameric configurations in vivo. Image adapted from (He et al., 2014).
15
HCN subunits could generate both homotetramers and heterotetramers, due their high level of similarity in the amino acidic sequence (Figure 6). Peculiar biophysical properties characterizing different combination of subunits have been reported in several studies (Santoro et al., 1998; Ishii et al., 1999; Ulens and Tytgat, 2001; Altomare et al., 2003; Much et al., 2003; Whitaker et al., 2007).
Functionally, it is possible to recognize in each subunit two main structures with different roles: the transmembrane core and the intracellular C-terminal domain. Both of them are characterized by highly conserved sequence in all the members of the HCN family. On the contrary, intracellular N-terminal domains show very variable traits (Baruscotti et al., 2005).
Transmembrane domain
The transmembrane domain consists of six amino acidic chains (S1-S6) crossing the cellular membrane, commonly termed 6 transmembrane or 6TM architecture. In particular, S5-S6 loop and S4 helix play fundamental roles in the activity of the channel.
The complex of S5 segment, S6 segment, and reentrant loop between them of each subunit contribute to generate the ion-conducting pore of HCN channels. Also, in this structure has been found the amino acidic sequence C-IGYG, forming the selectivity filter of this channel (Macri et al., 2012). Interestingly, this sequence is nearly the same of the filter sequence that exclusively allows the permeation of the K+ ions through the potassium channels (Shealy et al.,
2003), although h-current is a mixed (Na+-K+) cation current (Ho et al., 1994; Yu et al., 2004b). This
property is probably related to a more flexible organization of the residues (Wahl-Schott and Biel, 2009). Cysteine at position 400 contained in selectivity filter sequence is located deeply in the membrane. The cysteines of the four subunits channel create a ring that actively contribute to the pore selectivity of the HCN channel (Macri et al., 2012). Finally, asparagine at position 380 is not implied in the pore formation, but its glycosylation is essential for the correct channel positioning in the cell membrane (Much et al., 2003).
The S4 helix, as in many other voltage-gated ion channels (Yu and Catterall, 2004), represents the voltage sensor of HCN channel and consists of nine positive charged amino acids (mainly arginine and lysine) (Chen et al., 2000). In response to a hyperpolarization, S4 segments undergoes an inward movement through the membrane. This movements, which in normal voltage-dependent channels lead to the channel closing, opens the HCN channel (Männikkö et al., 2002). The reason of this behavior is still unknown, although it has been proposed an involvement of intracellular S4-S5 loops (Decher et al., 2004; Prole and Yellen, 2006).
16
C-terminal domain
The two main components of the carboxy-terminal domain are the cyclic nucleotide-binding domain (CNBD) and the C-linker, together termed the cAMP-sensing domain (CSD) (Figure 7). Indeed, those structures are responsible for the regulation of the HCN channel by cyclic nucleotides, which accelerate the opening kinetics and shift the activation curves to more positive membrane potentials) (DiFrancesco and Tortora, 1991; Flynn et al., 2007).
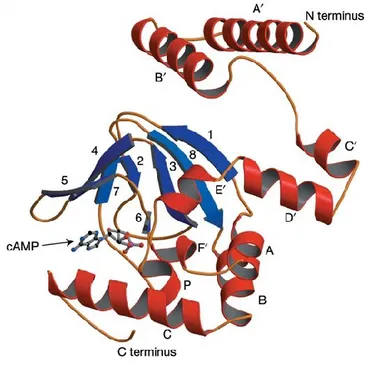
The CNBD is a 120 amino acid-long highly conserved complex composed by three α-helices (A, B, and C) and eight-stranded antiparallel β-rolls (β1-β8). The spatial organization of those elements, clarified at an atomic resolution in 2003 (Zagotta et al., 2003), generates a binding pocket for cyclic nucleotides (Figure 7). Only seven residues directly bind the cyclic nucleotides inside the pocket: four belong to C-helix and three to the β-roll. In more detail, the arginine at position 632 plays the lead role in the improvement of the pore opening (Zhou and Siegelbaum, 2007). Finally, a sequence of 80 residues arranged in 6 α-helices, termed C-linker, connects the CNBD to the S6 segment.
It has been observed that cAMP and cGMP (cyclic guanidine monophosphate) bind the HCN channels in the same way, determining the resulting CNBD conformation (Zagotta et al., 2003). However, HCN channels show a preferential binding for the cAMP compared with the cGMP. The molecular basis of this behavior is still unknown, even though some possible causes are supposed to be the different hydration energies of the two cyclic nucleotides or the specificity of the link with the amino acid residues (Zhou and Siegelbaum, 2007, 2008).
Figure 7 Structure of the mouse HCN2 C-linker and CNBD construct bound to cAMP. Ribbon representation of the C-linker, consisting of six α-helices (A’-F’, in red), and of the CNBD, consisting of three α-helices (A, B, and C, in red) and eight-stranded antiparallel β-rolls (1-8, in blue). A molecule of cAMP is shown in the binding site of the structure. Image adapted from (Zagotta et al., 2003).
17
In recent years, a model auto inhibition has been proposed by various researchers to explain the modulation of the HCN channels by the cAMP (Craven and Zagotta, 2006; Wicks et al., 2011; Chow et al., 2012). The model predicts that the channel voltage-dependent activation is inhibited by the unbound CSD, limiting the S6 segment movements. This assumption is in agreement with previous studies suggesting that when cAMP binds the CNBD, conformational changes in the CSD sequence, relieving the inhibitory effect on the channel and promoting its activation (Wainger et al., 2001)..
Basic biophysical properties
Generally, all the HCN channels share some basic biophysical properties. First, their activation kinetics is very slow until -50 mV and they do not show any type of voltage-dependent inactivation. Moreover, if carefully analyzed, two different components can be recognized in the current evoked by hyperpolarization: a small, fast instantaneous current (Iins) and a large
steady-state current (Iss). The former reaches a complete activation in few milliseconds, the latter requires
tens milliseconds to several seconds. Furthermore, if the nature of Iss is well characterized, the
origin of the small Iins is not completely clear (Proenza et al., 2002; Macri and Accili, 2004).
Several studies in different cell populations have revealed that Ih currents can be fitted by
either a single or double exponential function (Attwell and Wilson, 1980; DiFrancesco and Noble, 1985; Edman et al., 1987; Kamondi and Reiner, 1991; Ulrich, 2002). In addition, important kinetic parameters have also been observed to diverge importantly in different works. For example, activation time constants range from tens of milliseconds to seconds (Attwell and Wilson, 1980; Pape, 1996). Half-maximal activation potentials (V50), obtained from the activation curves fitted
by the Boltzmann equation, also show a high variability (DiFrancesco and Tromba, 1988; Farès et al., 1998).
These diversities are supposed to originate from intrinsic (cellular types, HCN subunits, etc.), and extrinsic variables (experimental conditions), (Biel et al., 2009). In particular, temperature affects many biophysical properties of HCN channels, as demonstrated for other types of ion channels (Allen and Mikala, 1998; Rodríguez et al., 1998; Yanagida et al., 2000; Voets et al., 2004).
Ion selectivity
As mentioned above, HCN and K+ voltage-gated channels share a very similar selectivity
filter, but the firsts sustain a mixed cation current (Ho et al., 1994; Yu et al., 2004b; Macri et al., 2012). In fact, both K+ and Na+ ions can permeate HCN channel, with a ratio ranging between 3:1
18
and 5:1. Accordingly, the normal reversal potential for this current vary from -25 to -40 mV, so that Ih results to be a depolarizing inward current at rest (DiFrancesco, 1981a; Edman et al., 1987;
Ho et al., 1994; Travagli and Gillis, 1994; Mercuri et al., 1995; Ludwig et al., 1998; Robinson and Siegelbaum, 2003). In addition, it has been reported a small flux of Ca2+ ions through HCN
channels, suggesting an involvement in the process of secretion (Yu et al., 2004, 2007).
Interestingly, extracellular K+ concentration has been proved to exert an important
influence in channel permeation ratio and, consequently, in current amplitude (Frace et al., 1992; Wollmuth and Hille, 1992; Ludwig et al., 1998). In fact, if the external [K+] is raised, the current
amplitude increases significantly and selectivity for K+ over Na+ is reduced. On the contrary, in the
absence of potassium, HCN channel conductivity is nearly extinguished.
Modulation by cAMP
A hallmark of HCN channels is their modulation by cyclic nucleotides, in particular cAMP. This molecule is capable of speeding the opening kinetics, and shifting the activation curve of HCN channels to more depolarized voltages (DiFrancesco and Tortora, 1991; Wainger et al., 2001). V50
shifts caused by cAMP in different cell types are highly variable, since HCN channel isoforms have different sensitivity to the cyclic nucleotide (Santoro et al., 1998; Chen et al., 2001; Craven and Zagotta, 2006; Wicks et al., 2011).
HCN channel modulation by cAMP is important to explain many effects of neurotransmitters. Indeed, the majority of neurochemical compounds is able to modify the intracellular concentration of cAMP. Consequently, neurotransmitters that upregulate cAMP enhance HCN channels activation, and vice versa (Brown et al., 1979; DiFrancesco and Tromba, 1988; McCormick and Pape, 1990a; Garratt et al., 1993; Larkman and Kelly, 1997).
Pharmacology
HCN channels are sensitive to millimolar concentrations of Cs+ (Fain et al., 1978;
DiFrancesco, 1982; Ludwig et al., 1998). On the contrary, they are not blocked by millimolar concentrations of external Ba2+, 4-aminopyridine (4-AP) and tetraethylammonium (TEA), common
blockers of voltage-gated K+ channels (Ludwig et al., 1998).
Anyway, for their key role in heartbeat generation, HCN channels have been the object of several studies. The first class of compounds discovered to act selectively on the HCN channels was alinidine, an analogue of the α2-adrenoceptor agonist clonidine (Kobinger et al., 1979;
19
their CNS side effects. Later, also some analogues of the L-type Ca2+ channel blocker verapamil
have been proved to have bradycardic effect (Van Bogaert and Pittoors, 2003).
The HCN channels blocker more used is ZD7288. This molecule blocks the channel from the inside: two specific amino acids of the HCN2 subunit S6 segment are responsible for the high-affinity binding (Shin et al., 2001; Cheng et al., 2007).á ZD7288 block is not use-dependent and leads to an alteration of the biophysical properties of the channel (BoSmith et al., 1993; Aponte et al., 2006). Furthermore, this drug has been reported to block also other types of voltage-dependent conductances, like T-type Ca-channels (Sánchez-Alonso et al., 2008).
More recently, Laboratoires Servier have synthesized the first blocker of HCN channels approved for therapeutic use (ivabradine or S16257) (Thollon et al., 1994). This molecule is able to decrease HCN channels conductance without altering their biophysical properties (e.g. voltage dependence) (Bois et al., 1996). Ivabradine acts on HCN channel at micromolar concentrations, blocking it from the intracellular side. This effect has been demonstrated to be both current- and use-dependent (Bucchi et al., 2002, 2006; Thollon et al., 2007).
20
Functional properties of I
hDue to their biophysical properties, a portion of the HCN channels is open at the resting membrane potential. This event has important outcomes on the physiology of excitable cells (Aponte et al., 2006; Rodrigues and Oertel, 2006; Nolan et al., 2007). Some of those consequences are discussed below.
Resting membrane potential control
Since a fraction of HCN channels is open at rest, this current maintains the cell membrane in a depolarized state in physiological conditions. The tonic activation of these channels also stabilizes the RMP and prevents its oscillation through different mechanisms (Maccaferri et al., 1993; Ludwig et al., 2003; Nolan et al., 2007). Since this conductance contributes to a decrease of the input resistance, an input current elicits a smaller variation in membrane potential. Furthermore, h-current restricts membrane potential variations through the singular relationship between its reversal potential and activation (Solomon and Nerbonne, 1993; Bayliss et al., 1994; Nolan et al., 2007). When a hyperpolarizing stimulus opens HCN channels, in fact, the elicited h-current produces a depolarization. Vice versa, reduction of Ih, as it can be produced by a depolarization, has a hyperpolarizing effect.
Dendritic integration
It has been proposed that HCN channels play a role in the dendritic integration of excitatory postsynaptic potentials (EPSPs) (Magee, 1998, 1999; Williams and Stuart, 2000; Berger et al., 2001). Generally, rising and decaying times of EPSPs depend on the passive properties of the dendrites. However, during the rising phase of EPSP, deactivation of HCN channels occurs, producing a hyperpolarization. Consequently, the time required for the decay of EPSP is reduced. Moreover, the resulting attenuation of EPSPs can be modulated by the expression level of these channels in distinct dendrites.
Spontaneous activity
The depolarizing effect of HCN channels brings the RMP close to firing threshold, contributing in several ways to spontaneous activity. This mechanism has been studied extensively in different cells (Jahnsen et al., 1984; McCormick and Pape, 1990b; Williams et al., 2002; Kocsis and Li, 2004; Atkinson et al., 2011; Kopp-Scheinpflug et al., 2011). In thalamocortical relay neurons, for example, HCN channels are directly involved in the pacemaking mechanism. In the
21
absence of external stimuli, these neurons show periodic bursts of action potential produced by T-type Ca2+ current and h-current: I
h depolarizes the membrane and activates the calcium current,
which generates the bursts. During the spike depolarization, HCN channels are deactivated, leading to a hyperpolarization at the end of the burst. This event activates again the Ih, and the sequence can restart (Jahnsen et al., 1984; McCormick and Pape, 1990b). In other cases, HCN channels are not directly implicated in autorhythmicity, but are capable to modulate the currents that act as pacemakers (Williams et al., 2002).
Synaptic transmission
In the axon terminals of several neurons has been reported the presence of HCN channels, exerting opposite effects.
In the murine globus pallidus, the steady depolarization of the cell membrane produced by the h-current maintains in the inactivated state a significant portion of T-type Ca2+ channels.
Therefore, during the action potential, a smaller amount of Ca2+ enters, and synaptic release of
neurotransmitter results impaired (Boyes et al., 2007; Huang et al., 2011).
On the contrary, in other preparations, the HCN channels have been reported to enhance the transmitter release through the stimulation of P/Q-type Ca2+ channels as in the calyx of Held
(Awatramani et al., 2005). Yet in other preparations, it has been reported a facilitating mechanism produced by Ih activation. The molecular basis of this mechanism is still unknown, but it has been
proposed a cAMP-dependent increase in the pool size of releasable vesicles (Beaumont et al., 2002).
22
23
Animals
For this thesis, depending on the purpose of the experiment, two transgenic mice strains have been employed.
Experiments on dopaminergic neurons are performed using the transgenic strain “TH-GFP/21-31”, which carries the eGFP transgene under the control of the TH promoter. Precisely, the transgene construct contains the 9.0 kb 5’-flanking region of the rat TH gene, the second intron of the rabbit globin gene, cDNA encoding eGFP, and polyadenylation signals of the rabbit β-globin and simian virus 40 early genes (Sawamoto et al., 2001; Matsushita et al., 2002). Identification of transgenic mice is realized, within postnatal day 4, looking at the fluorescence of the olfactory bulbs trans-illuminated with a light source (FBL/Basic-B & N-01; BLS, Hungary; FHS/F-01) and observed with an emission filter (FHS/EF-2G2; BLS, Budapest, Hungary).
In the second part of the thesis the properties of the CR-positive neurons were studied using the transgenic strain “Tg(Calb2-EGFP)CM104Gsat/Mmmh”. The genotype of this strain is modified to contain multiple copies of a modified BAC, in which eGFP is inserted immediately upstream of the coding sequence of the CR gene (Gong et al., 2003). Transgenic mice were identified through the genotyping protocol supplied by the Mutant Mouse Regional Resource Centers (MMRRC).
The two strains were maintained as heterozygous by breeding with wild-type inbred mice.
Ethical statement
The experimental process was designed to minimize animal number and suffering of the animals used. The protocols adopted were designed according to European Council Directives (609/1986 and 63/2010) and Italian laws (DL 116/92 and D.Lgsl. 26/2014) on the protection of animals used for scientific purposes. The experimental procedures were approved by the Ethical Committee for Animal Experiments of the Ferrara University (CEASA), by the Directorate-General for Animal Health of the Ministry of Health, and supervised by the Campus Veterinarian of the University of Ferrara.
Surgical procedures
Mice between 25 and 60 days have been used in the experiments. Once isolated by beheading, the head was submerged in refrigerated and oxygenated high sucrose artificial cerebrospinal fluid (ACSF) solution (see Solutions). In this solution, sodium chloride was
24
substituted with an equiosmolar quantity of sucrose to limit the excitotoxic damage. The whole brain was then removed from the cranium and the olfactory bulbs are dissected.
To obtain isolated neurons, an enzymatic and mechanical dissociation was executed. Olfactory bulbs were separated in small pieces and moved in a flask, containing 3% protease type XXIII dissolved in a dissecting medium (see Solutions). The enzymatic digestion was realized at 37 °C. After 30-45 min, the medium containing the protease was removed and replaced with a solution containing dissecting medium, 1% bovine serum albumin and 1% trypsin inhibitor to stop enzymatic activity (10 min at 37 °C). Later, bulbar pieces were moved into a new flask containing Tyrode’s solution (see Solutions). A suspension of olfactory bulb neurons was obtained forcing the pieces through home-made fire-polished Pasteur pipettes of varying gauges. Isolated cells were plated on glass coverslips previously coated with concanavalin A (1 mg/ml) to facilitate adhesion and kept in incubator. After 12 hours, bulbar neurons could be used for the experiment. This protocol is a modified version of the procedure described by Gustincich (Gustincich et al., 1997). To obtain slices, isolated olfactory bulbs were included in a cube-shaped block of low gelling temperature agarose. The block was then fixed to the slicing chamber of the vibroslicer using cyanoacrylate glue, and submerged in refrigerated and oxygenated ACSF. Low temperature and agar inclusion contributed to the mechanical stability of the tissue. Olfactory bulbs were then cut in the frontal plane obtaining slices with a thickness of 100-150 µm.
Recording conditions
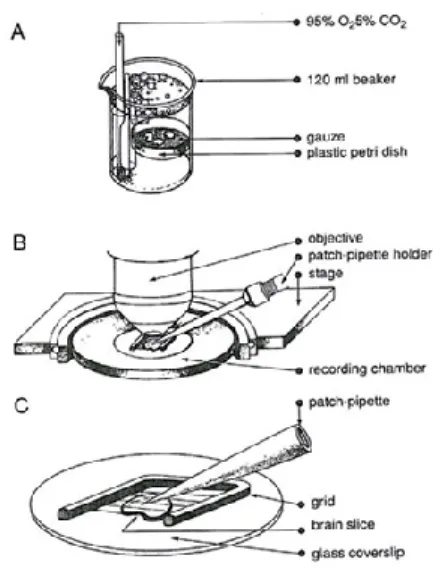
During the experiment, the 1-ml recording chamber was constantly perfused with an approximately 2 ml/min flux of solution. The temperature in the chamber was regulated with a couple of 39.7 Peltier devices (RS Components) and measured with a high-precision, low mass thermocouple (RS Components). Slices were covered by a homemade grid in inert material to avoid vibrations and folding of the preparation during the recordings (Figure 8). The upright microscope used in the experiments was the Olympus BX50WI, equipped with Nomarski DIC (Differential Interference Contrast) optics. The microscope was equipped with epifluorescence, in order to identify eGFP-expressing cells in the preparation.
Figure 8 Slice preparation and recording conditions. A: After sectioning, slices are kept in a carbogenated high sucrose ACSF where they remain until use. B: recording chamber under the water immersion objective of the microscope. C: a grid is used to fix the slice.
25
The 5 cm long pipettes used in the experiments were produced with a P-97 puller (Sutter Instruments) starting from 10 cm long borosilicate glass capillaries (1.5 outer diameter, 0.87 inner diameter, with filament). The electrical resistance measured when the pipettes were filled with intracellular solution and immersed in the bath solution ranged from 4 to 7 MΩ.
The experimental setup included a remote-controlled micromanipulator PatchMan (Eppendorf), a microelectrode amplifier Axopatch 200B (Molecular Devices) and a 12 bit A/D-D/A converter Digidata 1320A (Molecular Devices). Finally, an air pressure controller MCPU-3 (MPI, Lorenz Meβgerätebau) was used to regulate the pipette inside pressure and the fluid level in the recording chamber.
Patch clamp technique
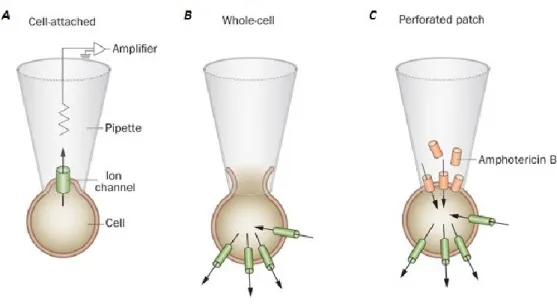
The patch clamp is a powerful electrophysiological technique that allows recording of single-channel currents and whole cell recordings also from very small cells, inaccessible to classical sharp electrodes. This technique, introduced by the Nobel prize laureates Neher and Sakmann (Neher and Sakmann, 1976), utilizes large-bore pipettes to contact the cell and electrically isolate a membrane patch, which is tightly sealed to the tip of the pipette (Hamill et al., 1981).
Figure 9 Patch clamp configurations. A: In the cell-attached configuration, the patch electrode is sealed to the surface of an intact cell, allowing channel activity in the patch of membrane under the electrode tip to be studied under physiological conditions. B: The standard whole-cell configuration is obtained by forming a cell-attached patch and then destroying the patch membrane with strong suction to gain electrical access to the cell interior. The intracellular solution then dialyses with that in the patch. C: The perforated patch configuration preserves cellular metabolism and intracellular second messenger systems by using a pore-forming antibiotic (such as amphotericin B) to provide electrical access to the cell interior. Image adapted from (Ashcroft and Rorsman, 2013).
26
If the rupture of the membrane patch through a negative pressure follows the seal formation, it is possible to record ionic currents that flows through the entire cell membrane. In addition, as for conventional intracellular recordings, it is possible to obtain information about the passive properties of the cell, such as membrane capacitance and resistance. This technical configuration is called whole cell configuration (Figure 9). An important consequence of the whole cell configuration is that the cytosol is rapidly replaced by the intracellular solution contained in the micropipette. In some experiments, this feature can be an advantage, as it can be exploited for the application of specific drugs, but in many cases the wash out of the intracellular components is a problem, as for studies of currents sensitive to intracellular signaling molecules . In order to circumvent this problem, the perforated patch configuration has been developed (Figure 9). After the seal formation, a perforating agent (usually an antibiotic) contained in the micropipette filling solution creates pores on the membrane patch, allowing the electrical communication with the cytosol. Generally, these pores permit the transit of monovalent ions, but avoid the dilution of larger intracellular soluble chemicals, like second messenger molecules. Both these configurations have been used in my thesis, depending on the goal of each experiment. In my investigation two different methods of the patch clamp technique have been employed: voltage clamp and current clamp. The first method allows the control of membrane potential of the cell, recording the currents that flow through the cell membrane. This result is achieved by an electronic feedback system, which enables a differential amplifier to detect any variation of the membrane potential with respect to the potential established by the experimenter and correct it instantaneously. On the contrary, using the current clamp method it is possible to control the current injected into the cell, leaving the membrane potential to follow. In this way, the variations of membrane potential can be monitored.
Solutions
Depending on the distinct purpose of each experiment, different solutions have been used. All the composition listed below are expressed in mM.
For the dissection and slice preparation the solution used was:
High sucrose ACSF solution: 215 sucrose, 3 KCl, 21 NaHCO3, 1.25 NaH2PO4, 1.6 CaCl2, 2 MgCl2,
and 10 glucose.
Two solutions were utilized in the dissociation protocol. The pH of these solutions is adjusted to 7.4 with NaOH and they are continuously bubbled with 100% O2.
27
Dissecting medium: 82 Na2SO4, 30 K2SO4, 10 HEPES
(4-(2-hydroxyethyl)-1-piperazineethanesulfonic acid), 5 MgCl2, 10 glucose, and 0.001% phenol red indicator.
Tyrode’s solution: 137 NaCl, 5.4 KCl, 1.8 CaCl2, 1 MgCl2, 5 HEPES, 20 glucose.
During the electrophysiological experiments, several extracellular solutions (EC) have been employed to characterize the different conductances under study.
EC1, standard ACSF extracellular solution: 125 NaCl, 2.5 KCl, 26 NaHCO3, 1.25 NaH2PO4, 2
CaCl2, 1 MgCl2, and 15 glucose.
EC2, normal K+ plus TEA EC solution: 100 NaCl, 2.5 KCl, 26 NaHCO
3, 1.25 NaH2PO4, 2 CaCl2, 1
MgCl2, 20 TEA, and 10 glucose.
EC3, high K+ plus TEA EC solution: 70 NaCl, 32.5 KCl, 26 NaHCO
3, 1.25 NaH2PO4, 2 CaCl2, 1
MgCl2, 20 TEA, and glucose.
EC4, no Na+ plus TEA EC solution: 110 CholineCl, 2.5 KCl, 26 NaHCO
3, 1.25 NaH2PO4, 2 CaCl2, 1
MgCl2, 20 TEA, and 10 glucose.
The osmolarity of all the solutions without HEPES was adjusted at 305 mOsm with glucose. EC solutions are continuously bubbled with 95% O2 and 5% CO2 during the experiment. In all the
recordings in slices, kinurenic acid (1 mM) and bicuculline (10 µM) have been added to the EC to abolish glutamatergic and GABAergic synaptic activity.
The standard pipette-filling intracellular solution used contained (in mM): 120 KCl, 10 NaCl, 2 MgCl2, 0.5 CaCl2, 5 EGTA (ethylene glycol tetraacetic acid), 10 HEPES, 2 Na-ATP, and 10
glucose. The osmolarity of IC solution was adjusted to 295 mOsm with glucose, and the pH to 7.2 with KOH. The free calcium concentration with this internal solution was calculated to be 16 nM.
In perforated patch configuration, the perforating agent added to the intracellular solution in the recording pipette was amphotericin B (200 mg/ml, plus 300 mg pluronic F-127). To avoid unmonitored spontaneous transformation from perforated patch to whole cell configuration, the calcium chloride concentration in the recording pipette was increased to 3 mM and EGTA was absent.
28
Data analysis
Offline analysis was performed using version 10.3 of pClamp (Molecular Devices) and version 9.0 of Origin (OriginLab Corporation). Unless otherwise indicated, data are presented as means ± s.e.m. When used, box charts represent the mean (the central line, the S.E. (the box), the min-max values (the whiskers) of the data. Statistical significance of the results was calculated with Student’s t test, one-way or two-way analysis of variance (ANOVA), as indicated. D’Agostino & Pearson omnibus normality test was used. A P value of <0.05 is considered significant.
29
30
PART I
h-current in dopaminergic PG cells
The topic of the first part of my thesis is the characterization of the h-current, one of the two hyperpolarization-activated conductance in the dopaminergic periglomerular neurons of the olfactory bulb.
These cells belong to the first type of PG neurons, which extends its dendrites in both ON and non-ON zone and represents a fundamental component of the glomerular circuitry. In the laboratory where I conducted my Ph.D. experience, the electrophysiological properties of the dopaminergic cells in the bulbar glomerular layer have been already analyzed (Pignatelli et al., 2005). Five depolarization-activated currents have been detected in these cells. The two main conductances are a fast transient sodium current and a non-inactivating potassiumcurrent; two different types of calcium conductances (L-type and T-type) and a persistent sodium current have been also characterized.
The transgenic mouse strain used in the experiments described below carries the reporter protein GFP under the control of the TH promoter, and represents a reliable animal model for the study of dopaminergic cells in the murine CNS (Saino-Saito et al., 2004; Maher and Westbrook, 2008; Pignatelli et al., 2009).
In this study, the recordings have been obtained from 285 TH-positive cells. During the experiments, periglomerular cells have been distinguished from the other types of juxtaglomerular cells not only for the presence of the reporter protein but also for their morphology (location in the GL, soma shape, dendritic arborization, etc.) and biophysical properties: input resistance (915.69 ± 31.31 MΩ, n=248), membrane capacitance (8.54 ± 0.21 pF, n=285) and regular firing.
Identification
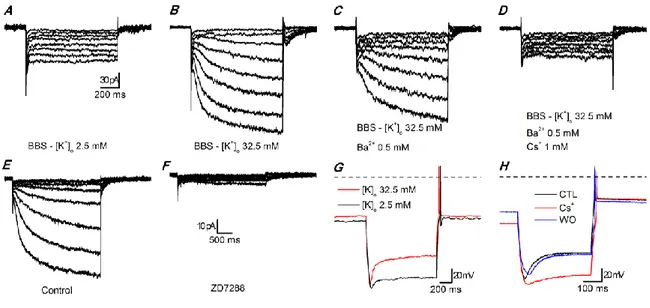
In perforated patch configuration and voltage clamp mode, application of hyperpolarizing voltage commands from -50 mV to -130 mV (10 mV increments, 10 s interval) elicits a small current at room temperature both in slices and dissociated cells (Figure 10A), current which was mistaken for leakage conductances in the first experiments. To record larger h-currents, it is preferable to increase the external potassium concentration (EC3, [K+]
o = 32.5 mM), (Figure 10B). In addition, to
isolate the Ih, 0.5 mM Ba2+ is added in the bath to suppress the Kir current component, which is
activated in the same range of potentials (Figure 10C). The residual current can be blocked by 1 mM Cs+ (Figure 10D) or 30 µM ZD7288 (Figure 10E-F), a non-selective and a selective blocker of
31
Furthermore, under current clamp conditions in EC2 solution, the injection of a negative current (-60 pA) provokes the appearance of a sag, a hallmark of the Ih presence in the cells. The
sag is enhanced by increasing the external potassium concentration (Figure 10G) and suppressed in presence of 1 mM Cs+ (Figure 10H).
The dependence of the current amplitude on external potassium concentration, the slow kinetics of activation, and the distinctive pharmacology, confirm that the conductance under study is an h-current.
Figure 10 Hyperpolarization-activated currents in slices.
A-D: currents activated by hyperpolarizing steps. A - Standard EC saline (EC1, with 0.6 µM TTX, 100 µM Cd2+); B - High K+
EC saline (EC3, with 0.6 µM TTX, 100 µM Cd2+); C - Same as B plus 0.5 mM Ba2+ to block the Kir current; D - Same as C
after addition of a blocker of the h-current (1 mM Cs+). The recordings have been taken after 5 min at any change of the
bathing conditions. All the recordings of this group have been performed with synaptic blockers in the bath; perforated patch in slice at 34 °C.
E-F: effect of 7 min application of 30 µM ZD7288; perforated patch in slice; EC3 saline with 0.6 µM TTX, 100 µM Cd2+, 0.5
mM Ba2+; RT.
G - Current clamp responses to the injection of a hyperpolarizing current step (-60 pA) in a dopaminergic cell; black trace
recorded in normal [K+]o (EC2), red trace recorded in high [K+]o (EC3); resting potential was -64.9 and -57.8 mV in normal
and high K+, respectively; both recordings have been performed with synaptic blockers, perforated patch in slice at 26
°C.
H - Current clamp responses to the injection of a hyperpolarizing current step (-56 pA) in a dopaminergic cell; all traces
have been recorded in high [K+]o (EC3) plus synaptic blockers; the red trace has been recorded in the same saline plus 1
mM Cs+; resting potential was -55.8, -73.2 and -55.3 mV in control, Cs+ and washout, respectively; current-clamp
32
Basic properties
The kinetics of the h-current has been investigated under voltage clamp conditions. In order to suppress the other currents, a mixture of blockers has been always added to the extracellular solutions: 0.6 µM TTX for sodium currents, 0.1 mM Cd2+ for calcium currents, and 0.5
mM Ba2+ for K
ir current.
The two-step protocol applied to study the activation kinetics consists of hyperpolarizing voltages ranging from -60 to -130 mV (10 mV increments, 10 s interval), from an holding potential of -40 mV; at the end of this first step, followed by a second hyperpolarizing pulse to -130 mV, in order to completely activate the Ih (Kamondi and Reiner, 1991). An example of the currents evoked
by this protocol in a dopaminergic PG neuron is shown in Figure 11A. It is possible to observe that the h-current manifests a slow activation, and rises in amplitude as the hyperpolarization is prolonged. Inactivation is not detected.
As explained in the introduction, two different components can be distinguished in the Ih:
an instantaneous current (Iins) and a steady-state current (Iss). The first, detected at the onset of
the step, has been observed to be virtually linear along the applied voltage; the second, on contrary, has been measured at the end of the voltage command and increases in amplitude as the membrane potential becomes more negative.
The Ih amplitude is calculated as the difference between the Iss and the Iins; the latter is
measured fitting the h-current with a double exponential equation and extrapolating the value at the time of the onset of the hyperpolarizing command. The I/V relationships of Ih in different
conditions are illustrated in Figure 11B. Firstly, it should be noted that the current amplitude measured in dissociated cells (n=11) is 30.7 ± 1.2 % smaller than in slices (n=14). Moreover, amplitude of this current is also strongly sensitive to temperature. This aspect will be further discussed. Consequently, most of the experiments have been made under controlled temperature in slices, in order to standardize the recording conditions.
To create the activation curves of h-current, Ih tail currents (recorded in response to the
-130 mV pulse of the two-step protocol) have been normalized on the maximal amplitude and plotted as a function of the voltage. Then, curves have been fitted by the following Boltzmann equation (Eq. 1):
1 50/
1
exp
v
V
k
I
I
m tailmax tail where:- Itail is the amplitude of the tail recorded at -130 mV;
- Itailmax is the maximal amplitude of the tails;
33
- V50 is the half-maximal activation potential, the voltage for which half of the channels are
open;
- k is the slope factor, representing the dependence of the opening of channels by the change of potential.
The dependence of the V50 from the duration of the conditioning step has been evaluated
changing the length of the first command in the two-step protocol. Durations of 1, 2, and 4 s have been tested. Longer durations cause the shift of the steady-state activation curve to more positive potentials (Figure 11C). Average data, obtained from 9 cell at 37 °C, show that V50 changes from
-94.1 ± 2.0 mV for 1 s stimuli to -84.5 ± 1.2 mV for 4 s stimuli.
Finally, the deactivation time constant τ has been analyzed using a double-pulse protocol: from a holding potential of -40 mV, two hyperpolarizing steps to -130 mV (4 s) have been applied, separated by a voltage command to -40 mV of variable duration (Figure 12A). Deactivation of h-current at -40 mV and the envelope of reactivation records at -130 mV share a similar exponential time course, as illustrated in Figure 12B. Amplitudes of the tail currents elicited in the second hyperpolarizing pulse have been normalized and plotted as a function of the length of the repolarizing pulse applied. It is possible to fit the experimental values through the following exponential function (Eq. 2):
n i t ie
C
A
t
f
i 1)
(
where f(t) is the normalized current amplitude at time t, and τi is the deactivation time constant
at the indicated potential.
A last series of experiments in this part of the study has been carried out in order to analyze the reversal potential of the h-current. A specific protocol has been utilized: a fixed hyperpolarized potential of -120 mV is imposed to the cell membrane, followed by commands to various voltages (Figure 14A-B). It has been observed that the reversal potential depends on potassium and sodium ion concentrations. In figure 5, the dependence on [K+]
o has been analyzed:
on average, the reversal potential of the current is -20.18 ± 1.67 mV (n=9) in EC3, and -43.95 ± 1.51 mV in EC2 (n=7).