Introduction
Resistin is a novel signalling molecule induced during
adipogene-sis [1]. Readipogene-sistin serum levels increase in obesity and readipogene-sistin gene
expression is induced during adipocyte differentiation. In addition,
administration of resistin impaires glucose tolerance and insulin
action while neutralization of resistin reduces hyperglycaemia in
the mouse model of diet-induce insulin resistance [1].
Anti-resistin IgG also potentiate insulin-stimulated glucose uptake
sup-porting the notion that resistin’s effects on glucose metabolism
are antagonistic to those of insulin.
Recently Yura et al. [2] demonstrated resistin gene
expres-sion in trophoblastic tissue. This expresexpres-sion is significantly
higher in term placenta than in first trimester chorionic villi.
Serum resistin levels are similar among non-pregnant women
and those in the first and second trimesters of normal
preg-nancy, but are significantly higher in the third trimester [3]. On
the other hand, resistin gene expression in adipose tissue of
non-pregnant women is rather weak and does not differ from
adipose tissue of pregnant women at term [3]. Based on these
findings, it is reasonable to speculate that resistin production by
the placenta is the main cause of the increase in serum resistin
during gestation.
The increase of serum resistin in the third trimester of
preg-nancy may contribute, with several placental-derived hormones,
to the decreased insulin sensitivity of pregnant women in the
latter half of pregnancy. The decreased insulin sensitivity can be
related to the development of post-prandial hyperglycaemia,
benefical for the rapid growth of the foetus.
Glucose is a primary substrate for foetal energy metabolism and
in the absence of appreciable gluconeogenesis [4] placental
trans-port constitutes the only supply for the foetus. Insulin stimulates
Resistin modulates glucose uptake and glucose
transporter-1 (GLUT-1) expression in trophoblast cells
Nicoletta Di Simone
a,*, Fiorella Di Nicuolo
a, Daniela Marzioni
c,
Mario Castellucci
c, Maurizio Sanguinetti
b, Silvia D’Ippolito
a, Alessandro Caruso
a aDepartment of Obstetrics and Gynecology, Catholic University of Sacred Heart, Rome, Italy
b
Department of Microbiology, Catholic University of Sacred Heart, Rome, Italy
c
Institute of Normal Human Morphology, Faculty of Medicine, Polytechnic University of Marche Region, Ancona, Italy
Received: September 17, 2007; Accepted: April 4, 2008
Abstract
The adipocytokine resistin impairs glucose tolerance and insulin sensitivity. Here, we examine the effect of resistin on glucose uptake in
human trophoblast cells and we demonstrate that transplacental glucose transport is mediated by glucose transporter (GLUT)-1.
Furthermore, we evaluate the type of signal transduction induced by resistin in GLUT-1 regulation. BeWo choriocarcinoma cells and
pri-mary cytotrophoblast cells were cultured with increasing resistin concentrations for 24 hrs. The main outcome measures include glucose
transport assay using [
3H]-2-deoxy glucose, GLUT-1 protein expression by Western blot analysis and GLUT-1 mRNA detection by
quan-titative real-time RT-PCR. Quanquan-titative determination of phospho(p)-ERK1/2 in cell lysates was performed by an Enzyme Immunometric
Assay and Western blot analysis. Our data demonstrate a direct effect of resistin on normal cytotrophoblastic and on BeWo cells: resistin
modulates glucose uptake, GLUT-1 messenger ribonucleic acid (mRNA) and protein expression in placental cells. We suggest that ERK1/2
phosphorylation is involved in the GLUT-1 regulation induced by resistin. In conclusion, resistin causes activation of both the ERK1 and
2 pathway in trophoblast cells. ERK1 and 2 activation stimulated GLUT-1 synthesis and resulted in increase of placental glucose uptake.
High resistin levels (50–100 ng/ml) seem able to affect glucose-uptake, presumably by decreasing the cell surface glucose transporter.
Keywords: resistin
•
human
•
trophoblast
•
glucose
*Correspondence to: Nicoletta DI SIMONE, M.D., Department Obstetrics and Gynecology, Catholic University of the Sacred Heart, Largo Gemelli 8, 00168 Rome, Italy. Tel.: ⫹39630154298
Fax: ⫹3963051160
J. Cell. Mol. Med. Vol 13, No 2, 2009
glucose uptake by recruitment of insulin-sensitive glucose
trasporters (GLUTs). Among them, GLUT-1 is mainly present in the
micovillous membrane and basal membrane of the
syncytiotro-phoblast in third trimester of gestation [5–7]. Alterations in
GLUT-1 expression may result from changes in plasma glucose or insulin
sensitivity in a variety of cells and tissues [8, 9]. Recent in vitro
experiments suggest that resistin is able to alter glucose uptake in
skeletal as well as in cardiac muscle [10], inhibiting translocation,
activation of glucose transporters vesicle recycling. Exposure of
3T3L1 adipocytes to resistin impairs insulin-stimulated glucose
uptake, whereas exposure to anti-resistin IgG augments glucose
uptake [1]. However, no data are available about the role of resistin
in human pregnancy and on placental glucose transport.
The aim of this study is to determine both the role of resistin
on glucose transport in the human placenta and the type of signal
transduction induced by resistin in GLUT-1 regulation. A cascade
of signalling events is required for glucose uptake. At present, it is
clear that activation of classical mitogen-activated protein kinase
(MAPK), also termed extracellular signal-regulated kinase (ERK),
plays a central role in cellular transformation, up-regulates
GLUT-1 expression, thereby augmenting glucose transport [GLUT-1GLUT-1, GLUT-12]. To
understand the direct biological effect of resistin on placental
glu-cose uptake, we treated trophoblast cells with recombinat resistin
and we examined the effect on 2-
3H-deoxyglucose uptake and
GLUT-1 regulation. We demonstrate a direct effect of resistin in
both normal cytotrophoblastic cells and on a choriocarcinoma cell
line (BeWo), which is a widely used model for first trimester
tro-phoblast. Resistin modulates glucose uptake, GLUT-1 messenger
ribonucleic acid (mRNA) and protein expression in placental cells.
The next question concerns which type of signal transduction,
induced by resistin, is involved in GLUT-1 regulation. Previous
studies have demonstrated that the activation of MAP kinases
plays a pivotal role in controlling the action of resistin in several
type of cells [13, 14]. Thus, we investigated the effect of resistin
on MAP kinases signals in trophoblast cells. Our results suggest
that the phosphorylation of ERK1/2 is probably involved in GLUT-1
regulation induced by resistin.
Materials and methods
Cell cultures
BeWo choriocarcinoma cells were obtained from the AmericanType Culture Collection (ATCC, Rockville, MD, USA). Cells were cultured in F12-K medium (ATCC), containing 10% FBS (Sigma, St. Louis, MO, USA) and 2% penicillin/streptomycin (Sigma) at 37°C in a humidified atmosphere of 5% CO2 and 95% air.
Placentas were obtained from healthy women immediately after uncomplicated vaginal delivery at 36–37 weeks of gestation. Maternal consent was obtained according to the guidelines of the ethics commit-tee. Cytotrophoblast cells were isolated as detailed elsewhere [15]. Briefly, placental tissues were rinsed 3 times in cold Dulbecco’s modified Eagle’s medium (DMEM)-10% FBS (Sigma). After mincing, the tissues were
submitted to repeated enzymatic digestions in Ringer-bicarbonate buffer containing 0.25% trypsin (Gibco BRL, Grand Island, NY, USA) and DNAse I (Sigma) at 37°C in a shaking water bath. The supernatants were filtered through a 42-m mesh filter and centrifuged (200 g at room temperature
for 7 min.); then the cell suspension was layered over a performed Percoll (Amersham Pharmacia, Little Chalfont, UK) gradient in Hank’s balanced salt solution (HBSS; Gibco BRL). The gradient was made from 5% to 70% Percoll (v/v) by dilutions of 90% Percoll (9 parts Percoll, HBSS 10⫻,
1 part) and layered in a 50-ml conical polystirene centrifuge tube. After centrifugation (200 g at room temperature for 20 min.), the middle layer was removed, washed and then resuspended in DMEM. Cytotrophoblast cell viability was (90% by trypan blue dye exclusion. The purity of the cell preparation was evaluated by immunohistochemical staining for markers of (i ) macrophages (3%, determined using a polyclonal anti-
chymotrypsin antibody; Dako, Santa Barbara, CA, USA), (ii ) fibroblasts (2%, determined using a polyclonal anti-vimentin antibody; Labsystems, Helsinki, Finland) and (iii ) syncytiotrophoblast (1% determined using an mAb against low molecular weight cytokeratins; Labsystems, Chicago, IL, USA). The enriched (95%) cytotrophoblast cells were cultured in DMEM-10% FBS at 37°C in 5% CO2/95% air.
Bewo and cytotrophoblast cells were cultured for 24, 48 or 72 hrs in standard medium and counted to evaluate their morphological changes. Then Both BeWo and cytotrophoblast cells were cultured for 48 hrs and then treated with human recombinant Resistin (Phoenix Pharmaceutical Inc., Belmont, CA, USA) for additional 24 hrs.
Glucose transport assays
Glucose uptake was measured using [3H]-2-deoxy glucose (2-DG; Amersham Biosciences, UK). Briefly, BeWo and normal cytotrophoblast cells were seeded on plates with 24-wells (8⫻104 cells/well) and incubated with resistin (0, 10, 50, 100 ng/ml) for 24 hrs. Then cells were rinsed twice with glucose-free HEPES buffered saline (HBS) (140 mM NaCl, 20 mM HEPES-Na, pH 7.4, 2.5 mM MgSO4, 5 mM KCl, 1 mM CaCl2). 2DG uptake
was monitored at room temperature and quantitated using 10 M 2-DG (1 Ci/ml) for 10 min. during which period the uptake of glucose was linear. Cytochalasin B (10 M), a potent inhibitor of glucose transport medi-ated via facilitative glucose transporters [16], was used as negative control. The uptake of glucose into trophoblast cells was terminated by rapidly aspirating the radioactive incubation medium, followed by three successive washes of cells monolayer with ice-cold isotonic saline solution (0.9% NaCl, w/v). Cell-associated radioactivity was determined by lysing cells with 0.05 NaOH and preparing an aliquot of the lysate for liquid scintillation counting. Total cell protein was determined by the Bradford method [17].
Western blot analysis
BeWo and cytotrophoblast cell cultures were performed for 24 hrs with resistin (0, 10, 50, 100 ng/ml). GLUT-1 expression was investigated by Western blot analysis as previously described [18]. Briefly, plasma membranes (post-nuclear particulate fraction without cytosolic compo-nents) from trophoblast cells were prepared by a procedure reported by Shah et al. [19]. Cell pellet was resuspended in 20 ml of ice-cold buffer (250 mM sucrose, 20 mM HEPES, pH 7.4, 2 mM EGTA, 3 mM NaN3)
con-taining freshly added protease inhibitors (200 M
pheylmethylsulphonyl-fluoride and 1 M leupeptin; Sigma) and homogenized in a 40 ml glass
membranes were resuspended in homogenising buffer and frozen at
⫺80°C until required. Eighty µg of each sample (total membranes) were
separated on a 12% SDS-polyacrylamide gel, and after electroblotting onto polyvinylidene fluoride (PVDF) membranes (Millipore, Bedford, MA, USA). The membranes were incubated with 5% non-fat dry milk in 1 mol/l Trizma/base, 1.54 mol/l NaCl, 0.05% Tween 20 (TBST, pH 7.4) and then incubated overnight at 4°C with primary antibody (anti-GLUT-1 polyclonal IgG antibody; Santa Cruz Biotecnology, Santa Cruz, CA, USA). After incu-bation with secondary antibody, the immunocomplexes were visualized performed with ECL-Plus detection System (Amersham) according to the instruction of the manufacturer. Bands were analysed on the image analy-sis system Gel Doc 200 System (Biorad Laboratories) and quantified per-formed with the Quantity One Quantitation Software (Biorad). The levels of GLUT-1 was estimated versus the constant level of a 53-kD protein pres-ent in total membranes (-Tubulin; mouse monoclonal antibody; Sigma).
Moreover, in immunoblot analysis we evaluated both, total and phos-phorylate ERKs (pERKs). BeWo and cytotrophoblast cells treated with resistin for 20 min. were collected and lysed with cold lysis buffer (1 mM MgCl2, 350 mM NaCl, 20 mM HEPES, 0.5 mM EDTA, 0.1 mM EGTA, 1 mM
DTT, 1 mM Na4P2O7, 1 mM PMSF, 1 mM aprotinin, 1.5 mM leupeptin, 20%
glycerol, 1% NP-40). Total cell proteins (80 µg) were subjected to electro-foresis on 10% polyacrilamide gel and after electroblotting onto PVDF membrane incubated with 5% non-fat dry milk in TBST 1X and then exposed overnight at 4°C to TBST containing 0.2–0.4 g/ml of primary antibody to total ERK or pERK (anti-ERK polyclonal and anti-pERK mono-clonal IgG antibodies, Santa Cruz laboratories). Following incubation with secondary antibody, the immunocomplexes were visualized as described above. The levels of total or pERK were estimated versus the constant level of a 42-kD protein present in the cytosolic extract (-actin; mouse mono-clonal, Sigma-Aldrich; data not shown).
In a next set of experiments, we investigated effects of a specific inhibitor of the MAPK-pathway on phophorylation of ERK 1/ 2. BeWo and cytotrophoblast cells were treated with resistin (10 ng/ml) and/or ERK 1/2 kinase inhibitor (PD98059, 25 M; Sigma) for 24 hrs and GLUT-1 expres-sion was studied by Western blot as previously described.
Quantitative real-time RT-PCR
mRNA studies have been done both on BeWo and primary cytotrophoblast cells cultures. Total cellular RNA was extracted performed with ‘QuickPrep’ Total RNA Extraction Kit (Amersham Biosciences) according to the manu-facturer’s protocol. Briefly, cell pellets, obtained from BeWo and cytotro-phoblast cells grown with resistin (0, 10, 50, 100 ng/ml) for 24 hr, were suspended in Lithium Chloride solution, -mercaptoethanol and extraction
buffer. Then, samples were homogenized and incubated for 10 min. in ice with Caesium Trifluoroacetate (CsTFA) solution. After centrifugation at 14,000 rpm for 15 min., RNA pellets were washed and dissolved in 50 l
of DEPC-treated water. RNA concentration was evaluated by monitoring absorbance at 260/280 nm.
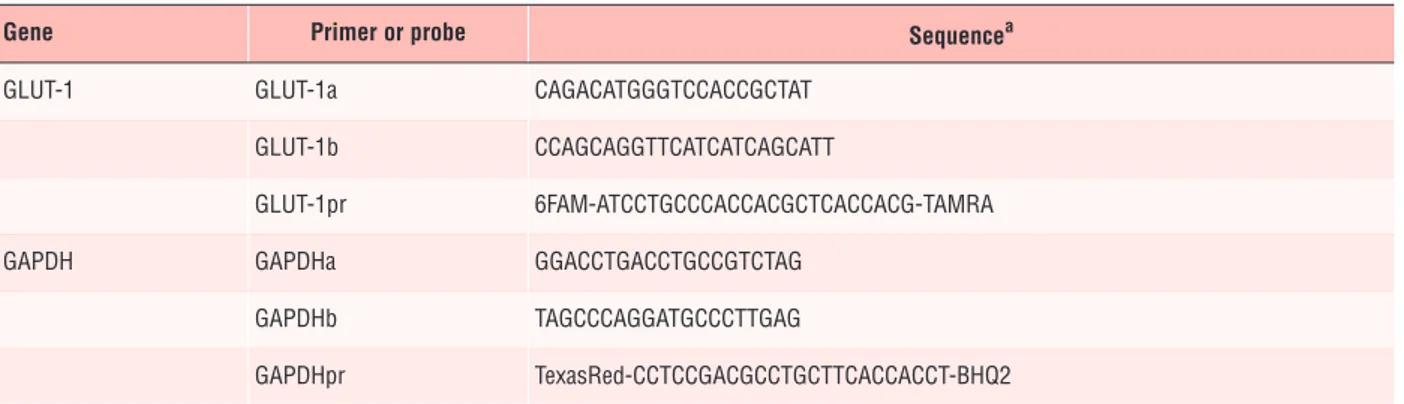
Quantitative expression of the GLUT-1 gene was performed by real-time PCR using the i-Cycler iQTMsystem (Bio-Rad Laboratories, Hercules, CA, USA). For the target gene and the endogenous housekeeping gene encod-ing for glyceraldehyde-3-phosphate dehydrogenase (GAPDH), a primer pair and Taqman probe, which hybridizes to the region between primers, were designed performed with Beacon Designer 2 v. 3.00 software (Premier Biosoft International, Palo Alto, CA, USA) and synthesized by MWG Biotech (Florence, Italy) (Table 1). Quantitative PCR was performed in a 50-l
vol-ThermoScript Plus/Platinum Taq mix (Invitrogen), each primer pair and Taqman probe at concentration of 0.5 M, 5 l of total RNA sample and
distilled water up to final volume. Samples were subjected to an initial step at 52°C for 45 min. for RT; 94°C for 5 min. to inactivate the ThermoScript Plus reverse transcriptase and to activate the Platinum Taq polymerase; and 50 cycles, each consisting of 15 sec. at 94°C and 1 min. at 59°C. Fluorescent data were collected during the 59°C annealing/extension step and analysed with the iCycler iQTMsoftware (Bio-Rad). Each reaction was run in quadruplicate. Mean threshold cycle (Ct) was determined for each transcript and was plotted versus RNA concentration input to calculate the slope. Amplification efficiency for all genes was then determined [20, 21]. For relative quantification of the target genes, each set of primer pairs and Taqman probe were used in combination with that of GAPDH gene in sepa-rate reactions. The relative mRNA expression levels of the target genes in each sample were calculated using the comparative cycle time (Ct) method
[22]. Briefly, the target PCR Ctvalue (i.e. the cycle number at which emitted
fluorescence exceeds 10 ⫻ the standard deviation [S.D.] of baseline
emis-sions as measured from cycles 3 to 15) is normalized to the GAPDH PCR Ct
value by subtracting the GAPDH Ctvalue from the target PCR Ctvalue,
which gives the ⌬Ctvalue. From this ⌬Ctvalue, the relative mRNA
expres-sion level to GAPDH for each target PCR can be calculated using the follow-ing equation: relative mRNA expression = 2⫺(Ct target-Ct GAPDH).
To assess the validity of GAPDH as a reference gene for comparative studies of gene expression with and without resistin treatment, an absolute quantification of GAPDH transcripts was performed. To this end, a stan-dard curve was constructed by plotting serial dilutions of a cloned GAPDH gene fragment (range 1012 to 106 copies/reaction) and used to quantify GAPDH mRNA in samples of RNA extracted from BeWo and cytotro-phoblast cells treated or not with resistin (50 ng of total RNA for each sam-ple). The results were expressed as GAPDH copies per g of total RNA.
Similar amounts of GAPDH mRNA were found in cells grown in absence or in presence of resistin (1.2 ⫻ 1011versus 0.9 ⫻ 1011copies/g of RNA).
This finding demonstrated that resistin does not affect GAPDH expression in BeWo choriocarcinoma cells.
Immunocytochemistry
BeWo cells were treated for 24 hrs with resistin (0, 10, 50, 100 ng/ml) and then fixed with 4% paraformaldheide (15 min. at 4°C). After washing 3 times for 5 min. each in phosphate buffer 0.01 M pH 7.6 added with NaCl 0.9% w/v (PBS) at room temperature, cells were incubated in 3% v/v Normal Donkey Serum (Jackson Immunoresearch; West Grove, PA, USA) in PBS for 30 min. at room temperature to block non-specific binding.
Afterwards cells were incubated for 60 min. at room temperature with the primary antibody against GLUT-1 (Rabbit Polyclonal RB-078-A from NeoMarkers; Fremont, CA, USA) diluted at 1:50 v/v in PBS. Cells were washed 4 times for 8 min. each and blocked again with Normal Donkey Serum.
A secondary anti-rabbit antibody (Donkey 711-096-152 from Jackson ImmunoResearch; West Grove, PA, USA) was used diluted 1:200 in PBS and cells were incubated for 30 min. in the dark at room temperature.
After numerous washings, cells were incubated with TOTO-3 iodide (642/660 from Invitrogen) diluted 1:4000 for 30 min. in the dark at room temperature to mark nuclei.
Slides were coverslipped performed with Vectashield Mounting Medium (Vector; Burlingame, CA, USA) and cells were visualized under a motorized Leica DM6000 microscope. Fluorescence was detected with a Leica TCS-SL confocal microscope.
J. Cell. Mol. Med. Vol 13, No 2, 2009
Assay of ERK phosphorylation
Assay for ERK phosphorylation has been done both on BeWo and primary cytotrophoblast cells. ERK1/2 kinases are characterized by the requirement of phosphorylation for full activation and the quantitative determination of phospho(p)-ERK1/2 in BeWo and cytotrophoblast cell lysates was per-formed by an Enzyme Immunometric Assay (EIA) kit (Assay Designs, Inc., Ann Arbor, MI, USA) after treatment with resistin (0, 10, 100 ng/ml) for 10, 20, 30 and 60 min. This kit uses a monoclonal antibody to ERK immobilized on a microtitre plate to bind pERK in the standards or sample. After a short incubation, the excess sample or standard is washed out and a rabbit poly-clonal antibody to pERK was added. This antibody binds to the pERK cap-tured on the plate. After incubation, the excess antibody is washed out and goat anti-rabbit IgG conjugated to Horseradish peroxidase is added, which binds to the polyclonal pERK antibody. Excess conjugated is washed out and substrate is added. After 30 min., the enzyme reaction is stopped and the colour generated is read at 450 nm. The measured optical density is directly proportional to the concentration of pERK.
Statistical analyses
The results are presented as the mean ± S.E. The data were analysed using one-way ANOVA followed by a post hoc test (Bonferroni test). Statistical significance was determined at P < 0.05.
Results
It is known that isolated mononuclear trophoblast cells changed
their morphological aspect during culture from uniformally
dis-tributed cells (24 hrs) to aggregates of two or more cells (48 hrs)
and to multinucleated groups (72 hrs of culture). To formally
demonstrate the in vitro formation of multinucleated cells, Bewo
and cytotrophoblast cells were cultured for 24, 48 and 72 hrs,
removed from the plates (by gentle trypsinization and scraping)
and counted in a hemotocytometer (Table 2).
Effects of resistin on 2DG uptake in trophoblast cells
Uptake of 2DG in both BeWo and nomal cytotrophoblast cells was
linear over the 30-min. assay period (Fig. 1). In the presence of
10-
M cytochalasin B, an inhibitor of facilitative glucose
trans-port, 2DG uptake was suppressed by over 90% and over 78% in
Bewo and cytotrophoblast cells, respectively (Fig. 1).
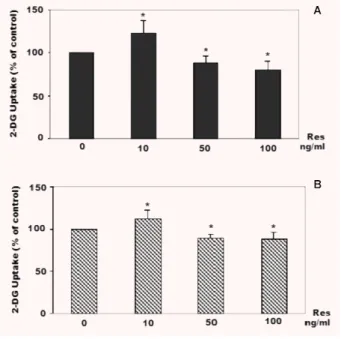
As shown in Figure 2, treatment with resistin (10 ng/ml,
con-centration that is reached in vivo) for 24 hrs led to a stimulation of
2-DG uptake, while higher concentrations (50–100 ng/ml)
signifi-cantly impaired basal glucose uptake.
GLUT-1 expression in trophoblast cells
To study whether the effects of resistin on basal glucose uptake
were due to the regulation of GLUT-1 expression, we analysed the
changes in GLUT- 1 protein and mRNA levels.
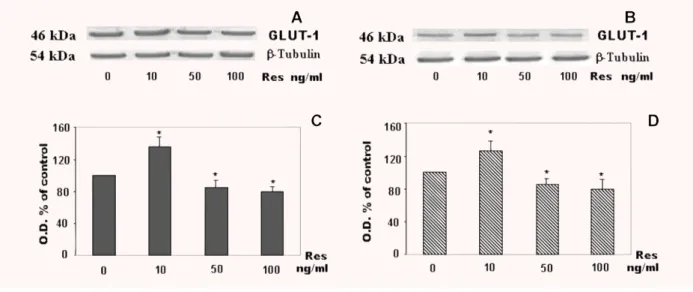
Western blotting analysis showed that there was a significant
increase of GLUT-1 expression after incubation with resistin at dose
of 10 ng/ml, whereas starting from 50 ng/ml there was a reduction
of protein expression (Fig. 3). The mRNA for GLUT-1 was quantified
by real-time RT-PCR. We observed constitutive expression of
1 mRNA in Bewo and cytotrophoblast cells. The intensity of
GLUT-1 mRNA was normalized with the internal control, the GAPDH gene.
As shown in Figure 4 (A and B), GLUT-1 mRNA was increased after
treatment with resistin at dose of 10 ng/ml, but when BeWo cells
were exposed to higher concentrations of resistin (50–100 ng/ml) a
significant reduction in GLUT-1 mRNA was observed.
Table 1 Primers and fluorescent probes used in real-time PCR
a
Abbreviations: 6FAM, 6-carboxyfluorescein; TAMRA,6-carboxy-N,N,N’,N’-tetramethylrhodamine;
Texas Red, trademark product from Molecular Probes; BHQ2, Black Hole Quencer 2.
Gene Primer or probe Sequencea
GLUT-1 GLUT-1a CAGACATGGGTCCACCGCTAT
GLUT-1b CCAGCAGGTTCATCATCAGCATT
GLUT-1pr 6FAM-ATCCTGCCCACCACGCTCACCACG-TAMRA
GAPDH GAPDHa GGACCTGACCTGCCGTCTAG
GAPDHb TAGCCCAGGATGCCCTTGAG
Fig. 2 Effect of resistin (0–100 ng/ml) on glucose uptake in BeWo cells
(A) and in human cytotrophoblast cells (B). Glucose uptake was measured using 10 M [3
H]-2-deoxy glucose (1 Ci/ml) for 10 min. Data are
expressed as percentage of untreated cells (resistin 0 ng/ml; controls): *P < 0.05; Res: resistin.
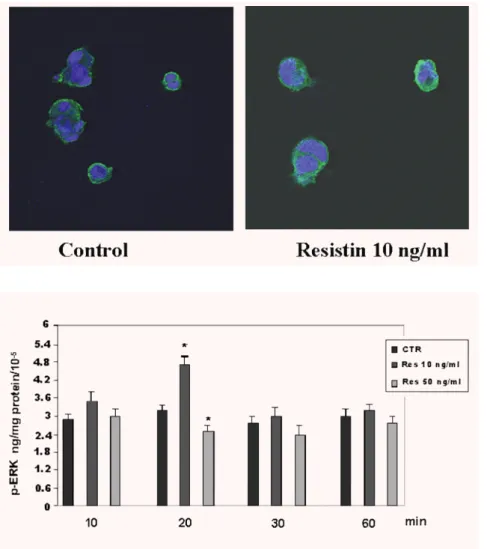
Immunocytochemistry
Immunocytochemistry of BeWo cells treated and non-treated with
resistin showed a reaction product characterized by microspots-like
appearance. The reaction product was mainly localized at the level
of the plasma membranes.
It was possible to observe an increase in GLUT-1 expression in
cells treated with 10 ng/ml of resistin in comparison to non-treated
*Percentage of 200 counted cells.
BeWo Cytotrophoblast cells
Time of culture
24 hrs 48 hrs 72 hrs 24 hrs 48 hrs 72 hrs
Single cells* 82 ± 6 38 ± 9 8 ± 2 79 ± 7 38 ± 4 5 ± 1
Aggregates* 13 ± 3 32 ± 5 12 ± 4 15 ± 2 38 ± 6 10 ± 2
Syncytia* 5 ± 1 30 ± 4 80 ± 5 6 ± 1 24 ± 2 85 ± 6
Fig. 1 Basal glucose uptake in (A) human choriocarcinoma cells
(BeWo) and in (B) human cytotrophoblast cells. Glucose uptake was measured using [3H]-2-deoxy glucose for 30 min. Cytochalasin B (10 M), a potent inhibitor of glucose transport, was used as negative control. Values are means ± S.E. of three different experiments.
cells (Fig. 5), whereas it was difficult to appreciate an evident
difference in GLUT-1 expression between cells treated with 10 ng/ml
and those treated with 50 ng/ml (data not shown).
Resistin-activated ERK 1/2 phosphorylation
To better understand the molecular mechanisms in
resistin-induced GLUT-1 trophoblast regulation, we investigated the possible
involvement of MAP Kinases. MAP activation results in
phosphory-lation of multifunctional protein kinases, including ERKs. The EIA
assay of ERK activity showed the maximal increase of ERK 1/2
phosphorylation in Bewo cells treated with resistin (10 ng/ml) after
20 min. (4.7 ng/mg of proteins/10
⫺5versus control 3.2 ng/mg of
proteins/10
⫺5, P < 0.01) with a decrease at 60 min. (3.3 ng/mg of
proteins/10
⫺5versus control 3.0 ng/mg of proteins/10
⫺5) (Fig. 6).
Treatment of normal cytotrophoblast cells with resistin (10 ng/ml)
led to phosphorylation of ERK1 and ERK2, with a maximal increase
at 30 min. ERK1 and ERK2 phosphorylation returned towards
baseline at approximately 60 min. (data not shown).
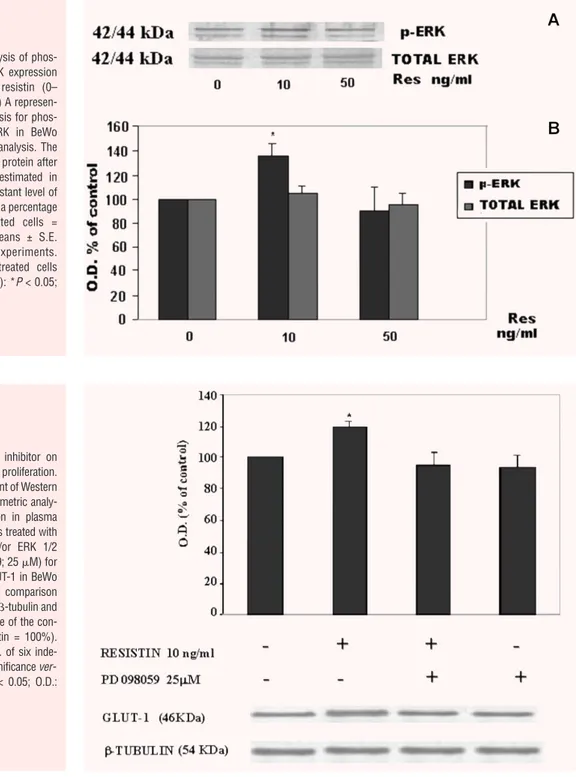
The Western blot analysis of dose-response experiments
showed the increase in ERK1/2 phosphorylation after 20 or 30
min. (Fig. 7) only at 10 ng/ml of resistin. As shown in Figure 7,
total ERK1 and ERK2 expressions were not affected by resistin
treatment, suggesting a specific role of this adipokine in the
regu-lation of phosphoryregu-lation process. Similar results were obtained
with normal cytotrophoblast cells (data not shown).
To clarify whether ERK blockage in BeWo and nor392mal
cytotro-phoblast cells is involved in resistin-induced GLUT-1 expression,
J. Cell. Mol. Med. Vol 13, No 2, 2009
Fig. 3 Analysis of GLUT-1 expression in plasma membranes of BeWo and cytotrophoblast cells treated with resistin (0–100 ng/ml) for 24 hrs.
A representative experiment of Western blot analyses (GLUT-1 protein and -tubulin) in BeWo (A) and normal cytotrophoblast cells (B). Results of densitometric analyses. The level of GLUT-1 in BeWo (C) and normal cytotrophoblast cells (D) was estimated in comparison with the constant level of -tubulin and expressed as a percentage of the control (0 ng/ml resistin = 100%). Results are means ± S.E. of six independent experiments. Significance versus untreated cells: *P < 0.05; O.D.: optical density; Res: resistin.
Fig. 4 Quantitative mRNA expression of GLUT-1 in BeWo (A) and
cytotrophoblast cells (B) treated with resistin (0–100 ng/ml). Total RNA was extracted and levels of GLUT-1 mRNA were measured by Real-time PCR. Data shown are means ± S.E. of three independent experi-ments. The results are presented as the fold increase of mRNA expres-sion with normalization to GAPDH. Res: resistin.
(control) with resistin. The analysis revealed Glut-1 localization in plasma membrane with a microspots-like appearance. An increase of Glut-1 expression is observed in treated cells in comparison to non-treated cells.
Fig. 6 Time-dependent effect of resistin
(0–50 ng/ml) on phosphorylation of ERK1/2 protein in BeWo cells. Cell extracts were analysed for the levels of p-ERK by immunoenzymatic assay as described in Materials and Methods. Results are expressed as ng/mg of pro-tein. Values are means ± S.E. of three separate experiments with triplicate determinations. Significance versus untreated cells (control; CTR: resistin 0 ng/ml): *P < 0.05; Res: resistin.
trophoblast cells were incubated with a well-defined ERK kinase
inhibitor: PD98059. As shown in Figure 8, PD98059 (25
g/ml)
significantly reduced the resistin-induced GLUT-1 expression.
Discussion
Recently, Yura et al. [2] demonstrated resistin gene expression in
trophoblastic tissue, which was significantly higher in term
pla-centa as compared with that in the chorionic villi of the first
trimester. These findings suggested the possibility that the
pla-centa might secrete resistin into the maternal circulation. In fact,
plasma resistin levels of pregnant women at term were
signifi-cantly higher than those of non-pregnant women [3], whereas
plasma resistin levels of non-pregnant women were similar to
those of the first and second trimesters of normal pregnancy.
However, the exact mechanisms behind the increase in serum
resistin during pregnancy have not been clarified. Based on Yura’s
results [2] and the fact that there is an increase in placental
mass with gestation, it is reasonable to speculate that resistin
production by the placenta is the main cause of the increase in
serum level resistin. On the other hand, considering that the
adipose tissue mass increases during pregnancy and that the
expression of resistin in adipose tissue of pregnant women at
term does not differ from that of non-pregnant women [23],
resistin production by adipose tissue might be one of the
causes for the increased serum resistin level in pregnancy. Such
changes in resistin levels could contribute to the decrease
insulin sensitivity in the latter half of pregnancy [24] beneficial
for the rapid growth of the foetus.
Glucose is the primary substrate for foetal energy metabolism
and in the absence of appreciable gluconeogenesis [25], placental
transport constitues the only supply for the foetus. Glucose transport
across the human placenta takes place by facilitated carrier-mediated
diffusion [26, 27]. The kinetic characteristics of glucose transport
have been determined in human syncytiotrophoblast cell membranes
[28, 29] and are consistent with the presence of high-capacity
J. Cell. Mol. Med. Vol 13, No 2, 2009
transport systems in both the maternal and foetal-facing plasma
membranes with affinities in the 25–30 mmol/l range.
Northern blotting has been used to identify human tissues
expressing the facilitative glucose transporter isoforms: GLUT1
and GLUT3 have been shown to be present in high levels in
homogenates of human term placenta [30, 31]. However, a
quan-titative estimate of the glucose transporter proteins demonstrated
the absence of significant amounts of GLUT3 protein and the
pres-ence of GLUT-1 protein in human syncytiotrophoblast [32].
Immunohistochemical data have demonstrated that GLUT-1
pro-tein is abundant on both the microvillous and basal membrane of
the syncytiotrophoblast [33]. We confirmed these observations
Fig. 7 Western blot analysis of
phos-phorylated and total ERK expression in BeWo treated with resistin (0– 50 ng/ml) for 20 min. (A) A represen-tative Western blot analysis for phos-phorylated and total ERK in BeWo cells. (B) Densitometric analysis. The level of total and p- ERK protein after resistin treatment was estimated in comparison with the constant level of
-actin and expressed as a percentage
of the control (untreated cells = 100%). Results are means ± S.E. of five independent experiments. Significance versus untreated cells (control: resistin 0 ng/ml): *P < 0.05; Res: resistin.
Fig. 8 Effect of ERK1/2 inhibitor on
resistin-induced GLUT-1 proliferation. A representative experiment of Western blot analyses and densitometric analy-sis of GLUT-1 expression in plasma membranes of BeWo cells treated with resistin (10 ng/ml) and/or ERK 1/2 kinase inhibitor (PD98059; 25 M) for 24 hrs. The levels of GLUT-1 in BeWo cells were estimated in comparison with the constant level of -tubulin and expressed as a percentage of the con-trol (CTR: 0 ng/ml resistin = 100%). Results are means ± S.E. of six inde-pendent experiments. Significance ver-sus untreated cells: *P < 0.05; O.D.: optical density.
References
1. Steppan CM, Bailey ST, Bhat S, Brown EJ, Banerjee RR, Wright CM, Patel HR, Ahima RS, Lazar MA. The hormone
resistin links obesity to diabetes. Nature. 2001; 409: 307–12.
2. Yura S, Sagawa N, Itoh H, Kakui K, Nuamah MA, Korita D, Takemura M, Fujii S. Resistin is expressed in the human
pla-centa. J Clin End Metab. 2003; 88: 1394–7. 3. Chen D, Dong M, Fang Q, He J, Wang Z, Yang X. Alterations of serum resistin in
normal pregnancy and pre-eclampsia. Clin Sci. 2005; 108: 81–4.
4. Gabbe SG. Gestational diabetes mellitus.
N Engl J Med. 1986; 315: 1025–6.
5. Ericsson A, Hamark B, Powell TL, Jansson T. Glucose transporter isoform 4
is expressed in the syncytiotrophoblast of first trimester human placenta. Human Reprod. 2005; 20: 521–30.
6. Jansson T, Wennergren M, Illsley NP.
Glucose transporter expression and distri-bution in the human placenta throughout gestation and intrauterine growth retarda-tion. J Clin End Metab. 1993; 77: 1554–62. 7. Barros LF, Yudilevich DL, Jarvis SM, Beaumont N, Baldwin SA. Quantitation
and immunolocalization of glucose transporters in the human placenta. Placenta. 1995; 16: 623–33.
8. Mayor P, Maianu L, Garvey WT. Glucose
and insulin chronically regulate insulin action via different mechanisms in BC3H1 myocytes. Diabetes. 1992; 41: 274–85.
9. Zheng Q, Levitsky LL, Mink K, Rhoads DB. Glucose regulation of glucose
trans-porters in cultured adult and fetal hepato-cytes. Metabolism. 1995; 44: 1553–8. 10. Graveleau C, Zaha VG, Mohajer A,
Banerjee RR, Dudley-Rucker N, Steppan CM, Rajala MW, Scherer PE, Ahima RS, Mitchell AL, Abel ED. Mouse and human
resistins impair glucose transport in primary mouse cardiomyocytes, and oligomerization
GLUT-1 mRNA expression were also regulated by resistin and the
observed discordance between mRNA and protein might suggest
that trophoblast cells must have a mechanism for
post-transcrip-ional regulation of GLUT-1 expression.
The present study provides the first evidence that resistin can
modulate trophoblast glucose utilization. The effects of resistin on
glucose transport are significant and related to the cytokine
concen-trations. Resistin at concentrations that are reached in vivo
(10 ng/ml) [34] enhanced glucose uptake, while higher
concentra-tions (50–100 ng/ml) significantly impair trophoblast glucose uptake.
The increase or decrease in glucose uptake, together with the changes
in plasma membranes GLUT-1 protein expression, suggests that
resistin action on glucose transport occurs through this transporter.
In the present study, we used cytotrophoblast cells obtained
from human placentas. The presence of macrophages (3%) in this
culture might result in enhanced secretion of resistin-induced
pro-inflammatory cytokines, TNF-
␣ and IL-12, involved in obesity and
diabetes [35]. These cytokines might influence the resistin response
of trophoblast cells, however, the semi-purified culture might reflect
the in vivo condition better than highly purified cells.
In vitro experiments have suggested that exposure of 3T3L1
adipocytes to resistin impairs insulin-stimulated glucose uptake,
whereas exposure to anti-resistin IgG augments glucose uptake
[36] by mechanisms involving the regulation of suppressor of
cytokine signalling-3 (SOCS-3) [37]. Recently Gravelau et al. [38]
demonstrated that resistin causes a significant reduction in
insulin-stimulated glucose uptake impairing glucose transporter
translocation in human cardiomyocytes. From these data, human
resistin seems able to impair insulin action in insulin responsive
cells in vitro, but no data are available on a possible direct effect
of resistin in the same cells.
Transgenic mice that overexpress the resistin gene (Retn) in
adipose tissue are insulin resistant, whereas Retn (–/–) mice
show lower fasting blood glucose, suggesting that high resistin
concentrations might be related to diabetes [39]. Then increased
hyper-resistinemia, glucose intolerance and type 2 diabetes [39].
The plasma concentrations of resistin in patients with insulin
resistance remain to be carefully defined, although preliminary
studies suggest that mean circulating resistin levels may be 40
ng/ml in diabetes versus 15 ng/ml in lean non-diabetic patients
[34, 40]. Also during pregnancy, hyper-resistinemia seems to be
associated with the pregnancy-induced insulin resistance [41]
but studies on trophoblast cells are currently lacking. We showed
that resistin at high concentrations (50 ng/ml) is able to impair
trophoblast glucose transport and this might represent one
mechanism of the resistin-induced insulin resistance.
Although the molecular events by which resistin may
regulate trophoblast glucose uptake are not clear, a potential
model has been suggested. In particular, ERK1 and ERK2 seem
to play a pivotal role in controlling GLUT-1 expression on
tro-phoblast membranes.
Inhibition of ERK 1/ 2 kinase after treatment of trophoblast
cells with PD98059 supports involvement of MAP-kinase pathway
in resistin-induced GLUT-1 expression.
In conclusion, we have demonstrated that resistin, a novel
adipokine, causes activation of both the ERK1 and 2 pathway in
tro-phoblast cells. ERK1 and 2 activation stimulates GLUT-1 synthesis
and results in an increase of placental glucose uptake. High resistin
levels (50–100 ng/ml) seem to impair GLUT-1 expression and
glu-cose uptake, reflecting a complex interaction of this adipocytokine
with placental functions. However, further studies are required to
delineate the role of this cytokine in human pregnancy.
Acknowledgements
This work was supported by an MIUR grant (COFIN PRIN 2002, prot. 2002067124) and a research grant from Catholic University of Sacred Hearth (D1, 2006), Rome, Italy.
J. Cell. Mol. Med. Vol 13, No 2, 2009
is required for this biological action. J Biol Chem. 2005; 280: 31679–85.
11. Fujishiro M, Gotoh Y, Katagiri H, Sakoda H, Ogihara T, Anai M, Onishi Y, Ono H, Funaki M, Inukai K, Fukushima Y, Kikuchi M, Oka Y, Asano T. MKK6/3 and p38
MAPK pathway activation is not necessary for insulin-induced glucose uptake but regulates glucose transporter expression. J Biol Chem. 2001; 276: 19800–6. 12. Barry JS, Davidsen ML, Limesand SW,
Galan HL, Friedman JE, Regnault RH, Hay WW Jr. Developmental changes in
ovine myocardial glucose transporters and insulin signaling following hyperthermia-induced intrauterine fetal growth restric-tion. Exp Biol Med. 2006; 231: 566–75. 13. Mu H, Ohashi R, Yan S, Chai H, Yang H,
Lin P, Yao Q, Chen C. Adipokine resistin
promotes in vitro angiogenesis of human endothelial cells. Cardiovasc Res. 2006; 70: 146–57.
14. Kushiyama A, Shojima N, Ogihara T, Inukai K, Sakoda H, Fujishiro M, Fukushima Y, Anai M, Ono H, Horike N, Viana AY, Uchijima Y, Nishiyama K, Shimosawa T, Fujita T, Katagiri H, Oka Y, Kurihara H, Asano T. Resistin – like
mole-cule beta activates MAPKs, suppresses insulin signaling in hapatocytes, and induces diabetes, hyperlipidemia, and fatty liver in transgenic mice on high fat diet. J Biol Chem. 2005; 208: 42016–25. 15. Kliman HJ, Nestler JE, Sermasi E, Sanger
JM, Strauss JF. Purification,
characteriza-tion and in vitro differentiacharacteriza-tion of cytotro-phoblasts from human term placentae. Endocrinology. 1986; 118: 1567–82. 16. Landau BR, Spring-Robinson CL, Muzic
RF, Rachdaoui N, Rubin D, Berridge MS, Schumann W, Chandramouli V, Kern TS, Ismail-Beigi F.
6-fluoro-6-deoxy-D-glucose as a tracer of glucose transport. Am J Physiol Endocrinol Metab. 2007; 293: E237–45.
17. Bredford MM. Rapid and sensitive method
for the quantitation of microgram quanti-ties of proteins utilizing the principal of protein-dye binding. Anal Biochem. 1976; 72: 248–54.
18. Di Simone N, Maggiano N, Caliandro D, Riccardi P, Evangelista A, Carducci B, Caruso A. Homocysteine induces
tro-phoblast cell death with apoptotic features. Biol Reprod. 2003; 69: 1129–34. 19. Shah SW, Zhao H, Low SY, McArdle HJ,
Hundal HS. Characterization of glucose
transport and glucose transporters in the
human choriocarcinoma cell line BeWo. Placenta. 1999; 20: 651–9.
20. Peirson SN, Butler JN, Foster RG.
Experimental validation of novel and con-ventional approaches to quantitative real-time PCR data analysis. Nucleic Acids Research. 2003; 31: 73.
21. Pfaffl MW. A new mathematical model for
relative quantification in real-time RT-PCR. Nucleic Acids Res. 2001; 29: 45. 22. Meijerink J, Mandigers C, van de Locht
L, Tonnissen E, Goodsaid F, Raemaekers J. A novel method to compensate for
dif-ferent amplification efficiencies between patient DNA samples in quantitative real-time PCR. J Mol Diagn. 2001; 3: 55–61. 23. Sagawa N, Yura S, Itoh H, Mise H, Kakui
K, Korita D, Takemura M, Nuamah MA, Ogawa Y, Masuzaki H, Nakao K, Fujii S.
Role of leptin in pregnancy: a review. Placenta. 2002; 23: S80–6.
24. Cortelazzi D, Corbetta S, Ronzoni S, Pelle F, Marconi A, Cozzi V, Cetin I, Cortelazzi R, Beck-Peccoz P, Spada A.
Maternal and foetal resistin and adiponectin concentrations in normal and complicated pregnancies.Clin Endocrinol. 2007; 66: 447–53.
25. Jones CT, Rolph TP. Metabolism durinf
fetal life: a functional assessment of meta-bolic development. Physiol Rev. 1985; 65: 357–430.
26. Carstensen M, Leichtweiss HP, Molsen G, Schroder H. Evidence of a specific
transport of D-hexoses across the human term placenta in vitro. Arch Gynaekol. 1977; 222: 187–96.
27. Schneider H, Challier JC, Dancis J.
Transfer and metabolism of glucose and lactate in the human placenta studied by a perfusion system in vitro. Placenta. 1981; 2: 129–38.
28. Johnson LW, Smith CH. Monosacharide
transport across microvillous membrane of human placenta. Am J Physiol. 1980; 238: C160–8.
29. Johnson LW, Smith CH. Glucose transport
across basal plasma membrane of human placental syncytiotrophoblast. Biochem Biophys Acta. 1985; 815: 44–50. 30. Bell GI, Kayano T, Buse JB, Burant CF,
Takeda J, Lin D, Fukumoto H, Seino S.
Molecular biology of mammalian glucose transporters. Diabetes Care. 1990; 13: 198–208.
31. Devaskar SU, Mueckler MM. The
mam-malian glucose transportes. Pediatr Res. 1992; 31: 1–13.
32. Jansson T, Cowley EA, Illsley NP. Cellular
localization of glucose transporter mes-senger RNA in human placenta. Reprod Fertil Dev. 1995; 7: 1425–30.
33. Palik E, Baranyi E, Melczer Z, Audikovszky M, Szocs A, Winkler G, Cseh K. Elevated serum acylated (biologically
active) ghrelin and resistin levels associate with pregnancy-induced weight gain and insulin resistance. Diabetes Res Clin Pract. 2007; 76: 351–7.
34. Takada K, Kasahara T, Kasahara M, Ezaki O, Hirano H. Localization of
erythro-cyte/hep G2-type glucose transpoter (GLUT 1) in human placental villi. Cell Tissue Res. 1992; 267: 407–12. 35. Silswal N, Singh AK, Mukhopadhyay S,
Ghosh S, Ehtesham NZ. Human resistin
stim-ulates the pro-inflammatory cytokines TNF-alpha and IL-12 in macrophages by NF-kappa B-dependent pathway. Biochem Biophys Res Commun. 2005; 334: 1092–101.
36. Steppan CM, Bailey ST, Bhat S, Brown EJ, Banerjee RR, Wright CM, Patel HR, Ahima RS, Lazar MA. The hormone
resistin links obesity to diabetes. Nature. 2001; 409: 307–12.
37. Steppan CM, Wang J, Whiteman EL, Birnbaum MJ, Lazar MA. Activation of
SOCS-3 by resistin. Mol Cell Biol. 2005; 25: 1569–75.
38. Gravelau C, Zaha VG, Mohajer A, Banerjee RR, Dudley-Rucher N, Steppan CM, Rajala MW, Scherer PE, Ahima RS, Lazar MA, Abel ED. Mouse and human
resistin impair glucose transport in pri-mary mouse cardiomiocytes and oligom-rization is required for this biological action. J Biol Chem. 2005; 1: 31679–85. 39. Osawa H, Yamada K, Onuma H,
Murakami A, Ochi M, Kawata H, Nishimiya T, Niiya T, Shimizu I, Nishida W, Hashiramoto M, Kanatsuka A, Fujii Y, Ohashi J, Makino H. The G/G genotype of
a resistin single-nucleotide polymorphism at –420 increases type II diabetes mellitus susceptibility by inducing promoter activ-ity through specific binding of SP1/3. Am J Hum Genet . 2004; 75: 678–86. 40. Stejskal D, Proskova J, Adamovska S,
Juràkovà R, Bartek J. Preliminary experience
with resistin assessment in common popula-tion. Biomed Pap Med Fac Univ Palacky Olomaouc Czech Repub. 2002; 146: 47–9. 41. Fehmann HC, Heyn J. Plasma resistin
lev-els in patients with type 1 and type 2 dia-betes mellitus and in healthy controls. Horm Metab Res. 2002; 34: 671–3.