INDEX
INDEX
Abstract……….……….. 1
Introduction……….………... 2
Materials and methods………... 6
Cell lines ……….………..…………...6
Cell culture ……….... 6
Cell treatments ………... 6
Detection of IRS-1 and ERα by confocal microscopy ……….………. 6
Immunoprecipitation (IP) and Western Blotting (WB)………..… 7
Luciferase reporter assays ………..… 7
Chromatin immunoprecipitation ……….……... 8
Reverse ChIP (Re-ChIP)…. ………..… 9
RT–PCR ………...……… 10
Patients and tissue specimens ………...………10
Immunohistochemistry………..…..…..11
Statistical analysis ………..…….. 12
Results………..………...……….. 14
E2 stimulates nuclear translocation of IRS-1 in MCF-7 cells, and nuclear IRS-1 interacts with ERα...14
IRS-1 is recruited to the ERE-containing pS2 promoter in MCF-7 cells………17
Absence of ERα blocks nuclear IRS-1 translocation……….19
IRS-1 does not associate with the pS2 promoter in ERα-negative MDA-MB-231 cells………....20
INDEX
IRS-1 modulates ERα transcriptional activity………21 Nuclear IRS-1and ERα expression in normal mammary
epithelium and benign breast tumors………..23 IRS-1 expression in ERα-positive and ERα-negative breast
carcinoma………....26 Correlation between nuclear IRS-1and ERα in breast cancer,
benign tumors, and normal mammary epithelium………..26 Nuclear IRS-1 and ERα are correlated with some clinicopathological features in invasive ductal carcinomas………...28
Relationship between cytoplasmatic IRS-1 and clinicopathological
Features………...31
Discussion………..………33
References……….39
SCIENTIFIC RESEARCH PERFORMED DURING
THE PhD PROGRAM………43
1) Sisci D, Morelli C, Garofalo C, Romeo F, Morabito L, Casaburi F, Middea E, Cascio S, Brunelli E, Ando' S, Surmacz E. Expression of nuclear insulin receptor substrate 1 (IRS-1) in breast cancer. J Clin Pathol. 2006 Aug 1; [Epub ahead of print]
2) Bonofiglio D, Aquila S, Catalano S, Gabriele S, Belmonte M, Middea E, Hongyan Q, Morelli C, Gentile M, Maggiolini M, Andò S. Peroxisome Proliferator-Activated Receptor (PPAR) gamma activates p53 gene promoter binding to the NFkB sequence in human MCF7 breast cancer cells. Molecular Endocrinology. September 28, 2006 [Epub ahead of print]
3) Panno ML, Giordano F., Mastroianni F., Morelli C., Brunelli E., Palma MF, Pellegrino M., Aquila S., Miglietta A., Mauro L., Andò S. Evidence that low doses of Taxol enhance the functional transactivatory properties of p53 on p21 waf promoter in MCF-7 breast cancer cells. FEBS Letters 2006 Mar; 580:2371-2380.
INDEX
4) Panno M.L., Mauro L., Marsico S., Bellizzi D., Rizza P., Morelli C., Salerno M., Giordano F., Andò S. Evidence that the mouse insulin receptor substrate-1 belongs to the gene family on which the promoter is activated by estrogen receptor alpha through its interaction with Sp-1. J Mol Endocrinol. 2006 Feb;36(1):91-105.
5) Aquila S., Gentile M., Middea E., Catalano S., Morelli C., Pezzi V., Andò S. Leptin secretion by human ejaculated spermatozoa. J. Clin..Endocrinol Metab. 2005 Aug 90(8):4753-61.
6) del Rincon S.V., Guo Q., Morelli C., Shiu H.Y., Surmacz E., Miller W.H. Retinoic acid mediates degradation of IRS-1 by the ubiquitin-proteasome pathway, via a PKC-dependant mechanism. Oncogene. 2004 Dec 9;23(57):9269-79.
7) Morelli C., Garofalo C., Sisci D., del Rincon S., Cascio S., Tu X., Vecchione A., Sauter E.R., Miller W.H Jr, Surmacz E. Nuclear insulin receptor substrate 1 interacts with estrogen receptor alpha at ERE promoters. Oncogene. 2004 Sep 30;23(45):7517-26.
8) Sauter, E. R., Garofalo, C., Hewett, J., Morelli, C., Surmacz, E. Leptin expression in breast nipple aspirate fluid (NAF) is influenced by body mass index (BMI) in premenopausal women. . Horm Metab Res. 2004 May; 36(5):336-40.
Atti di convegno
Pasqua, L., Morelli, C., Testa, F., Sisci, D., Aiello,R. and Andò,S. Synthesis of mesoporous silica microsphere for drug targeting. Atti del Convegno “VIII Congresso Nazionale AIMAT, Palermo 27 Giugno-1 Luglio 2006”.
Abstract
Abstract
Insulin receptor substrate 1 (IRS-1), one of the major molecules transmitting signals from the insulin and insulin-like growth factor 1 receptors, has been implicated in breast cancer. Recently, data obtained in different cell models, suggested that in addition to its conventional role as a cytoplasmic signal transducer, IRS-1 can function in the nuclear compartment. However, the role of nuclear IRS-1 in breast cancer has never been addressed. Experiments undertaken in our laboratory showed that in estrogen receptor α (ERα)-positive MCF-7 cells 1) a fraction of IRS-1 is translocated to the nucleus upon 17-β-estradiol (E2) treatment; 2) E2-dependent nuclear translocation of IRS-1 is blocked with the antiestrogen ICI 182,780; 3) nuclear 1 colocalizes and coprecipitates with ERα; 4) the nuclear IRS-1:ERα complex is recruited to the E2-sensitive pS2 gene promoter. Furthermore, transfection reporter assays with E2-sensitive promoters suggested that the presence of IRS-1 modulates ERα activity at estrogen response element (ERE)-containing DNA.
Furthermore, since the expression of nuclear IRS-1 in breast cancer biopsies has never been examined, we wanted to assess whether nuclear IRS-1 is present in breast cancer and non-cancer mammary epithelium and if it correlates with other markers, especially ERα. Parallel studies were done for cytoplasmic IRS-1. IRS-1 and ERα expression was assessed by immunohistochemistry. Data were evaluated using Pearson correlation, linear regression, and ROC analysis. Nuclear IRS-1 was expressed at low levels in normal mammary epithelial cells and at higher levels in benign tumors, ductal carcinoma, and lobular carcinoma. Similarly, ERα expression was low in normal cells and benign tumors, but high in ductal and lobular cancer. Nuclear IRS-1 and ERα positively correlated in ductal breast cancer and benign tumors, but were not associated in lobular cancer and normal mammary epithelium. In ductal carcinoma, both nuclear IRS-1 and ERα negatively correlated with tumor grade, size, mitotic index, and lymph node involvement. Cytoplasmic IRS-1 was expressed in all specimens and positively correlated with ERα in ductal cancer. A positive association between nuclear IRS-1 and ERα is a characteristic for ductal breast cancer and marks a more differentiated, non-metastatic phenotype. In summary, our data suggest the existence of interactions between IRS-1 and ERα occurring in the nucleus. These interactions might represent a novel aspect of ER/IGF-I crosstalk in breast cancer.
Introduction
Introduction
Recent experimental and clinical evidence suggests the involvement of the
insulin-like growth factor I (IGF-I) receptor (IGF-IR) in breast cancer development and progression
(Bartucci et al., 2001; Pollak, 1998; Sachdev and Yee, 2001; Surmacz, 2000; Surmacz, 2003;
Surmacz and Bartucci, 2004). The tumorigenic action of IGF-IR is executed through multiple
antiapoptotic, growth promoting, and/or pro-metastatic pathways (Baserga, 2000; Baserga et
al., 2003; Mauro et al., 2003; Surmacz, 2003; Surmacz and Bartucci, 2004). Many of these
pathways stem from IRS-1, a major IGF-I signaling molecule that becomes phosphorylated
on multiple tyrosine residues upon IGF-IR activation. Tyrosine phosphorylated IRS-1 acts as
a scaffolding protein sequestering downstream signaling molecules and propagating IGF-I
signal through the PI-3K/Akt, Ras/Raf/ERK1/2, Jak2/Stat3 and other pathways (Myers et al.,
1994; Myers and White, 1996; White, 1997; White, 1998).
Overexpression or downregulation of IRS-1 in breast cancer cell models suggested
that the molecule controls several aspects of the neoplastic phenotype, especially
anchorage-dependent and -inanchorage-dependent cell growth and survival (Nolan et al., 1997; Surmacz and
Burgaud, 1995). In breast cancer cell lines, IRS-1 appears to be expressed at higher levels in
ERα-positive than in ERα-negative cells and there is evidence supporting the existence of crosstalk between IRS-1 and ERα systems (Bartucci et al., 2001; Lee et al., 2000; Lee et al., 1999; Rocha et al., 1997; Surmacz, 2000; Surmacz and Bartucci, 2004).
Overexpression of IRS-1 in MCF-7 ERα-positive cells has been shown to induce estrogen-independence and mediate antiestrogen-resistance (Guvakova and Surmacz, 1997;
Salerno et al., 1999; Surmacz, 2000; Surmacz and Burgaud, 1995). These effects have been
attributed to increased tyrosine phosphorylation of IRS-1 and potentiation of its downstream
signaling to Akt (Sachdev and Yee, 2001; Surmacz, 2000).
High expression of IRS-1 can be in part attributed to ERα activity, as 17-beta-estradiol (E2) can upregulate IRS-1 expression and function (Lee et al., 1999; Mauro et al.,
Introduction
2001; Molloy et al., 2000), while antiestrogens reduce IRS-1 mRNA and protein levels and
inhibit IRS-1 signaling (Chan et al., 2001; Guvakova and Surmacz, 1997; Salerno et al.,
1999). It has recently been well established that ERα can activate IRS-1 transcription acting on IRS-1 promoter (Lee et al., 1999; Mauro et al., 2001; Molloy et al., 2000; Panno et al.,
2006). Furthermore , our recent data suggested that unliganded ERα can directly interact with IRS-1, increasing its stability and potentiating its downstream signaling to Akt (Morelli et al.,
2003). Notably, increased activity of IRS-1 is likely to modulate ERα, via ERK1/2- and Akt-mediated phosphorylation of ERα on Ser-118 and Ser-167, respectively (Campbell et al., 2001; Kato et al., 1995; Stoica et al., 2000).
Recent reports suggested that in addition to its cytoplasmic signaling function, IRS-1
is able to regulate nuclear processes in different cell models (Chen et al., 2005; Drakas et al.,
2004; Lassak et al., 2002; Prisco et al., 2002; Trojanek et al., 2005). Several rigorously
controlled studies demonstrated that nuclear IRS-1 can be found in cells transformed by
oncogenic proteins, e.g., T antigens of the JCV (Lassak et al., 2002; Trojanek et al., 2003) and
SV40 (Prisco et al., 2002) viruses, and v-src (Tu et al., 2002).
The biological relevance of nuclear IRS-1 in various cell backgrounds has yet to be
determined. Recent studies demonstrated that in mouse embryo fibroblasts stimulated with
IGF-I, IRS-1 accumulated in the nucleoli and interacted with the upstream binding factor 1
(UBF1), a regulator of RNA polymerase I (Tu et al., 2002); the presence of nucleolar IRS-1
coincided with increased rRNA synthesis and cell growth in size (i.e., rDNA) (Drakas et al.,
2004; Tu et al., 2002). In the same cell model, IGF-I induced nuclear IRS-1 modulates the
expression of genes controlling cell proliferation (i.e., Cyclin D1) by physically interacting
with transcriptional complexes of beta-catenin (Drakas et al., 2004). Nuclear translocation of
IRS-1 has also been described in 32D murine cells (Sciacca et al., 2003), osteoblasts (Seol
Introduction
The mechanism by which IRS-1 is targeted to the nucleus is unknown. The
observations from different cell models suggested that although IRS-1 contains putative
nuclear localization signals (NLS), it is most likely chaperoned to the nucleus by other
proteins, such as viral antigens (Prisco et al., 2002; Tu et al., 2002). The nuclear localization
of IRS-1 requires specific IRS-1 domains, but these requirements appear to be different
depending on the experimental system. For instance, in JCV T antigen expressing cells,
nuclear localization of IRS-1 depends on its pleckstrin homology domain (Lassak et al.,
2002), while in IGF-I stimulated cells, the phosphotyrosine binding domain is required
(Prisco et al., 2002).
The possible role of nuclear IRS-1 in breast cancer has never been addressed. Here we
studied whether E2 can induce nuclear translocation of IRS-1 and if nuclear IRS-1 can
associate with and modulate the action of ERα.
Moreover, despite the evidence that IRS-1 signaling may play a critical role in
tumorigenesis, only limited studies examined the clinical significance of IRS-1 expression in
human breast cancer specimens (Finlayson et al., 2003; Koda et al., 2005; Rocha et al., 1997;
Schnarr et al., 2000). In one study, cytoplasmatic IRS-1 has been reported as a bad prognostic
marker, as its abundance correlated with a less differentiated tumor phenotype (G3) and
lymph node involvement (Koda et al., 2005). Another study correlated IRS-1 with shorter
disease-free survival in patients with smaller tumors (Rocha et al., 1997). In contrast, Schnarr
et al. found that IRS-1 marks a more differentiated phenotype and better prognosis (Schnarr et
al., 2000). Furthermore, one study examining cancer and normal specimens reported similar
IRS-1 tyrosine phosphorylation in all tissues (Finlayson et al., 2003), while other analysis
found decreased IRS-1 levels in poorly differentiated cancers relative to normal tissue and
benign tumors (Schnarr et al., 2000).
Regarding nuclear IRS-1, its presence in breast cancer specimens has been noted by
Introduction
significance of this marker has never been formally addressed. Consequently, we examined
the expression of nuclear IRS-1 in normal mammary tissue, benign breast tumors and breast
cancer in relation to ERα and other markers and clinicopathological features. Parallel studies were done for cytoplasmatic IRS-1.
Materials and Methods
Materials and Methods
Cell lines. MCF-7, MDA-MB-231, BT-20, COS-7, and HeLa cells were obtained from ATCC. MDA-MB-231 cells stably expressing ERα have been developed in our laboratory (Morelli et al., 2003).
Cell culture. MCF-7 and MDA-MB-231cells were grown in DMEM:F12 containing 5% calf serum (CS). MDA-MB-231/ER cells were grown in DMEM:F12 plus 5% CS plus 0.05 mg/ml
G418. BT-20 cells were grown in DMEM:F12 with 10% fetal bovine serum (FBS). COS-7
and HeLa cells were grown in DMEM supplemented with 10% FBS. In the experiments
requiring E2- and serum-free conditions, the cells were cultured in phenol red-free serum-free
medium (SFM) (Guvakova and Surmacz, 1997).
Cell treatments. E2 (Sigma) and the antiestrogen ICI 182,780 (Tocris Cookson) were used at the concentration of 10 nM.
Detection of IRS-1 and ERα by confocal microscopy. Confluent cultures (50%) grown on coverslips were fixed in 3% paraformaldehyde, permeabilized with 0.2% Triton X-100,
washed three times with PBS, and incubated for 1 h with a mixture of primary antibodies
(Abs) recognizing IRS-1 and ERα. The anti-IRS-1 CT (UBI) or anti-IRS-1 pre-CT (UBI) at 2 µg/ml was used for IRS-1 staining; F-10 monoclonal Ab (mAb) (Santa Cruz) at 2 µg /ml was used to detect ERα. Following the incubation with primary Abs, the slides were washed three times with PBS, and incubated with a mixture of secondary antibodies. A fluorescein-conjugated donkey anti-mouse IgG (Calbiochem) was used as a secondary Ab for ERα and a rhodamine-conjugated donkey anti-rabbit IgG (Calbiochem) was used for IRS-1. The cellular
localization of IRS-1 and ERα was studied with Bio-Rad MRC 1024 confocal microscope connected to a Zeiss Axiovert 135M inverted microscope with 600 x magnification. The
Materials and Methods
ensure no excitation/emission wavelength overlap. In control samples, the staining was
performed with the omission of the primary Abs.
Immunoprecipitation (IP) and Western Blotting (WB). The cytoplasmic and nuclear proteins were obtained from 70% cultures. The cytoplasmic lysis buffer contained: 50 mM
HEPES pH 7.5, 150 mM NaCl, 1% Triton X-100, 1.5 mM MgCl2, EGTA 10 mM pH 7.5,
glycerol 10%, inhibitors (0.1 mM Na3VO4, 1% PMSF, 20 µg/ml aprotinin). Following the collection of cytoplasmic proteins, the nuclei were lysed with the buffer containing 20 mM
HEPES pH 8, 0.1 mM EDTA, 5 mM MgCl2, 0.5 M NaCl, 20% glycerol, 1% NP-40,
inhibitors (as above). 25-50 µg of protein lysates were used for WB, while 500 µg for IP. The following Abs were employed: anti-IRS-1 CT pAb (UBI) for WB and IP; anti-ERα F-10 mAb (Santa Cruz) for WB and IP; anti-GAP-DH mAb (Research Diagnostics Inc.) for WB,
anti-c-Jun mAb (Santa Cruz) for WB, anti-GRB2 mAb (Transduction Laboratories) for WB.
In all IPs, protein lysates were first incubated with primary Abs at 4oC for 4 h in HNTG
buffer (20 mM HEPES pH 7.5, 150 mM NaCl, 0.1% Triton X-100, 10% glycerol, 0.1 mM
Na3VO4), and then immune complexes were precipitated for 1 h with appropriate beads,
specifically, with Protein A agarose (Calbiochem) for IPs with polyclonal Abs and anti-mouse
IgG agarose (Sigma) for IPs with mouse monoclonal Abs. In control samples, the primary
Abs were substituted with nonimmune IgGs (rabbit or mouse, depending on the source of the
primary Abs). The immunoprecipitated proteins were washed three times with HNTG buffer,
separated on a 4-15% polyacrylamide denaturing gel, analyzed by WB, and visualized by
ECL chemiluminescence (Amersham). The intensity of bands representing relevant proteins
was measured by Scion Image laser densitometry scanning program.
Luciferase reporter assays. The experiments were performed using COS-7, BT-20 and MCF-7 cell lines. The cells were grown in 24-well plates. At 70% confluence, the cultures
were transfected for 6 h with 0.5 µg DNA/well using Fugene 6 (Roche) (DNA:Fugene 3:1). All transfection mixtures contained 0.3 µg of the reporter plasmid, ERE-Luc, encoding the
Materials and Methods
firefly luciferase (Luc) cDNA under the control of the TK promoter and three estrogen
responsive element (ERE) sequences. ERE-Luc was cotransfected with the ERα expression vector pSG5-HEGO alone or in combination with the IRS-1 expression vector pCMV-IRS-1.
To maintain the same DNA input in all transfection mixtures, the samples were adjusted with
an empty vector (pcDNA3 or pSG5). In addition, to assess transfection efficiency, each of the
DNA mixtures contained 50 ng of pRL-TK-Luc, a plasmid encoding renilla luciferase (RI
Luc) (Promega). Upon transfection, the cells were shifted to SFM for 12 h and then treated
with 10 nM E2 for 24 h, or left untreated in SFM. Luciferase activity (Luc and RI Luc) in cell
lysates was measured using Dual Luciferase Assay System (Promega) following
manufacturer's instructions. The values obtained for Luc were normalized to that of RI Luc to
generate relative Luc units representing ERE-dependent transcription.
Chromatin immunoprecipitation. We followed ChIP methodology described by Shang et al. (2000) with minor modifications. MCF-7, MDA-MB-231, and MDA-MB-231/ER cells
were grown in 100 mm plates. Confluent cultures (90%) were shifted to SFM for 24 h and
then treated with 10 nM E2 for 1–24 h, or left untreated in SFM. Following treatment, the
cells were washed twice with PBS and crosslinked with 1% formaldehyde at 37°C for 10 min.
Next, the cells were washed twice with PBS at 41C, collected and resuspended in 200 ml of
lysis buffer (1% SDS, 10 mM EDTA, 50 mM Tris-HCl pH 8.1) and left on ice for 10 min.
Then, the cells were sonicated four times for 10 s at 30% of maximal power (Fisher Sonic
Dismembrator) and collected by centrifugation at 4°C for 10 min at 14 000 rpm. The
supernatants were collected and diluted in 1.3 ml of IP buffer (0.01% SDS, 1.1% Triton
X-100, 1.2 mM EDTA, 16.7 mM Tris-HCl pH 8.1, 16.7 mM NaCl) followed by
immunoclearing with 80 ml of sonicated salmon sperm DNA/ protein A agarose (UBI) for 1 h
at 41C. The precleared chromatin was immunoprecipitated for 12 h with specific Abs,
specifically anti-ERaC-terminus mAb F-10 (Santa Cruz) for ERa, and anti-IRS-1 C-terminus
Materials and Methods
for SRC1 (UBI). After this, 60 ml of salmon sperm DNA/ protein A agarose was added and
precipitation was continued for 2 h at 41C. After pelleting, precipitates were washed
sequentially for 5 min with the following buffers: Wash A (0.1% SDS, 1% Triton X-100, 2
mM EDTA, 20 mM Tris-HCl pH 8.1, 150 mM NaCl), Wash B (0.1% SDS, 1% Triton X-100,
2mM EDTA, 20 mM Tris-HCl pH 8.1, 500 mM NaCl), and Wash C (0.25 M LiCl, 1%
NP-40, 1% sodium deoxycholate, 1mM EDTA, 10 mM Tris-HCl pH 8.1), and then twice with TE
buffer (10 mM Tris, 1 mM EDTA). The immune complexes were eluted with elution buffer
(1% SDS, 0.1 M NaHCO3). The eluates were reverse crosslinked by heating at 651C for 12 h
and digested with proteinase K (0.5 mg/ml) at 451C for 1 h. DNA was obtained by phenol
and phenol/chloroform extractions. A 2 ml portion of 10 mg/ml of yeast tRNA was added to
each sample and DNA was precipitated with EtOH for 12 h at 41C and then resuspended in
20 ml of TEbuffer. A 5 ml volume of each sample was used for PCR with pS2 promoter
primers flanking ERE-containing pS2 promoter fragment: upstream
5’-GATTACAGCGTGAGCCACTG-3’, and downstream
5’-TGGTCAAGCTACATGGAAGG-3’. The primers for GAPDH promoter were 5’-GCTACTAGCGGTTTTACGGG-3’ (forward)
and 5’-AAGATGCGGCTGACTGTCGAA-3’ (reverse). The PCR conditions were 45 s at
94°C, 40 s at 58°C, and 90 s at 72°C. The amplification products obtained in 25 and 35 cycles
were analysed in a 2% agarose gel and visualized by ethidium bromide staining. The intensity
of bands representing relevant proteins was measured by Scion Image laser densitometry
scanning program. In control samples, non-immune IgG (rabbit for IRS-1 Abs and mouse for
all other Abs, Santa Cruz) was used instead of the primary Abs.
Reverse ChIP (Re-ChIP). We followed methodology described by Reid et al (2003). The pellets obtained by immunoprecipitation of soluble chromatin with IRS-1 and ERα Abs were eluted with 500 µl of Re-ChIP buffer (0.5mM DTT, 1% Triton X-100, 2mM EDTA, 150mM NaCl, 20mM TRIS-HCl pH 8.1). Next, the elute from ERα IP was precipitated with IRS-1 Ab (UBI) and the eluate from IRS-1 IP was precipitated with ERα Ab (Santa Cruz). The presence
Materials and Methods
of the pS2 promoter sequences in the resulting Re-ChIP pellets was examined as described
above for one-step ChIP.
RT–PCR. COS-7 cells were transfected with different plasmids for 24 h, as described in the transactivation assays methodology. Total RNA was isolated using TRIzol reagent
(Invitrogen) according to the manufacturer’s instructions. A 5 mg portion of total RNA was
reverse transcribed (RT) at 371C for 30 min in 20 ml of buffer containing 200 U of M-MLV
reverse transcriptase (Promega), 0.4 mg oligo-dT, 0.5 mM deoxynucleotide triphosphate
(dNTP), and 24 U RNAsin. The reaction was terminated by heat denaturation for 5 min at
95°C. A 2 ml portion of RT products was used to simultaneously amplify pS2 and 36B4
(control) DNA sequences. The pS2 cDNA fragment (210 bp) was amplified using the
following primers: TTCTATCCTAATACCATCGACG-30 (forward) and
50-TTTGAGTAGTCAAAGTCAGAGC-30 (reverse). The 408 bp fragment of the 36B4
ribosomal phosphoprotein DNA was amplified with the following primers:
50-CTCAA-CATCTCCCCCTTCTC-30 (forward) and 50-CAAATCCCA-TATCCTCGTCC-30 (reverse)
(Maggiolini et al., 2001). The PCR amplification was performed using 1.25 U GoTaq DNA
polymerase (Promega), 1 PCR buffer (10 mM Tris-HCl, 50 mM KCl), 2.5 mM MgCl2, 0.2
mM of each dNTP, and 1.5 pM of primers for pS2 or 0.5 pM primers for 36B4. PCR
conditions were 30 s at 94°C, 40 s at 59°C, and 60 s at 72°C for 30 cycles. PCR products (10
ml) were separated on a 1.2% agarose gel.
Patients and tissue specimens. Tab. 1 summarizes information of patient and specimen characteristics. The histopathological examination of sections was based on the WHO and
pTN classification of breast tumors. Tumor size (pT) was scored as follows: 0, primary tumor
not detectable; 1, tumor largest diameter <2cm; 2, diameter <5cm; 3, diameter >5cm; 4,
inflammatory carcinoma of any size. Lymph node status (pN) was scored from 0, no node
involvement; 1, proximal node involved; 2, distal node involved. The protocol of the present
Materials and Methods
Table 1. Patient characteristics and clinical parameters of breast tissues and cancers
Sample characteristics Cancers Controls Total specimens 60 34 Ductal carcinoma 38 Lobular carcinoma 22 19 Benign breast tumors
Macromasty 14
Patient Age
Normal Benign Ductal Lobular
Mean±SE 53.6±3.3 45.4±3.1 62.9±2.4 64.5±2.7
Median (Range) 56.5 (33-68) 43 (20-68) 61.5 (43-94) 66 (48-78)
Menopause (%) 64 39 87 82
Clinical parameters of breast cancer tissues
Ductal (38) Lobular (22) G2 (19) G3 (19) G2 (10) G3 (12) pT 1-4 0-4 2-4 0-4 pN 0-2 0-2 0-1 0-2 Ki67 7.7 ± 0.9 (4-14) 14.2±1.3 (6-21) 7.2±1.5 (4-12) 9.0±1.9 (3-15)
The age of patients in each group is given as mean value ± SE with median age (range) for each population. The percentage of postmenopausal patients is indicated in each group. The range is reported for tumor size (pT), and lymph node involvement (pN); median frequency of expression ±SE (range) is shown for Ki67.
Immunohistochemistry. Immediately after excision, tissue samples were fixed in 10% buffered formaldehyde solution and embedded in paraffin blocks at 56°C. ERα and IRS-1
Materials and Methods
sections. The sections were dewaxed in xylene and rehydrated in graded alcohols. After
antigen retrieval by boiling in 0.01M citrate buffer pH 6 and endogenous peroxidase removal
with 3% H2O2, nonspecific binding was blocked by incubating the slides for 30 min with
1.5% BSA in PBS. Next, the sections were incubated with the primary antibodies (Abs) for 1h
at room temperature. ERα was detected using ERα mouse monoclonal Ab (mAb) (Dako Cytomation, Denmark) at dilution 1:35. IRS-1 was detected using the C-terminus IRS-1 rabbit polyclonal Ab (pAb) (Upstate, USA) at a concentration 4µg/ml. Ab-antigen reactions were revealed using Streptavidin-biotin-peroxidase complex (LSAB kit, Dako Cytomation,
Denmark). All slides were counterstained with hematoxylin. Breast specimens previously
classified as positive for the expression of the studied markers were used for control and
protocol standardization. In negative controls, primary Abs were omitted. The expression of
ERα and IRS-1 was independently scored by two investigators (CM and CG) by light microscopy in 10 different section fields. For all nuclear markers, mean and median
percentage, and the range of epithelial cells displaying positive staining was scored. In some
analyses, specimens were grouped into ERα-negative (less than 5% of epithelial cells exhibiting ERα expression) and ERα-positive (5% or more of cells with ERα). The expression of cytoplasmic IRS-1 was classified using a four-point scale: 0, <10% positive
cells with any staining intensity; 1+, 10-50% positive cells with weak or moderate staining;
2+, >50% positive cells with weak or moderate staining; 3+, >50% positive cells with strong
staining. No samples with less than 50% of positive cells with strong staining were recorded.
Statistical analysis. Student’s t-test was used to analyze WB and transactivation data. Statistical significance was assumed at P<0.05. Descriptive statistic for nuclear IRS-1 and ERα in normal, benign and tumor samples was reported as mean, standard error (±SE), median value and range. The relationship between nuclear IRS-1 and ERα was analyzed by linear regression and the statistical significance was evaluated by the Pearson correlation test.
Materials and Methods
The distribution of ERα and nuclear IRS-1 in respect to tumor size, grade, and lymph node involvement are reported in scatterplots. The correlations between nuclear IRS-1, ERα, cytoplasmatic IRS-1 and selected clinicopathologic features were examined with the Pearson
correlation test.
The value of nuclear ERα or IRS-1 expression as diagnostic marker of tumor grade, pT, pN and Ki67 was evaluated calculating the areas under the receiver operating
characteristic (ROC) curves (Greiner et al., 2000; Vanagas, 2004; Wynne-Jones et al., 2000;
Zweig, 1993), which assess the performance of a diagnostic test . In the graphical
representation of the ROC curve, the X-axis is the false-positive rate (1-specificity) and the
Y-axis is the true positive rate (sensitivity). The diagonal line (from 0,0 to 1,1) reflects the
characteristics of a test with no discriminating power. ROC curve was analyzed using
Results
Results
E2 stimulates nuclear translocation of IRS-1 in MCF-7 cells, and nuclear IRS-1 interacts with ERα
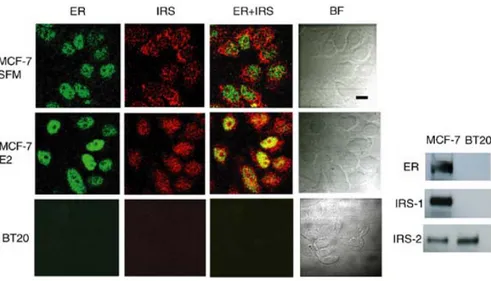
The subcellular localization of IRS-1 and ERα was studied in MCF-7 cells stimulated with E2 for different times, from 15 min to 72 h. The images obtained by immunostaining and
confocal microscopy are shown in Figure 1. Under serum-free medium (SFM) conditions,
IRS-1 was present mainly in the cytoplasm, especially in the perinuclear area, while ERα localized in the nucleus and was weakly detectable in the cytoplasm (Figure 1). In 95% of
untreated cells (SFM), colocalization of IRS-1 and ERα was not observed. At 15 min of E2 treatment, the staining of both proteins resembled that at time 0. At 1 and 4 h, 80% of cells
displayed weak nuclear IRS-1 staining and strong nuclear expression of ERα. At these time points, nuclear colocalization of ERα and IRS-1 was detectable in ∼25% of cells (data not shown). At 8, 24, and 48 h of E2 treatment, ERα was expressed almost exclusively in the nucleus, while IRS-1 was abundant in both cellular compartments (Figure 1). Furthermore, at
these time points, evident nuclear colocalization of ERα and IRS-1 was observed in 60–70% of the cells (Figure 1). At 72 h, nuclear presence of IRS-1 became greatly reduced compared with that of earlier time points, while ERα remained nuclear. At this time, colocalization of ERα and IRS-1 was nearly undetectable (data not shown).
The above experiments were repeated several times with reproducible results. The specificity
of IRS-1 staining was confirmed with other anti-IRS-1 polyclonal antibodies (pAbs),
specifically anti-IRS-1 CT and anti-IRS-1 pre-CT (both from UBI), and pAb C20 (Santa
Cruz). The staining was negative when the primary Abs were omitted or blocking peptide was
used, as shown by us before in other cell models (Tu et al., 2002). In addition, we evaluated the specificity of staining procedures using BT-20 breast cancer cells, which are ERα and IRS-1 negative but express IRS-2 (Figure 1, inset). BT-20 cells were treated for 24 and 48 h
Results
with E2 and subjected to the same staining protocol as described for MCF-7 cells. Both IRS-1
and ERα were undetectable in BT-20 cells (Figure 1).
Figure 1. Subcellular localization of IRS-1 and ERα by confocal microscopy. MCF-7 cells synchronized in
SFM for 24 h were treated with 10 nM E2 for 24 h (E2) or were left untreated (SFM). BT-20 cells were stimulated with E2 for 24 h. The localization of IRS-1 and ERα was studied by immunostaining and confocal microscopy as detailed in Materials and methods. The captured images of IRS-1 (IRS, red fluorescence), ERα (ER, green fluorescence), merged IRS-1 and ERα (IRS ER, yellow fluorescence), and bright field (BF) are shown. Scale bar equals 20 mm. Inset: The expression of ERα (ER), IRS-1, and IRS-2 was detected by WB in 50 mg of total protein lysates obtained from growing MCF-7 and BT-20 cells.
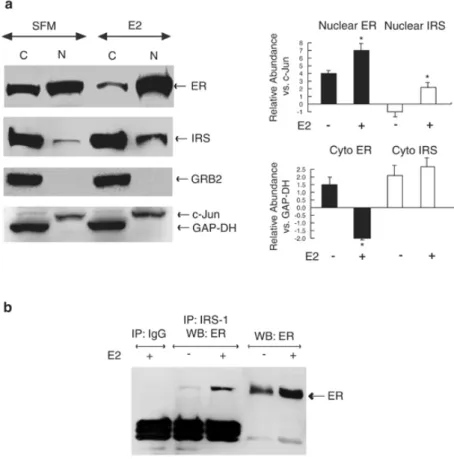
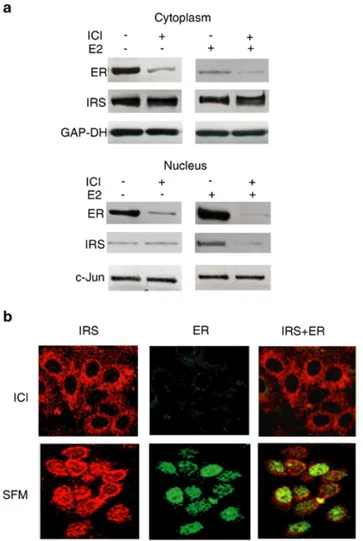
The localization of ERα and IRS-1 was further pursued in subcellular protein fractions. Cytoplasmic and nuclear proteins were obtained from MCF-7 cells treated with E2 for 24 h or
left untreated. Under SFM conditions, ERα was present in the cytoplasmic and nuclear compartments. As expected, upon E2 treatment the nuclear abundance of ERα significantly increased, while the abundance of the cytoplasmic ERα significantly decreased (Figure 2a). In parallel, E2 stimulation significantly (∼3.0-fold) upregulated nuclear amounts of IRS-1 (Figure 2). Despite nuclear translocation of IRS-1, its abundance in the cytoplasm remained
similar in treated and untreated cells (Figure 2a), which is consistent with the fact that E2 can
Results
cytoplasmic proteins GRB-2 and GAP-DH, and a nuclear protein c-Jun, was assessed as
control of lysate purity (Figure 2a).
Figure 2. Subcellular localization of ERα and IRS-1 in E2-treated MCF-7 cells. (a) MCF-7 cells
synchronized in SFM were treated with 10 nM E2 for 24 h (E2) or were left untreated (SFM). The expression of ERα (ER, ∼67 kDa), IRS-1 (IRS, ∼180 kDa), GRB-2 (∼25 kDa), c-Jun (∼39 kDa), and GAP-DH (∼36 kDa) was assessed by WB in 100 µg of cytoplasmic (C) and nuclear (N) proteins using specific Abs, as described in Materials and methods. The graphs represent relative abundance of nuclear and cytoplasmic (Cyto) ERα and IRS-1 in unstimulated and E2-stimulated cells. Nuclear and cytoplasmic levels of ERα and IRS-1 were normalized to c-Jun and GAP-DH, respectively (relative values 1). The asterisks indicate statistically significant (P<0.05) differences between the amounts in stimulated vs unstimulated cells. The results were obtained after repetitive stripping and reprobing of the same filter. (b) Nuclear lysates from MCF-7 cells (300 µg) were immunoprecipitated with anti-IRS-1 Ab (CT-anti-IRS-1, UBI) or nonimmune rabbit IgG, and the amounts of ERα in the IPs were probed by WB. A 50 µg portion of nuclear proteins was run in parallel.
Confocal microscopy results suggested nuclear colocalization of IRS-1 and ERα To confirm this observation, we studied IRS-1 and ERα interactions by immunoprecipitation (IP) and Western blotting (WB) using nuclear protein fractions obtained form MCF-7 cells grown in SFM or treated with E2 for 24 h (Figure 2b). ERα was found in IRS-1 immunoprecipitates in
Results
treated and untreated cells, with greater abundance of ERα/IRS-1 complexes in E2-stimulated cells (Figure 2b). Similarly, IRS-1 co-precipitated with nuclear ERα under E2 treatment (data not shown). Comparison of ERα content in total nuclear proteins vs IRS-1-associated proteins suggested that only a fraction (∼10%) of ERα co-precipitates with IRS-1.
IRS-1 is recruited to the ERE-containing pS2 promoter in MCF-7 cells
Nuclear colocalization and co-precipitation of ERα and IRS-1 suggested that both molecules could be recruited to the same regulatory sequences in DNA. The binding of ERα and IRS-1 to the estrogen-responsive element (ERE)-containing domain of the pS2 gene promoter was
assessed with chromatin immunoprecipitation (ChIP) and reverse ChIP (Re-ChIP) assays
(Figure 3).
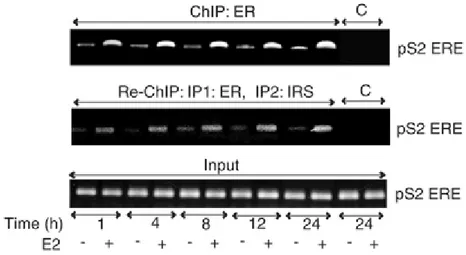
Figure 3. Time course of ERα and IRS-1 association with the pS2 promoter. Soluble chromatin was isolated
from MCF-7 cells stimulated with E2 for 1, 4, 8, 12, and 24 h, and from untreated cells at the same time points. ERα ChIP (ChIP: ER) experiments were performed as described in Materials and methods. IRS-1 Re-ChIPs were obtained from ERα ChIP samples after reprecipitation with IRS-1 Abs (Re-ChIP: IP1: ER, IP2: IRS). DNA recovered from the immune complexes was tested for the presence of the ERE-containing pS2 promoter sequences (pS2 ERE) by PCR with specific primers listed in Materials and methods. PCR products obtained after 35 cycles are shown. ChIP pellets obtained using nonimmune IgG were analysed as controls of Ab specificity (C). The abundance of the pS2 promoter sequences in all samples before IP is shown as control of input DNA (Input)
First, we tested the dynamics of ERα association with the pS2 promoter sequences. Soluble chromatin obtained from MCF-7 cells untreated or treated with E2 for 1, 4, 8, 12, and 24 h
was immunoprecipitated with anti- ERα Abs and the presence of pS2 promoter DNA in ERα precipitates was detected by PCR. As illustrated in Figure 3, E2 treatment increased ERα
Results
occupancy on the pS2 promoter at all time points. The association of ERα with pS2 DNA was maximal at 24 h after E2 addition (∼3.5-fold increase vs untreated) (Figure 3).
To test whether IRS-1 belongs to the ERα multicomplex recruited to the pS2 promoter, we performed Re-ChIP experiments, following the protocol described for ERα interacting proteins (Reid et al., 2003). In our Re-ChIP experiments, the original ERα ChIP pellets were eluted and precipitated with 1 Abs and the pS2 promoter sequences were detected in
IRS-1 Re-ChIPs by PCR. We found pS2 DNA in IRS-IRS-1 Re-ChIPs at all time points, which
indicated that IRS-1 and ERα belong to the same protein complex, and that the complex is associated with the ERE-pS2 promoter in E2-stimulated MCF-7 cells. Notably, the greatest
amounts of pS2 DNA in IRS-1 Re-ChIPs were present in cells stimulated with E2 for 24 h
(Figure 3).
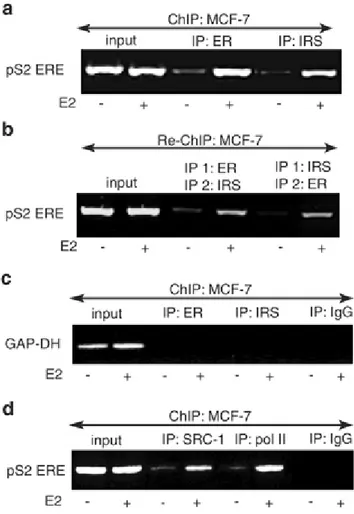
To extend the above observations, we examined the presence of other regulatory proteins in ERα transcriptional complexes in MCF-7 cells stimulated with E2 for 24 h. Figure 4 illustrates pS2 promoter occupancy by two proteins known to regulate ERα-dependent transcription, ERα coactivator SRC-1 and polymerase II (pol II). In parallel, the association of ERα and IRS-1 under the same conditions was assessed by ChIP and two-way Re-ChIP assays. The results confirmed that E2 stimulates the recruitment of the ERα:IRS-1 complex to the pS2 promoter in MCF-7 cells (Figure 4a and b). In the same experiment, neither ERα nor IRS-1 was recruited to the GAP-DH promoter that is not regulated by ERα (Metivier et al., 2002) (Figure 4c). Notably, the association of ERα and IRS-1 with pS2 DNA coincided with the recruitment of SRC-1 and pol II to the same promoter (Figure 4d).
Results
Figure 4. Association of the ERα:IRS-1 complex,
SRC-1, and pol II with the pS2 promoter. MCF-7 cells were stimulated with E2 for 24 h, and the presence of the pS2 promoter sequences (pS2 ERE) in (a) ERα and IRS-1 ChIPs, (b)ERα:IRS-1 direct and reverse Re-ChIPs, and (d) SRC-1 and pol II ChIPs was detected by PCR as described in Materials and methods. The occupancy of ERα and IRS-1 on the GAP-DH promoter (not regulated by E2) was tested with specific GAP-DH primers in ERα and IRS-1 ChIP preparations (c). ChIP with nonimmune IgG was used as a control (IP: IgG).
Absence of ERα blocks nuclear IRS-1 translocation
The role of ERα in the nuclear translocation of IRS-1 was probed in MCF-7 cells pretreated with the antiestrogen ICI 182,780 (ICI) for 6 h (Figure 5). This treatment has been chosen
based on preliminary tests establishing the dynamics of ICI-dependent downregulation of ERα and IRS-1. IRS-1 is a stable protein with a half-life of ∼10 h (Morelli et al., 2003) and only a long-term ICI treatment (48–74 h) can substantially decrease its levels (Salerno et al.,
1999), while short-term ICI exposure is sufficient to degrade ERα (Reid et al., 2003). Indeed, a 6 h ICI treatment dramatically reduced cytoplasmatic and nuclear ERα expression without affecting IRS-1 levels (Figure 5a and b).
Results
Figure 5. Effects of ERα downregulation on
nuclear translocation of IRS-1. MCF-7 cells synchronized in SFM were pretreated with 10 nM ICI 182,780 for 6 h, and then stimulated with 10 nM E2 for 24 h or left untreated in SFM (a). The levels of IRS-1 (IRS) and ERα (ER) were detected in 50 µg of cytoplasmatic and nuclear proteins with specific Abs, as described in Materials and methods. The results were obtained after repetitive stripping and reprobing of the same filter. (b) MCF-7 cells were pretreated with ICI and then stimulated with E2 or left in SFM as described in (a). The localization of IRS-1 (IRS) and ERα (ER) was studied by confocal microscopy, as described in Figure 1. Scale bar equals 50 µm
In ICI pretreated cells, E2 did not stimulate nuclear translocation of IRS-1, as demonstrated
by WB (Figure 5a) and confocal microscopy (Figure 5b). However, E2 induced nuclear
translocation of IRS-1 in untreated cells expressing normal ERα levels (Figures 1, 2 and 5a). Low amounts of nuclear IRS-1 were found under SFM conditions, possibly reflecting IRS-1 translocation induced by basal ERα activity (Figures 1, 2, 5a and b).
IRS-1 does not associate with the pS2 promoter in ERα-negative MDA-MB-231 cells
The requirement of ERα for E2-dependent nuclear translocation of IRS-1 was further investigated with MB-231 and MB-231/ER breast cancer cells (Figure 6).
MDA-MB-231 cells are ERα−negative but express IRS-1 on a level similar to that found in MCF-7 cells (Bartucci et al., 2001; Morelli et al., 2003). MDA-MB-231/ER cells have been
developed in our laboratory by stable transfection of MDA-MB-231 cells with an ERα expression vector (Morelli et al., 2003). The association of ERα and IRS-1 with the pS2
Results
promoter was studied in both cell lines by ChIP assays. In MDAMB-231 cells, neither ERα nor IRS-1 was found on the pS2 promoter. However, reintroduction of ERα allowed the association of both molecules with pS2 ERE sequences in response to E2 treatment (Figure
6).
Figure 6. Recruitment of ERα and IRS-1 to the pS2
gene promoter in 231 and MDA-MB-231/ER cells. MDA-MB-231 and MDA-MB-MDA-MB-231/ER cells were stimulated with E2 for 24 h or were left untreated in SFM. The presence of ERα and IRS-1 on the pS2 promoter (pS2 ERE) was detected by ChIP assays, as described in Materials and methods
IRS-1 modulates ERα transcriptional activity
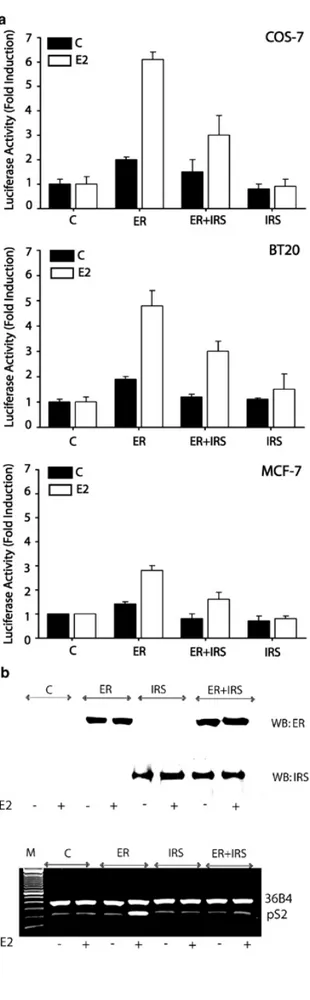
Because IRS-1 and ERα are recruited to E2-sensitive promoters, we tested whether the presence of IRS-1 may affect ERα transcriptional activity at ERE sites. This possibility was examined with transactivation assays employing an ERE reporter plasmid. The plasmid, ERE-Luc, was transiently transfected into cells either together with ERα expression vector only or with a mixture of ERα and IRS-1 expression plasmids. The transfected cells were left untreated or were treated with E2 for 24 h (Figure 7). To assess E2-dependent transcription in
a controlled environment, we used ERα- and IRS-1-negative COS-7 and BT-20 cells (Figures 1 and 7b), which allowed measurements of transcriptional activity in the presence or absence
of studied molecules. In addition, transactivation experiments were performed in MCF-7 cells
expressing endogenous IRS-1 and ERα. The transactivation assays indicated that the presence of IRS-1 significantly decreased ERα activation of ERE promoters in all cell lines stimulated with E2 (Figure 7a).
Results
Figure 7. Effects of IRS-1 on ERα transcriptional activity
at ERE promoters. (a) Transactivation assays. The transcriptional activity of ERα on ERE promoters in the presence or absence of IRS-1 was evaluated using luciferase reporter system, as described in Materials and methods. COS-7, BT-20, and MCF-7 cells were transfected with DNA mixtures containing ERE reporter plasmid alone (C), ERE + plasmid pHEGO encoding ERα (ER), ERE + ER + plasmid encoding IRS-1 (ER + IRS), or ERE + IRS1 (IRS). The activity of the ERE promoter in each experimental setting is represented by relative Luc units. The results are means ± s.e. from several experiments. In all experimental systems, the difference between E2-stimulated Luc activities in ER vs ER + IRS transfectants was statistically significant (P<0.05). (b) Effect of IRS-1 expression on pS2 mRNA levels. Upper panel: COS-7 cells were transfected with different plasmids and stimulated with E2 or left untreated, as described above. ERα and IRS-1 expression in transfected cells was detected by WB in 50 µg of total protein lysates. Lower panel: The abundance of pS2 and 36B4 mRNAs in COS-7 cells transfected with different plasmids was detected by RT–PCR, as described in Materials and methods
Results
Specifically, in COS-7, BT-20, and MCF-7 cells, cotransfection of IRS-1 reduced ERα activation of ERE by ∼50, ∼39, and ∼44%, respectively. The transfection of IRS-1 alone did not stimulate ERE transcription (Figure 7a). In addition to ERE reporter assays with reporter
plasmids, we assessed transcriptional activation of the pS2 gene in COS-7 cells transfected with either ERα, IRS-1, or a combination of ERα plus IRS-1. COS-7 cells were selected for this assay as they proved to be the most E2-responsive and the best transfectable cell model
(Figure 7a). The levels of pS2 mRNA in COS-7 cells transfected with different plasmids were
studied using RT–PCR (Figure 7b). The amounts of a constitutively expressed 36B4 mRNA
were assessed in the same samples. The results suggested that E2 stimulated pS2 mRNA
expression (∼3-fold) in ERα-transfected cells, compared with vector-only-transfected cells. This effect of E2 was significantly reduced in cells cotransfected with ERα and IRS-1, confirming the trend observed in ERE luciferase reporter assays. Notably, ERα expression was similar in the ‘ER’ and ‘ER+IRS’ populations, ruling out the possibility that differences
in pS2 transcription were related to unequal ERα expression (Figure 7b).
Nuclear IRS-1and ERα expression in normal mammary epithelium and benign breast
tumors
To assess nuclear IRS-1 relevance in vivo, we tested its expression in breast biopsies and
evaluated if it was correlated with major clinicopathological features.
In general, the expression of nuclear IRS-1 in normal tissues was very low (~2% of positive cells) (Tab. 2 and data not shown). ERα was expressed in 11 of 14 samples at the median frequency 30% (Fig. 8A, B and Tab. 2). In 9 of 11 ERα-positive specimens, 1.8% of epithelial cells contained nuclear IRS-1 (Tab. 2). Low frequency (3.5%) of nuclear IRS-1 was
also recorded in 2 specimens that did not express ERα. (Tab. 2 and data not shown).
Compared with normal epithelium, benign tumors expressed higher levels of nuclear
Results
19 ERα-positive specimens, but was not present in any of ERα-negative cases. (Fig. 8C, D and Tab. 2).
Cytoplasmic IRS-1 was expressed in all epithelial cells of normal epithelium and
benign tumors at the levels 1+ to 3+ (Fig. 8B, D and Tab. 5), while no evidence of
cytoplasmic ERα staining was revealed in any of the specimens (Fig. 8A).
Table 2. Descriptive statistics of nuclear IRS-1 and ERα in ERα-positive specimens.
Normal Epithelium Benign Tumors
ERα IRS-1 ERα IRS-1
Mean±SE 30.2±6.8 2.1±0.6 26±4.2 22.9±5.4
Median (Range) 30 (7-60) 1.8 (0-6) 23 (5-70) 21 (0-60)
G2+G3 G2 G3 Ductal
Carcinoma ERα IRS-1 ERα IRS-1 ERα IRS-1
Mean±SE 58±8.1 25.1±6.7 72.5±6.4 31.3±8.7 21.7±8.4 9.5±3.2
Median (Range) 65 (5-92) 12.5 (0-72) 81 (30-92) 21 (5-72) 21 (5-40) 12 (0-14)
G2+G3 G2 G3
Lobular
Carcinoma ERα IRS-1 ERα IRS-1 ERα IRS-1
Mean±SE 66.8±8.2 37.7±9.1 79.5±6.8 40±16.8 50±11.5 34.6±1.4
Median (Range) 70 (30-90) 35 (0-80) 84 (60-90) 40 (0-80) 50 (30-70) 35 (32-37)
The mean(±SE) expression with median (range) values for nuclear IRS-1 and ERα in ERα-positive samples is given. Cancer samples of ductal and lobular origin were grouped into G2+G3 or analyzed as separate G2 and G3 populations.
Results
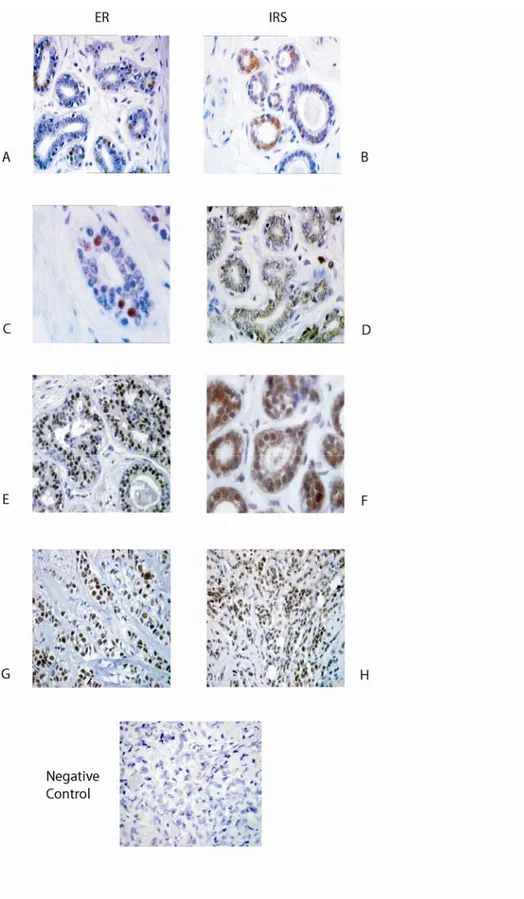
Figure 8. ERα and IRS-1 expression in normal mammary epithelium, benign breast tumors and breast cancers.
The expression of ERα (ER) and IRS-1 (IRS) were examined by IHC, as described in Materials and Methods. Normal breast tissue (A, B); benign breast tumor (C, D); invasive ductal positive carcinoma (E, F); ERα-positive lobular breast cancer (G, H). Negative control; IHC of lobular carcinomas with primary Abs substituted with PBS.
Results
IRS-1 expression in ERα-positive and ERα-negative breast carcinoma
In invasive ductal carcinoma, nuclear IRS-1 was found in 22 of 38 of specimens at the
median level 12.5%, while ERα was detected in 20 of 38 of the samples with a median value of 65% (Fig. 8E, F and Tab. 2). Twenty two specimens (15 of 19 in G2, and 7 of 19 in G3)
expressed nuclear IRS-1 (Fig. 8F, Tab. 2). Among nuclear IRS-1-positive samples, 18 also
expressed ERα, while 4 were ERα-negative. Thirteen of G2 ductal carcinomas and 5 of G3 were positive for both IRS-1 and ERα. In 2 of 38 specimens, ERα was expressed in the absence of nuclear IRS-1.
In lobular cancer, nuclear IRS-1 staining was observed in 16 of 22 samples with the
median frequency 35% (Fig. 8H, Tab. 2). Eleven of these 16 samples were also ERα-positive. In G2 lobular carcinomas, 6 of 10 (median 40%) displayed nuclear IRS-1 staining; all these
samples were ERα-positive (Tab. 2). In the G3 subgroup, 10 of 12 tumors expressed nuclear IRS-1 (median 37%, data not shown) and 5 of 10 expressed ERα (median 35%). In 5 of 16 specimens, nuclear IRS-1 was found in the absence of ERα. ERα was expressed in 14 of 22 samples with the median frequency 70% (84 and 50%, in G2 and G3 subgroups, respectively)
(Tab. 2).
Cytoplasmatic IRS-1 was identified in all ductal and lobular cancer samples displaying
a weak to strong staining intensity (Tab. 5). In all specimens, the neoplasm surrounding tissue
appeared normal and the pattern of ERα and IRS-staining comparable to that of the normal samples.
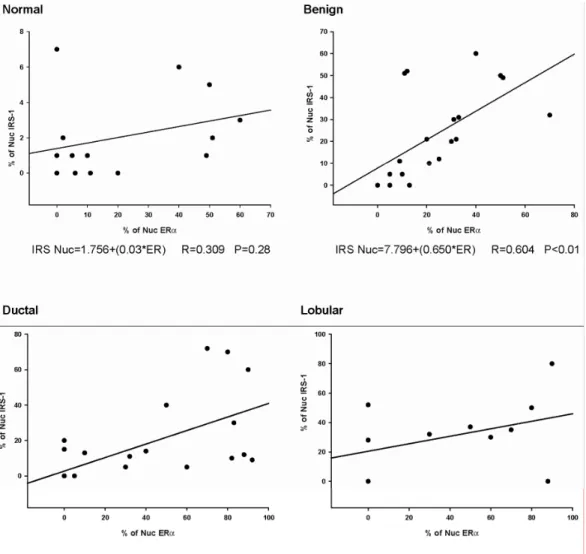
Correlation between nuclear IRS-1and ERα in breast cancer, benign tumors, and normal mammary epithelium
A very strong positive correlation (p<0.001) between nuclear IRS-1 and ERα was found in invasive ductal breast cancer. The markers were also positively associated (p<0.01)
Results
in benign tumors cancer samples (Fig. 9). However, no correlations were found between
nuclear IRS-1 and ERα in normal tissues (p=0.28) and lobular breast cancer (p=0.24) (Fig. 9).
Figure 9. Correlations between nuclear IRS-1 and ERα in normal breast tissues, benign breast tumors and breast
cancers. Associations between nuclear IRS-1 and ERα in different tissues were analyzed with Pearson correlation test.For each linear regression graph, the linear equation, the correlation coefficient (R), and the statistical significance (p) is reported.
Results
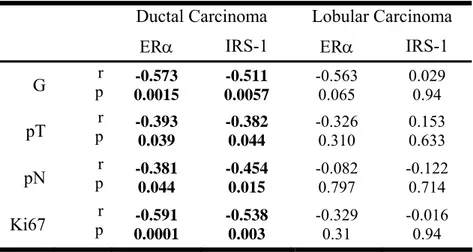
Nuclear IRS-1 and ERα are correlated with some clinicopathological features in invasive ductal carcinomas
The distribution of nuclear ERα and nuclear IRS-1 was analyzed with respect to tumor grade, tumor size, lymph node involvement, and proliferation index (Fig. 10).
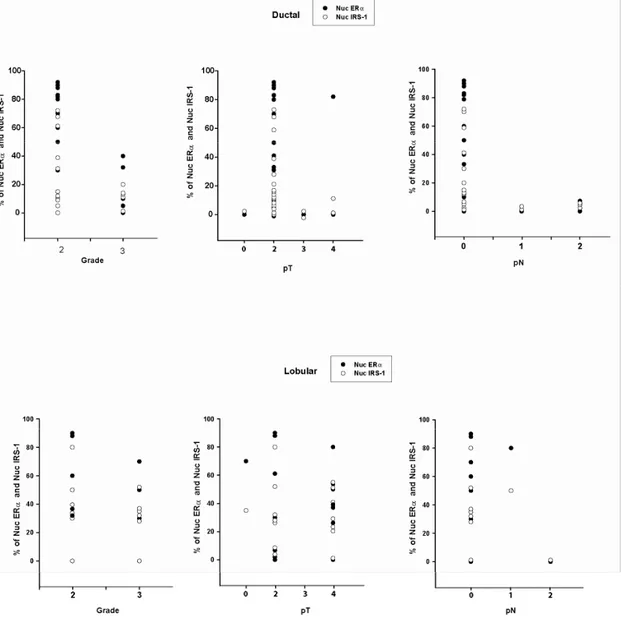
Figure 10. Distribution of nuclear IRS-1 and ERα in ductal and lobular breast cancers. Distributions of nuclear
IRS-1 (%) and ERα (%) relative to tumor grade (Grade), size (pT), and the lymph node involvement (pN) in ductal and lobular breast cancers are shown in scatterplots.
Results
The frequency of both ERα and nuclear IRS-1 expression was the highest in node-negative G2 invasive ductal carcinomas of smaller size (Fig. 10). In the same group, a significant
negative correlation between nuclear IRS-1 or ERα and differentiation grade, the tumor size, lymph node involvement and proliferation rate was found (Tab. 3).
In contrast, in lobular breast carcinomas, the distribution of nuclear IRS-1 or ERα appeared to be independent of and not correlated with tumor grade, size, or Ki67 expression
(Fig. 9 and Tab. 3). Interestingly, both nuclear IRS-1 and ERα were more abundant in lymph node-negative samples (Fig. 10), but no significant associations were determined between
these markers and lymph node status (Tab. 3).
Table 3. Correlation between nuclear IRS-1, ERα and selected clinicopathological tumor features.
Ductal Carcinoma Lobular Carcinoma
ERα IRS-1 ERα IRS-1
G p r 0.0015 -0.573 0.0057 -0.511 -0.563 0.065 0.029 0.94 pT p r -0.393 0.039 -0.382 0.044 -0.326 0.310 0.153 0.633 pN p r -0.381 0.044 -0.454 0.015 -0.082 0.797 -0.122 0.714 Ki67 p r -0.591 0.0001 -0.538 0.003 -0.329 0.31 -0.016 0.94
The association between nuclear IRS-1 or ERa and tumor grade (G), size (pT), lymph node involvement (pN), and the expression of the proliferation marker Ki67 was statistically analyzed with Pearson correlation test; r, correlation coefficient; p, statistical significance. The statistically significant correlations are bolded.
Results
The specificity and sensitivity of nuclear IRS-1 or ERα as a marker of tumor differentiation grade, tumor size and lymph node involvement was evaluated by the ROC curve analysis. The
comparison of the areas under the ROC curves obtained for nuclear IRS-1 and ERα indicated that both nuclear IRS-1 and ERα are good markers for tumor grading in invasive ductal carcinomas, while in lobular carcinomas only ERα could be considered a marker for grading (Tab. 4 and Fig. 11).
Neither ERα nor nuclear IRS-1 was a useful marker of tumor size, node involvement, or tumor proliferation (data not shown). The distribution of nuclear IRS-1 or ERα was not related to patient’s age and menopausal status in cancer, benign and normal samples (data not
shown).
Figure 11. Value of nuclear IRS-1 and ERα as diagnostic markers of tumor grading. Graphic evaluation of ERα
and nuclear IRS-1 in respect to tumor differentiation grade in invasive ductal and lobular carcinomas, showing the true-positive rate (sensitivity) and the false-positive rate (specificity) of the analysis as a function of all possible cut-points for the two markers. ERα, solid line; nuclear IRS-1, dotted line.
Results
Table 4. Association between nuclear IRS-1, ERα and tumor grade.
ROC analysis for tumor grade
Diagnostic Marker AUC estimate
(95% CI)
Area under the ROC curve Mann-Whitney test (p value) Ductal Carcinoma ERα 71.4 (41.9-91.4) 0.809 0.001 IRS-1 78.6 (49.2-95.1) 0.778 0.001 Lobular Carcinoma ERα 80.0 (28.8-96.7) 0.817 0.02 IRS-1 60.0 (15.4-93.5) 0.533 0.85
The analysis was performed with ROC curves, as described in Materials and Methods. The area under the ROC (receiver operating characteristic) curve (AUC) describes the value of nuclear IRS-1 or ERα to discriminate between G2 and G3 tumors. AUC estimate reports the confidence intervals considering an error of 5%. The statistical significance was evaluated by Mann-Whitney test for an area =0.5. Statistical significances are bolded.
Table 5. Descriptive statistics of cytoplasmatic IRS-1 in all samples
Cytoplasmic IRS-1 Expression (% of Cases in Class)
Normal Benign Ductal Lobular
0 0 0 0 0
1+ 29 21 16 0
2+ 29 21 52 63
3+ 42 58 32 37
Samples are grouped in 4 classes as described in Materials and Methods. The percentage of specimens with cytoplasmic IRS-1 in each staining category is given.
Relationship between cytoplasmatic IRS-1 and clinicopathological features
In ductal carcinomas, cytoplasmic IRS-1 (each staining intensity group) positively
correlated with ERα. Moreover, in ductal cancer low and moderate IRS-1 expression was positively associated with tumor size, while high IRS-1 levels negatively correlated with
tumor grade (Tab. 6).
In lobular carcinomas, high expression of cytoplasmic IRS-1 directly correlated with
Results
associated with ERα, while higher IRS-1 levels were not linked to ERα. No correlations between the two markers were found in normal samples (data not shown). Similarly,
cytoplasmic IRS-1 expression was not related to age or menopausal status in all analyzed
material (data not shown).
Table 6. Correlations between cytoplasmatic IRS-1 and selected clinicopathological features in ERα-positive tumors.
Ductal Lobular 0 1+ 2+ 3+ 0+ 1+ 2+ 3+ ERα p r - 0.978 0.025 0.637 0.019 0.987 0.013 - - 0.198 0.671 -0.029 0.970 G p r - 0.375 0.625 -0.082 0.790 -0.962 0.037 - - 0.204 0.661 -0.376 0.624 pT p r - 0.973 0.026 0.553 0.050 -0.577 0.423 - - 0.009 0.984 -0.225 0.775 pN p r - 0.00 1.00 0.301 0.318 - - - -0.069 0.883 - Ki67 p r - 0.724 0.276 -0.241 0.428 -0.905 0.095 - - -0.223 0.631 0.978 0.022
The associations between cytoplasmatic IRS-1 and ERα positivity (ERα), tumor grade (G), tumor size (pT), lymph node involvement (pN), and the expression of the proliferation marker Ki67 were statistically analyzed with the Pearson correlation test; r, correlation coefficient; p, statistical significance. The statistically significant correlations are bolded. The absence of value is due to either the absence of samples in the group or to the homogeneity of samples (variance =0).
Discussion
Discussion
The interactions between IGF-IR and ER signaling systems have been implicated in
the development of the neoplastic phenotype in mammary epithelial cells (Sachdev and Yee,
2001; Surmacz, 2000; Yee and Lee, 2000). In this context, IRS-1, a molecule that activates
multiple growth and survival pathways, has been found to be one of the central elements of
IGF-IR/ER crosstalk. Several reports documented that E2 can increase IRS-1 transcription,
while ICI inhibits IRS-1 mRNA levels (Sachdev and Yee, 2001; Surmacz, 2000; Yee and Lee, 2000). Furthermore, the expression of ERα seems to stabilize IRS-1 protein and potentiate IRS-1 signaling through the PI-3K/Akt pathway (Morelli et al., 2003). In turn, the
activation of IRS-1/PI-3K/ Akt by growth factors can stimulate ERα by increasing its phosphorylation (Lannigan, 2003). In MCF-7 cells, overexpression of IRS-1 has been shown
to induce estrogen independence (Surmacz and Burgaud, 1995), while downregulation of
IRS-1 resulted in increased sensitivity to E2 (Ando et al., 1998).
Here we report on a novel aspect of ERα/IGF-I crosstalk involving nuclear ERα/IRS-1 interactions. Specifically, we demonstrated that (ERα/IRS-1) in MCF-7 cells, IRS-ERα/IRS-1 can be
translocated from the cytoplasm to the nucleus following E2 treatment; (2) nuclear transloca
tion of IRS-1 is blocked with ICI and does not occur in ERα-negative cells; (3) nuclear IRS-1 interacts with ERα; (4) nuclear IRS-1 is corecruited with ERα to the ERE-containing pS2 promoter; and (5) the presence of IRS-1 decreases ERα transcription at ERE promoters.
Nuclear localization of IRS-1 has recently been described in different cellular systems
(Lassak et al., 2002; Prisco et al., 2002; Sciacca et al., 2003; Sun et al., 2003; Tu et al., 2002).
The mechanism by which IRS-1 enters cell nucleus is still not clear. Although IRS-1 contains
putative NLS, it is thought that IRS-1 is chaperoned to the nucleus by other proteins, for
instance, by T antigens of the SV40 and JC viruses (Lassak et al., 2002). The transporting
Discussion
In our experimental system, E2-dependent nuclear translocation of IRS-1 and its
interaction with the pS2 promoter were totally blocked when ERα was down-regulated by ICI (Figure 5) and did not occur in MDA-MB-231 cells that are ERα−negative but express ERβ (Vladusic et al., 2000) (Figure 6). However, re-expression of ERα allowed association of IRS-1 with the pS2 sequences. These observations suggest that nuclear function of IRS-1 in response to E2 requires ERα. Notably, a small amount of nuclear IRS-1 was found in unstimulated MCF-7 cells, which could result from basal ERα activity.
The prerequisite for nuclear translocation of IRS-1 in response to E2 is most likely the
formation of the ERα:IRS-1 complex in the cytoplasm. ERα association with cytoplasmic signaling molecules is not unusual. Recently, ERα has been shown to bind the PI-3K/Akt complex (Simoncini et al., 2000; Sun et al., 2001), and to interact with growth factor receptor
docking protein Shc (Song et al., 2002) as well as with IGF-IR (Kahlert et al., 2000).
Similarly, we reported that unliganded ERα can associate with cytoplasmic IRS-1 in MDA-MB-231/ER cells (Morelli et al., 2003). Our preliminary data suggest that ERα /IRS-1 binding involves at least two different IRS-1 domains, and does not depend on IRS-1 tyrosine
phosphorylation (Surmacz et al., unpublished data).
Our previous findings (Morelli et al., 2003) and this report suggest that only a fraction of ERα binds to IRS-1(∼10% of nuclear ERα) (Figure 2b), according to rough estimations based on coprecipitation procedures. However, if the linkage between ERα and IRS-1 is labile, coprecipitation assays might underestimate the actual extent of their association. In
fact, the results obtained with confocal microscopy in intact cells suggested that in some cells, ∼30% of ERα colocalized with IRS-1. Because only a fraction of ERα associates with IRS-1, it is understandable that nuclear accumulation of IRS-1 upon E2 stimulation might occur
slower than that of ERα. The nuclear presence of IRS-1 in E2 treated MCF-7 cells was limited to ∼72 h, while ERα remained nuclear for longer times. It needs to be discovered
Discussion
whether IRS-1 disappearance from the nucleus is caused by proteolysis or by translocation to
the cytoplasmic compartment.
In this work, we report for the first time that nuclear IRS-1 can interact with ERα on ERE-containing chromatin regions. In our experimental system, IRS-1 was recruited together
with ERα and other proteins involved in ERα transcription (SRC-1 and Pol II) to the pS2 promoter (Figures 3, 4, and 6). The possibility that IRS-1 modulates ERα-dependent transcription was addressed with transient transfection reporter assays. With this
methodology, we noted inhibition of ERα activity by IRS-1 in several cell lines (Figure 7a). We also found that overexpression of IRS-1 inhibits E2/ ERα-dependent transcription of the endogenous pS2 gene in COS-7 cells (Figure 7b). A hypothetical model explaining the
inhibitory effect of IRS-1 could be proposed on the basis of the recent discovery that ERα-dependent transcription from ERE sites requires cyclic proteasomal degradation of ERα (Reid et al., 2003). Because IRS-1 and ERα compete for the same degradation machinery (Morelli et al., 2003), it is possible that the presence of nuclear IRS-1 interferes with ERα proteolysis, and thus with ERα transcription. IRS-1 modification of ERα activity is probably restricted to certain transcriptional complexes, as we did not observe significant effects of IRS1 on ERα -dependent transcription at AP-1 sites. In addition, our new data suggest that the association of
IRS-1 with ERE promoters can be transiently inhibited by its recruitment to activated IGF-I
receptors (Surmacz et al., unpublished data).
The presence of nuclear IRS-1 in cellular systems was further evaluated in human
clinical material. Until now, analysis of breast cancer samples did not establish a clear
association between IGF-IR and breast cancer progression. Several studies demonstrated
higher expression of IGF-IR compared with non-cancer mammary epithelium, however this
feature has been associated with either favorable or unfavorable breast cancer prognosis
Discussion
1989; Pezzino et al., 1996; Railo et al., 1994; Surmacz, 2000; Turner et al., 1997; Yee, 1994).
The value of cytoplasmatic IRS-1 as a breast cancer marker is even less clear. Some studies
provided evidence that IRS-1 expression is higher in cancer than in non-cancer breast
epithelium, while others (including this study) reported that IRS-1 levels do not increase (but
can decrease) during cancer development and progression (Finlayson et al., 2003; Rocha et
al., 1997; Schnarr et al., 2000). Moreover, cytoplasmatic IRS-1 has been found either to
correlate with ERα and associate with a more differentiated phenotype or be independent from ERα and associated with a more aggressive phenotype (Ando et al., 1998; Koda et al., 2003; Lee et al., 1999; Schnarr et al., 2000). The significance of nuclear IRS-1 as a marker of
breast cancer has never been addressed.
In view of the importance of cytoplasmatic and nuclear IRS-1 in breast cancer growth
evidenced in vitro and conflicting or lacking data in vivo, we set out to investigate IRS-1
expression in normal mammary epithelium, benign tumors and breast cancer. Using IHC, we
assessed cytoplasmic and nuclear IRS-1 abundance and examined its association with other
markers and features, especially ERα.
Our data on cytoplasmic IRS-1 are consistent with those reported by Schnarr et al.
who noted moderate to strong IRS-1 expression in normal and benign tissues, and in well
differentiated carcinomas of both ductal and lobular origin (Schnarr et al., 2000). Similarly,
Finlayson et al.found no difference of IRS-1 phosphorylation in homogenates of normal and
breast cancer tissues (Finlayson et al., 2003). On the other hand, other groups reported low
IRS-1 expression in normal tissue and overexpression in poorly differentiated tumors (Koda
et al., 2005; Lee et al., 1998; Rocha et al., 1997). In agreement with Schnarr et al. we found a
positive association between cytoplasmatic IRS-1 and ERα and a negative correlation between high expression of IRS-1 an tumor grade in ductal carcinomas. This observation is
also consistent with coexpression of IRS-1 and ERα noted in less invasive breast cancer cell lines (Surmacz and Bartucci, 2004). In other studies ERα and IRS-1 were not positively
Discussion
correlated in primary tumors (Koda et al., 2005; Rocha et al., 1997). The causes for these
different results are unclear, but could be related to different IHC protocols, including
different Abs used.
We did not find any correlation between cytoplasmic IRS1 and lymph node
involvement in ductal and lobular cancers. This partially confirms data of Koda et al., who
did not observe such a correlation in the whole group of primary tumours, but only in the
subgroup of better differentiated (G2) cancers (Koda et al., 2005). Our results also suggested a
positive correlation between cytoplasmatic IRS-1 (weak to moderate) and tumor size in ERα-positive ductal cancers. This association has not been noted by others. Regarding cell proliferation, we found a positive correlation of IRS-1 and Ki-67 only in ERα-positive lobular cancers expressing high levels of IRS-1 and no associations in all other samples. Similarly, no
link between cell proliferation and cytoplasmatic IRS-1 levels was reported by Rocha et al. In
contrast, a negative correlation was reported by Schnarr et al., while Koda et al., noted a
positive IRS-1/Ki-67 correlation in ERα-positive primary tumors (Koda et al., 2005; Schnarr et al., 2000). Taken together, these data are still too few and inconsistent to suggest
cytoplasmic IRS-1 as a marker for breast cancer prognosis and diagnosis.
Instead, our results suggest that nuclear IRS-1 is tightly linked to ERα expression and might serve as an additional clinical breast cancer marker. As expected, ERα levels were similar in normal and benign tumors and strongly increased in moderately differentiated (G2) cancers. ERα expression was downregulated in poorly differentiated (G3) ductal cancers but not in G3 lobular cancers, confirming the value of ERα as a marker of differentiation in ductal carcinoma (Desombre, 1984; Mansour et al., 1994; McGuire, 1973). Similarly, the
levels of nuclear IRS-1, unlike cytoplasmatic IRS-1, were very low in normal tissue and
increased in benign tumors and breast cancer. Furthermore, a very strong correlation was
Discussion
lobular carcinomas. Importantly, in ductal cancers, but not in lobular, each nuclear IRS-1 and
ERα negatively correlated with tumor grade, tumor size, lymph node involvement and proliferation rate, suggesting their association with a less aggressive phenotype. The ROC
analysis confirmed that nuclear IRS-1 and ERα are both highly reliable as diagnostic markers of differentiation grade.
In summary, our data suggest that IRS-1 can interact with ERα in the nucleus of breast cancer cells and modulate ERα transcriptional activity and that nuclear IRS-1 can serve as a novel predictive marker of good prognosis in ductal cancer. The lack of association between nuclear IRS-1 and ERα in lobular cancer might suggest that in this setting IGF-I and ERα systems are not tightly linked, similar to the situation seen in benign tumors. We postulate