Faculty of Medicine and Psychology Department of Psychology
Ph.D. Course in Cognitive Psychology and Science 32nd Cycle
Perceptual Grouping by Proximity and Orientation Bias:
Experimental and Modelling Investigations
Ph.D. Candidate: Supervisor:
Antonino Esposito Prof. Antonino Raffone
Co-Supervisors: Prof. Marta Olivetti Belardinelli Dr. Luca Simione
ABSTRACT
Grouping by proximity is the principle of perceptual organization by which the elements of a visual scene which are closer in space tend to be perceived as a coherent ensemble. Research into this topic makes substantial use of the class of stimuli known as dot lattices. The Pure Distance Law (Kubovy et al., 1998) predicts that the probability of grouping by proximity in these stimuli only depends on the relative inter-dot distance between competing organizations. Despite much effort to explain how grouping by proximity is shaped by the basic organization of visual stimuli, its neural mechanisms are still under debate. Moreover, previous studies reported that grouping in dot lattices also occurs according to an orientation bias, by which these stimuli are perceived along a preferred orientation (vertical), regardless of what predicted by the Pure Distance Law. The aim of this thesis is to shed light on the functional and neural mechanisms characterizing grouping by proximity in dot lattices, as well as the trade-off between proximity- and orientation-based grouping. Study 1 investigates the role of high-level visual working memory (VWM) in promoting for the shift between grouping by proximity and orientation bias. Both the quantity (load) and the quality (content) of the information stored in VWM shape online grouping for dot lattices. Study 2 presents a neural network model simulating the dynamics occurring between low- and high-level processing stages during dot lattices perception. The degree of synchrony between the units at low-level module has a key role in accounting for grouping by proximity. Overall, our results show that high-level (Study 1) and low-level (Study 2) operations contribute in parallel to the emergence of grouping by proximity, as well as to its reciprocity with orientation-based grouping.
TABLE OF CONTENTS
Introduction ...1
Chapter 1: Quantitative Assessments of Grouping by Proximity ...5
1.1 The issue of Grouping Measurement ...5
1.2 IndirectMeasures of Grouping by Proximity ...6
1.3 Direct Measures of Grouping by Proximity...8
1.3.1 The geometry of Dot Lattices ...9
1.3.2 The Pure Distance Law ...13
1.4 Orientation Bias in Dot Lattices ...16
Chapter 2: Top-Down Modulations on Grouping by Proximity and Orientation Bias ...19
2.1 Introduction ...19 2.2 Method ...22 2.2.1 Participants ...22 2.2.2 Stimuli ...23 2.2.3 Procedure ...27 2.3 Results ...30
2.4 VWM Gating of Perceptual Grouping ...43
Chapter 3: A Dynamic Model of Grouping by Proximity and Orientation Bias ...51
3.1 Introduction ...51
3.2 Model Architecture and Functional Logic ...54
3.3 Model Units ...59 3.4 Simulations ...63 3.5 Model Behavior ...64 3.6 Simulation Results ...71 3.7 Discussion ...74 Conclusion ...79 References ...84 Appendix ...100
LIST OF FIGURES
Introduction
Figure I: Wertheimer’s Grouping Principles ...2
Chapter 1 Figure 1.1: Organization of a Dot Lattice ...10
Figure 1.2: Taxonomy of Dot Lattices ...11
Figure 1.3: Oriented Dot Lattice ...12
Figure 1.4: Attraction Function at different α values ...14
Figure 1.5: Grouping by Proximity at different AR values ...15
Chapter 2 Figure 2.1: Examples of Dot Lattices (AR = 1.2) ...24
Figure 2.2: Examples of Memory Arrays ...26
Figure 2.3: Trial Routine...27
Figure 2.4: Change Detection Results ...31
Figure 2.5: Probability of a and b Responses ...32
Figure 2.6: Proximity-Based Grouping for VWM Load ...34
Figure 2.7: Orientation-Based Grouping for VWM Load ...35
Figure 2.8: Proximity-Based Grouping for VWM Content (Low-Load) ...37
Figure 2.9: Orientation-Based Grouping for VWM Content (Low-Load) ...39
Figure 2.10: Proximity-Based Grouping for VWM Content (High-Load) ...40
Chapter 3
Figure 3.1: Architecture of the Model ...58
Figure 3.2: Oscillators in Perceptual Layer ...59
Figure 3.3: Trial Simulation (AR = 1.0) ...66
Figure 3.4: Trial Simulation (AR = 1.1) ...68
Figure 3.5: Trial Simulation (AR = 1.2) ...70
1
Introduction
Given the limited resources of the visual system, humans and other species are constantly required to implement efficient perceptual strategies to account for the heterogeneity and complexity of the external world. To have sufficient chances of survival, they need to localize salient stimuli, even under conditions of reduced visibility or camouflage. To accomplish this goal, it is imperative to integrate the features belonging to a relevant object into a unitary and meaningful percept while, at the same time, segregating them from features that belong to non-relevant objects. Both processes are required to correctly identify objects, since different stimulus features project to separate sub-regions of the retinal mosaic (Ahnelt, 1998).
The mechanisms through which the visual system organizes the complex pattern of sensory stimulation into a spatio-temporal coherent ensemble are collectively known as perceptual grouping. The word “spatio-temporal” here denotes that perceptual grouping organizes, not only static patterns of stimulation, but also ones that move or change over time, including changes caused by movements of the eyes. A clear example is provided by the phi phenomenon (Wertheimer, 1912), by which the same single dot appearing at different locations over time is perceived as being in continuous motion.
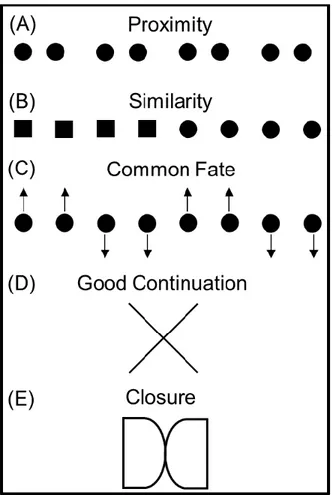
Wertheimer (1923) was the first to describe a set of principles by which grouping processes occur. These are nowadays referred to as the classical principles of perceptual grouping. Some of them are illustrated in Figure I. Wertheimer showed that altering the distance between adjacent dots, such that some became closer than others, induced the observers to group the closest ones together as unitary structures. This first principle based on the spacing between separate elements was thus
2
named as proximity (Figure IA). According to the principle of similarity, elements sharing some features are more strongly integrated in a whole than different stimuli (Figure IB). The principle of common fate posits that elements moving in the same direction tend to be perceived as belonging together (Figure IC). Panels D and E of Figure I show the principles of good continuation and closure, by which grouping emerges between elements aligned along a common direction or converging towards a closer shape, respectively. In more recent years, other principles have been added to the classical ones (for an exhaustive dissertation on classical and contemporary grouping principles see Brooks, 2015; Wagemans et al., 2012).
Figure I: Classical grouping principles individuated by Wertheimer (1923). (A). Example of grouping by proximity. The dots tend to be grouped into four separate pairs with the shortest inter-dot distance in between. (B). Example of grouping by similarity. The elements of the array tend to
3
be perceived as two groups depending on the shape. (C). Example of grouping by common fate. Dots moving in the same direction tend to be grouped together. (D). Example of grouping by good continuation. Observers prefer to perceive this patter as two straight lines intersecting in the middle, rather than as two 90° angles with touching vertices. (E). Example of grouping by closure. Elements composing closed patterns tend to be grouped together.
Perceptual grouping has traditionally been considered as a set of operations taking place at early stages of visual hierarchy, namely in a preattentive fashion (Palmer, 2002a; Palmer et al., 2003; Peterson & Kimchi, 2014). These operations are meant to generate proto-representations of an object in the visual field, over which subsequent operations are applied, which would lead to a final percept. However, in more recent years, this assumption has been challenged by the evidence that several factors, such as past experience, expectations and attentional manipulations, can strongly shape the occurrence and the timing of grouping processes (see Peterson & Kimchi, 2014). This corpus of research contributed to the view of perceptual grouping as a highly complex process which arises from the interplay between bottom-up (early and automatic) and top-down (later and voluntary) processes.
The present thesis aims to deepen our understanding of the functional and neural mechanisms of perceptual grouping, particularly highlighting the role of the reciprocal relationship between low-level and high-low-level processing stages. In doing so, I specifically take into account the principle of grouping by proximity, even though many of the conclusions to which this work leads, might be extended to other grouping principles as well.
4
Chapter 1 introduces the issue of the objective measurement of perceptual grouping. The main focus is on psychophysical experiments aimed at quantitatively assessing the strength of grouping by proximity. The stimuli that most of these studies employed (i.e. the dot lattices) are extensively described. The chapter also introduces the issue of perceptual bias overruling grouping by proximity in dot lattices. Perceptual bias is understood as the top-down influence over low-level visual areas, reflecting the state of the observers.
Chapter 2 presents a behavioral experiment aimed at investigating how external stimulus factors, such as proximity, and internal factors, such as perceptual bias, shape perceptual grouping process. This study investigates the role of visual working memory (VWM) modulation in determining whether grouping process for ambiguous dot lattices occurs according to proximity principle or according to orientation bias. A dual-task paradigm is employed, where grouping evaluation is embedded in-between the encoding and the retrieval stages of a change-detection task, in which VWM is loaded with ungrouped information.
Chapter 3 introduces a dynamic network model accounting for the perception of grouping by proximity based on its quantitative measurement. In the model, grouping by proximity is achieved through the interplay of feedforward and lateral connections between low- and high-level modules. By replicating some of the experimental results exposed in Chapters 1 and 2, the model simulations offer a biologically plausible explanation of the neural mechanisms underlying grouping by proximity, as well as orientation bias interference.
The thesis ends with a general discussion of the results outlined in the two studies, and suggest possible developments for further research.
5
Chapter 1
Quantitative Assessments of Grouping by Proximity
1.1 The issue of Grouping Measurement
The long history of research investigating the operations governing perceptual grouping can be traced back to Wertheimer’s seminal paper (1923). His work was crucial in laying the foundations for our understating of how the perceptual organization of visual scenes is extracted and processed by our perceptual system. The method that Wertheimer (1923) used to illustrate classical principles of perceptual grouping was based on visual demonstration of sketches illustrating the principle to his audience. Thus, this approach fully relied on the qualitative experience of observers. This method may suggest which components of a visual scene are typically bound together as a whole, but did not provide any indication of the strength of the grouping process (Peterson & Kimchi, 2013; Wagemans et al., 2012a).
To assess this issue, a quantitative approach is needed (Palmer, 2002b). As pointed out by Palmer and Beck (2007), the distinction between qualitative and quantitative approaches to the study of perceptual grouping relates to the distinction between subjective and objective methods in perceptual studies. In subjective perceptual tasks, correct responses rely on the current experience of the observers and, as such, susceptible to distortion. In objective perceptual tasks, correct responses are defined on the physical parameters of the stimuli, and, as such, are observer-independent. In their perspective, quantitative estimation of grouping is best achieved when perceptual experience is unrelated to the subjective report of the participants.
6
This section provides an overview about such quantitative accounts to the investigation of perceptual grouping. Although several researches exposed here takes into account several principles of grouping, we will focus on proximity principle. As for many fields of psychology, research investigating grouping by proximity has used both indirect and direct methods, whose attributes are separately addressed in following .
1.2 Indirect Measures of Grouping by Proximity
One convenient strategy to overcome demand characteristics in perceptual research is to use tasks providing an indirect quantification of the processes under investigation (Palmer & Beck, 2007; Palmer & Nelson, 2000, Schmidt & Schmidt, 2013, Wagemans, 2018). The word “indirect” refers to the fact that perceptual judgments made by the observers do not reflect any task specification. In other words, participants are unaware about which dimension of visual stimuli represents the actual focus of the experiment (e.g. Gogel, 1976; Reingold & Merikle, 1988).
One of the most popular method to indirectly asses grouping by proximity is the repetition discrimination paradigm (RDT; Beck & Palmer, 2002; Palmer & Beck, 2007; Vickery, 2008, Vickery & Jiang, 2009). Participants are showed with a string of alternating shapes (i.e. squares and circles). At one point, one of the shapes is repeated instead of being alternated with the other. This constitute the target pair, which participants have to detect as quickly as possible. The distance between the shapes in the target pair and the distance between the target pair and the other elements of the string are orthogonally varied. The results show that participants are faster in detecting the target pair when repeating shapes were both closer each other and farther from other adjacent shapes (within-group condition). This procedure has provided comparable results with other
7
grouping factors, such as similarity, common region, and connectedness (Palmer & Beck, 2007, Experiments 3-5).
A more recent paradigm has been developed by Wei et al. (2018). Their task is based on the well-known tilt aftereffect (TAE) typically found in adaptation studies (Dragoi et al., 2000; 2001; Fritsche et al., 2017; Jin et al., 2005; Webster, 2011). TAE refers to the fact that the perceived orientation of a stimulus (test) is altered after participants are exposed to a previous oriented stimulus (adaptor). In one of the conditions, adaptors are arrays of dots presenting a clear proximity organization. In this task, participants are required to respond to the orientation of the test stimulus, ignoring the previously presented adaptor. The results show that adaptors are still effective in inducing TAEs for subsequent test stimuli, with largest TAE implying a stronger proximity organization for the adaptors.
These two examples clearly illustrate that indirect methods configures themselves as a valid approach to quantify grouping by proximity, as well as other principles and their interaction (Wei et al., 2018, Experiment 3). The fact that participants are not aware of which dimension of perceptual experience is actually under investigation makes this type of tasks less susceptible to demand characteristics, preventing response biases. However, the disadvantage of not relying on the perceptual experience is that the performance in these tasks could reflect perceptual and cognitive processes other than grouping. In other words, it is not guaranteed that indirect methods to perceptual grouping measures what they are designed for (Brooks, 2015: Palmer & Beck, 2007, Schmidt & Schmidt, 2013). To overcome these limits, other scholars prefer investigating grouping phenomena through direct methods.
8
1.3 Direct Measures of Grouping by Proximity
Direct methods in grouping quantitative research involve presenting stimuli to the participants under multiple viewing conditions and collecting the reports about what they actually see (Wagemans, 2018). Although ruled by high experimental rigor, such approach derives from the qualitative demonstrations of early Gestaltists, and, as such, is based on the subjectivity of the observers. For this reason, a similar approach is referred to as experimental phenomenology (e.g. Albertazzi, 2015; Sinico, 2008), or, alternatively, as phenomenological psychophysics (Kubovy & Gephstein, 2003; Strother et al., 2003).
As argued by Kubovy and Gephstein (2003), the emphasis put on the phenomenal aspect indicates “A characteristic of or belonging to reality as perceived rather than as independent of mind.”. This pits against idiosyncratic subjectivity, which strictly relates to the individuality of the perceiver, without being characterized by the sensory stimulation. Thus, phenomenology does not compromise the objectivity of psychological measurement, since it still is anchored to the appearance of a physical entity.
The application of phenomenological psychophysics to perceptual grouping has classically made use of a peculiar class of stimuli, knows as dot lattices. Given the importance of such stimuli for empirical section of the present work, their perceptual organization is extensively described.
9 1.3.1 The geometry of Dot Lattices
A dot lattice can be defined as a collection of dots on a plane, holding two fundamental proprieties: 1) the dots are discrete (i.e., they can be distinguished as singular elements); and 2) the dots entirely span the plane (i.e., the separation between them is not excessive).
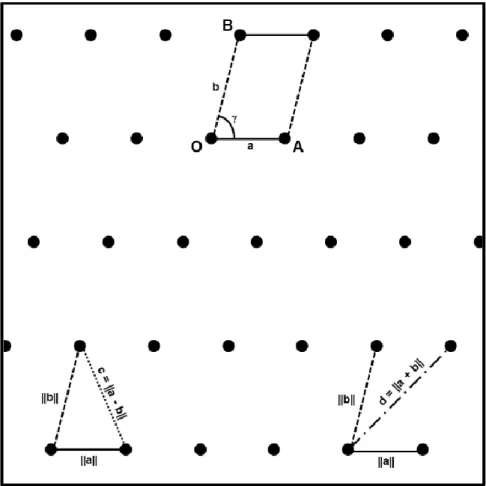
The basic structure of a dot lattice is illustrated in Figure 1.1. Considering one dot O in the plane, we can define a distance a from its closest neighbor (A) and a distance b from its second closest neighbor (B). These distances coincide with the translation vectors a (with norm ||a||), and b (with norm ||b|| ≥ ||a||), respectively. The angle between these two vectors (γ) has been demonstrated to lie within the interval 60° ≤ γ ≤ 90° (Kubovy, 1994). a, b and γ together form the fundamental structure of a dot lattice, namely the basic parallelogram, with a and b being the shortest and longest sides, respectively. The basic parallelogram defines the spatial relationship between each quartet of dots in the stimulus, and, thus, the lattice itself (Figure 1.1).
The diagonals of the parallelogram are indicated as the vectors c and d and are parallel to the vectors having norm ||a - b|| and ||a + b||, respectively. In this way, all the possible directions between one dot and its eight surrounding dots are specified by these four vectors, which, are constrained to the relation ||a|| ≤ ||b|| ≤ ||c|| ≤ ||d||.
10
Figure 1.1: Basic organization of a dot lattice. The vector connecting O and A is the shortest inter-dot distance and is typically indicated as a (with norm ||a||). The vector b (with norm ||b|| ≥ ||a||) connects O with B and, in this example, is the second shortest inter-dot distance. The angle these two vectors form is indicated by γ. Together, a, b, and γ constitute the basic parallelogram, which determines the spacing between four dots. The diagonals of the basic parallelogram are indicated as the vectors c and d, which have norm ||a - b|| and ||a + b||, respectively.
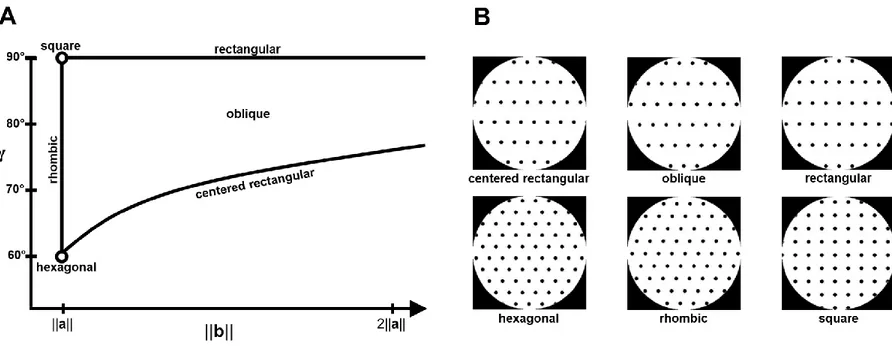
Since c and d can be always computed starting from a, b and γ, these are the parameters useful to characterize a lattice. Keeping a constant, Bravais (1949), and subsequently Kubovy (1994), formulated the taxonomy of dot lattices by systematically varying b and γ. These authors individuated six classes of dot lattices, each of which presents different symmetry proprieties:
11
square, hexagonal, rhombic, oblique, rectangular, and centered rectangular (Figure 1.2). As we can see by Figure 1.2A, as ||b|| changes relative to ||a||, different types of lattices are defined. Such difference in length between inter-dot distances b and a (||b||/||a||) is known as aspect ratio (AR) (Kubovy, 1994; Kubovy & Wagemans, 1995). For example, squared dot lattices are characterized by AR = 1.0, which means that ||b|| is equal to ||a||, and thus a and b distances are characterized by the same inter-dot spacing. As the AR increases, the difference between a and b increases and a becomes the shortest inter-dot distance. For AR > 1.0 and γ fixed at 90°, dot lattices are classified as rectangular. Thus, squared dot lattices can be considered as a specific subclass of rectangular dot lattices, presenting AR = 1.0.
Figure 1.2: Taxonomy of dot lattices. (A). The six classes of dot lattices are obtained by keeping constant the norm of vector a and varying ||b|| and γ accordingly. The ratio between vectors a and
b is known as the aspect ratio (AR = b/a), and it is an important parameter in determining how a
dot lattice is perceived. (B). Illustration of one exemplar for each class. Note the circular configuration, which is typically how dot lattices are presented during experiments.
12
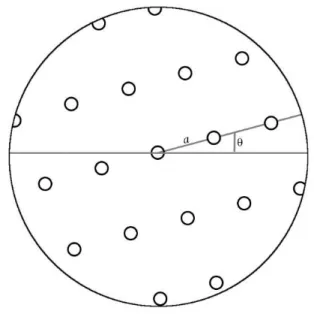
Dot lattices are typically displayed in a circular configuration as in Figure 1.2B, where the dots can be perceived as aligned in a certain orientation. These orientations parallel the four distance vectors a, b, c, and d, and, therefore, henceforth we will refer to them as a, b, c, and d. Thus, grouping by proximity in these stimuli occurs when they are perceived as parallel strips of dots oriented along a. Notice that at AR = 1.0, inter-dot distance along orientation b is equal to the one along orientation a, and, thus, b defines grouping by proximity as well. Moreover, hexagonal dot lattices are specified by the condition ||a|| = ||b|| = ||c|| and, thus, in these stimuli grouping by proximity occurs along each of these orientations.
During a typical dot lattices experiment, the stimuli are presented in different orientations of a. Such orientations are specified by the angle between a and the horizontal diameter of the circular configuration of a dot lattice (θ), which ultimately defines the overall tilt of the stimulus (Figure 1.3).
Figure 1.3: Example of oriented dot lattice. The angle θ between a and the horizontal diameter of circular configuration defines the overall tilt of a dot lattice. In this exemplar, AR = 1.2 and γ = 79°.
13
A last relevant feature of dot lattices is given by the fact that by increasing ||a||, the dot density of a finite dimension lattice is reduced, and vice versa. In other words, ||a|| represents the spatial scale of the stimulus.
1.3.2 The Pure Distance Law
In one of the first studies systematically varying all the parameters of dot lattices outlined above was conducted by Kubovy and Wagemans (1995). They presented participants with several types of dot lattices sampled the two-parameter stimulus space (Figure 1.2A). Stimuli lasted for 300 ms, after which participants were forced to report their perceived orientation. The frequencies for each orientation were then treated as an estimate of the strength of grouping by proximity and were plotted as a function of the relative inter-dot distance. The authors found that the probability to group the dots along one orientation v exponentially decreased with increasing its distance (v) relative to the shortest inter-dot distance (a):
𝑝(𝒗) 𝑝(𝒂) = 𝑒
−𝛼(||𝐯||||𝐚|| − 1)
[1.1]
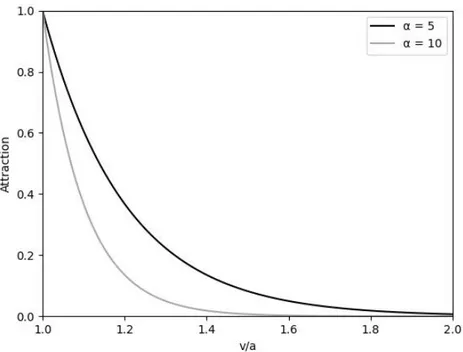
where the term ||v||/||a|| represents the length of the distance between two dots along orientation v scaled by the shortest inter-dot distance a and α (> 0) is referred to as attraction constant and defines the individual sensitivity to proximity (Figure 1.4). This function was defined attraction function because it states that the tendency to group together two dots (attraction) diminishes with increasing the distance between them.
14
Figure 1.4: Attraction function for different values of α. The tendency to group the dots along an orientation v other than a diminishes as the inter-dot distance along v (v/a) increases. In Equation 1.1, α defines an individual parameter of sensitivity to proximity. Thus, the higher α, the higher observers tend to group the dots according to proximity principle (i.e. attraction along v is reduced).
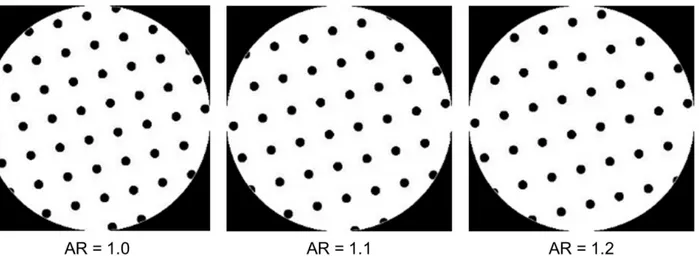
In other words, attraction function predicts that the probability to group the dots by proximity decreases as the inter-dot distance along orientations other than a diminishes. Since the structural organization of dot lattices imposes that ||b|| ≤ ||c|| ≤ ||d||, reducing the distance along b also increases the attraction along c and d. In this sense, the probability of grouping by proximity in dot lattices depends on their AR (Figure 1.5). Recall that when AR = 1.0, inter-dot distances along a and b have the same length. In this case, the attraction function predicts that the perception of the dot lattices along these orientations is equiprobable. Thus, since both interpretations are equally
15
likely, stimuli at AR = 1.0 present a higher degree of perceptual ambiguity (Kubovy, 1994). This model was therefore denominated Pure Distance Law, since, the only stimulus parameter predicting the occurrence of grouping by proximity is the relative distance between the single elements (Kubovy et al., 1998, but see Bleumers et al., 2008, for a discussion of how the scale of peripherally presented lattices affects the grouping).
Figure 1.5: Probability of grouping by proximity in dot lattices at different values of AR. The probability to group the dots along a increases with the AR. At AR = 1.0, a and b have the same length and the attraction function predicts the same probability of grouping along both distances. Since the different stimulus interpretations are equally likely, dot lattices at AR = 1.0 present the highest level of perceptual ambiguity.
The phenomenological psychophysics approach has been applied, among others, to investigate the interaction between proximity and similarity (Kubovy & Gephstein, 2000; Kubovy & van den Berg, 2008, Luna & Montoro, 2011). The aim of these studies was to characterize how the strength of grouping by proximity varies with the similarity between the elements of the stimuli, and vice versa. This has been pursued by combining the two factors in the stimuli such that they were either in accordance or in competition. Proximity and similarity contributed independently to grouping
16
processes, whereas their joint effect was given by the sum of both their effects in isolation. Similar additive effects have been found for the combination of proximity and collinearity (Claessens & Wagemans, 2005; 2008), and between proximity and curvature, at least as they were not in conflict (Strother & Kubovy, 2006; 2012). Interestingly, these latter studies found that curvature overruled proximity when grouping along the two dimensions competed. The authors interpreted these results in terms of the non-accidental character (Blusseau et al., 2016; Kayaert & Wagemans, 2010; Vogels et al., 2001; Witkin & Tenenbaum, 1983) of curvilinear patterns in the stimuli. Participants were more likely to group along the most curvilinear orientation because they considered it less likely to be a casual factor in the stimulus and, as such, it gained higher weight in the process of selection. This suggests that grouping by proximity can be modulated by a top-down factor representing acquired knowledge about external contingences. This information provided a bias on visual processes responsible for perceptual grouping, which overruled the stimulus support (Gephstein & Kubovy, 2005) brought by the proximity of the dots.
1.4 Orientation Bias in Dot Lattices
Numerous studies on visual discrimination of oriented stimuli found evidence for an orientation bias, by which participants are more likely to perceive the stimuli in a preferred direction (e.g. Appelle, 1972; Girshick et al., 2011; Nasr & Tootell, 2012). Using simple configurations of stimuli, such as oriented gratings, these studies have reported evidence for an oblique effect. That is, participants are better in discriminating cardinal orientations (i.e. horizontal and vertical) than oblique ones (but see Essock et al., 2003; Hansen & Essok, 2004, for different results using broadband natural scenes). Single cell recordings as well as neuroimaging studies have linked such effect to the intrinsic properties neural populations tuned to cardinal orientations, such as their
17
higher distribution within V1 and their narrower receptive fields (Chapman & Bonhoeffer, 1998; Furmanski & Engel, 2000; Li et al., 2003).
In dot lattices, several studies provided evidence that grouping operations are accompanied by a bias for the vertical orientation (Bleumers et al., 2008; Claessens & Wagemans, 2008; Nikolaev et al., 2016). In these studies, participants presented with rectangular dot lattices were more likely to group the dots along the vertical orientation, regardless of what was predicted by the Pure Distance Law function. Thus, the preference for vertical orientation during dot lattices dicrimination is accompanied by a reduction of proximity sensitivity (α parameter of the attraction function). However, the opposite could also be true: random fluctuations in the α parameter during some trials may render participants more susceptible to the influence of vertical bias (Bleumers et al., 2008).
Gephstein & Kubovy (2005) proposed that orientation bias during dot lattice perception may reflect a situation in which the amount of information brought by the stimulus to the perceptual system is low. In that case, the final decision relative to the orientation of the lattices is taken on the basis of the internal state of the observer.
Physiological and neuroimaging studies link these forms of perceptual bias to the top-down feedbacks from fronto-temporal networks over primary and secondary visual areas (V1 and V2), reflecting inferential (Frith & Dolan, 1997; Hohwy, 2017; Kok et al., 2013; Summersfield & de Lange, 2014; Wang et al., 2013), or associative (Albright, 2012) processes that may help people to deal with perceptual ambiguity. Accordingly, vertical preference in rectangular dot lattices was stronger for multistable stimuli at AR = 1.0, whereas it decreases as the stimuli become less ambiguous (Nikolaev et al., 2016). Grouping in dot lattices may therefore be intended as the
18
contraposition of two forces: the current stimulus and stimulus expectations (Nikolaev et al., 2008).
Several studies on dot lattices considered preference for vertical orientation a noise factor, which could be balanced by presenting rotated versions of the stimuli, such that the angle θ always appeared to be rotated to a different degree (e.g. Kubovy & Wagemans, 1995; Kubovy et al., 1998). However, other studies found that its occurrence was modulated by several contextual factors, such as the recent visual experience (Gephstein & Kubovy, 2005) and perceptual learning (Nikolaev et al., 2016).
This suggests that orientation bias can exert systematic effects on dot lattices perception, which can alter the fate of ongoing grouping process. In the next sections, I will present a phenomenological psychophysics experiment aimed to shed light on the trade-off between grouping by proximity (as prospected by Pure Distance Law) and orientation bias in rectangular dot lattices.
19
Chapter 2
Top-Down Modulations on Grouping by Proximity and Orientation Bias
2.1 Introduction
The Pure Distance Law (Kubovy et al., 1998) assumes that the probability to group the dots in a lattice along one orientation purely depends on the relative distance between the dots along such orientation. In this sense, the emergence of perceptual organization in those stimuli is entirely determined by their bottom-up layout. However, top-down factors have been reported to alter grouping processes, overshadowing the distance between the dots. Strother and Kubovy (2006; 2012) used rectangular dot lattices, with different degrees of curvature along a and b orientations. They found that participants are more likely to group the lattices according to the highly curved direction, regardless of what predicted by the AR of the stimuli. The authors explained these results in terms of non-accidental character (Blusseau et al., 2016; Kayaert & Wagemans, 2010; Vogels et al., 2001; Witkin & Tenenbaum, 1983) of the curvilinear pattern of the stimuli. In other words, the curvature is judged as less likely to occur by chance in that context and, as such, it gained higher weight in the process of selection. This result suggests that grouping by proximity can be modulated by a top-down mechanism that biases the representation of one feature at the expense of the relative distances between the dots.
Similarly, proximity has been observed to be challenged by the relative preference for vertical orientation, a phenomenon termed orientation bias (Bleumers et al., 2008; Claessens & Wagemans, 2008; Gephstein & Kubovy, 2005; Nikolaev et al., 2016).
20
Using rectangular dot lattices at different levels of AR (i.e. stimulus ambiguity), Nikolaev et al. (2016) observed sequences of trials, in which orientations close to the vertical were preferred, regardless of proximity. The effect was stronger for stimuli at the highest level of ambiguity, whereas it weakened as the AR of the lattices increased. Such episodes of orientation bias tended to disappear as the experiment went by, together with as increase in grouping based on proximity. The authors attributed the presence of orientation bias to visual working memory (VWM). They proposed that, during the early stages of the experiment, participants maintain in VWM a representation of past trials in order to adjust their judgments. When VWM is occupied by those previous representations, a biased response tuned towards vertical orientation is given. This explanation is in line with the view that during perception VWM maintains coarse representations of the stimuli (proto-representations), which are gradually updated with more detailed information by object-based attention (Gao, Gao et al., 2011; Gao, Ding et al., 2013). This process would result either in perception based on stimulus features or in perception based on bias, depending on whether VWM resources are available at hand. Thus, accordingly, whether proximity or orientation control grouping of the dots depends on the load of the information hold in VWM. To investigate top-down effects of VWM in determining the trade-off between proximity and orientation bias in perceptual grouping, we use a classical dual task procedure, where a visual discrimination task is embedded within the encoding and the test stages of a change detection task. For the former task, participants are shown with dot lattices with different degrees of ambiguity and have to report which orientation in the stimuli they perceive as the most prominent. For the latter task, participants are presented with four oriented items (i.e. Gabor patches) and are asked to retain them for a subsequent comparison. Gabor patches are presented in two conditions of
21
complexity, which differently engaged VWM resources. In the low-load condition, all Gabor patches are in the same orientation, whereas in the high-load condition, they differ.
If the amount of information occupying VWM alters grouping processes for dot lattices, we expect to find higher rate of proximity-based responses in low-load than in high-load condition. If such reduction of proximity sensitivity is promoted by orientation bias, we expect this effect to coincide with an increase of vertical responses in high-load condition compared to low-load condition, regardless of the AR of the stimuli.
However, it could be that, instead of VWM load, the factor shaping how dot lattices are grouped is VWM content. In this case, the key factor in determining the trade-off between proximity-based and orientation-based grouping would be the quality of the information in VWM, rather than the quantity. For example, when participants maintain in VWM a representation of preceding vertical information, it could influence whether the dots are grouped according to the proximity of according to the orientation in a newly presented stimulus. Thus, the report of participants would be determined by VWM content.
The effect of VWM content on the perception of newly presented stimuli has been demonstrated (Kang et al., 2011; Pan et al., 2014; Salahub & Emrich, 2016; Scocchia et al., 2013, Teng & Kravitz, 2019, Experiment 3; van Leeuwen et al., 1988). In these studies, participants are typically asked to hold a stimulus or a single feature (e.g. orientation) in their VWM while performing a discrimination task. These studies show that perceptual performance improves when the items hold in VWM and the to-be-discriminated stimuli share some commonality compared to when they differ (congruence effect).
22
Thus, we check for the possible influence of VWM content. In both load conditions, half of the trials require to hold in VWM items with orientations similar to a, the orientation predicted by proximity for the dot lattice (congruent content); and others require to hold in VWM items with orthogonal orientations (incongruent content). Beside VWM load, we also expect congruency to affect grouping by proximity in the dot lattices. Specifically, proximity-based responses are expected to be enhanced in the congruent compared to the incongruent condition (congruence effect). Moreover, if VWM content can also promote for orientation-based grouping of dot lattices, a stronger congruence effect for vertical than for horizontal VWM content should emerge.
2.2 Method
2.2.1 Participants
Thirty-three participants took part to the experiment (17 female, age = 26 ± 6). They all had normal or corrected to normal vision. Half of the data were collected at KU Leuven where participants were recompensed with 2 course credits for taking part to the experiment. The other half of the data were collected at Sapienza University of Rome, where participants voluntary joined the study. The whole procedure was in accordance to the Declaration of Helsinki and was approved by the Ethical Committee of KU Leuven.
23 2.2.2 Stimuli
We used two sets of stimuli, one for each of the tasks involved in our dual task procedure. For the visual discrimination task, we used rectangular dot lattices, with AR values varying between 1.0, 1.1 and 1.2. As discussed in Chapter 1, when the stimuli presented AR = 1.0, a and b distance vectors have equal norm, and, thus, according to the Pure Distance Law, grouping by proximity can occur along both a and b orientations and the stimuli have higher level of ambiguity. As the AR of the lattices increases, grouping by proximity more strongly tunes towards orientation a and the stimuli become less ambiguous.
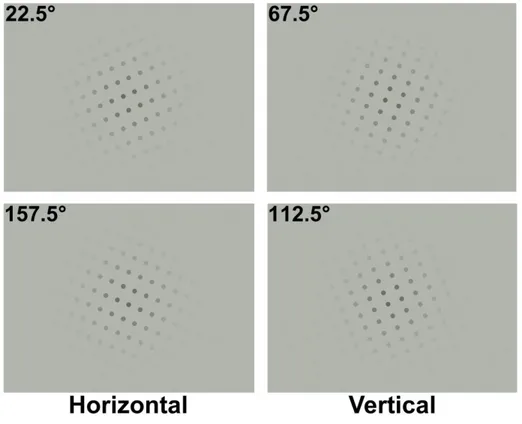
Similar to previous experiments (Nikolaev et al., 2008; 2010; 2016), dot lattices were arranged within a bivariate isotropic Gaussian distribution, to reduce possible impact of the edges of the screen. This created a circular configuration of supra-threshold dots with a diameter of 11.3 degrees of visual angle (dva). In each dot lattice, the dots had a diameter of 0.46 dva and the inter-dot distance at AR = 1.0 was 0.65 dva. Dot lattices were not presented in cardinal orientations (i.e. θ ≠ 0° and θ ≠ 90°), since grouping by proximity is reduced along such orientations (Claessens & Wagemans, 2008), and to minimize the risk of categorical effects on participants’ perceptual judgments. Instead, we used values of θ such that the stimuli appeared close to cardinal orientations (Figure 2.1): when θ was at 22.5° or 157.5°, a was closer to the horizontal axis (horizontal dot lattices); whereas when θ was 67.5° or 112.5°, a was closer to the vertical axis (vertical dot lattices).
24
Figure 2.1: Examples of dot lattices at AR = 1.2, we employed in our experiment. The orientation of the stimuli is defined according to the angle θ between the horizontal diameter of the circular configuration and the vector a. The stimuli tuned at 22.5° and 157.5° are closer to the horizontal axis, and, thus, they are referred to as “horizontal dot lattices”, whereas the ones tuned at 67.5° and 112.5° are closer to the vertical axis, and, thus, they are referred to as “vertical dot lattices”.
For the change detection task, we presented memory arrays formed by Gabor patches embedded in a Gaussian envelope. The visible area of the patches covered 3 dva and their spatial frequency was 1.5 cycles per degree. They were placed at four equally distant locations from the fixation point (a circle of 0.32 dva of diameter at the center of the screen). The distance between the fixation point and the center of each Gabor patch was 2.5 dva. To limit for possible interference arising from the global configuration of a memory array, in half of the presentations the whole array was
25
tilted by 22.5° clockwise from the horizontal, and in the other half it was tilted by 22.5° counterclockwise from the horizontal (Figure 2.2A).
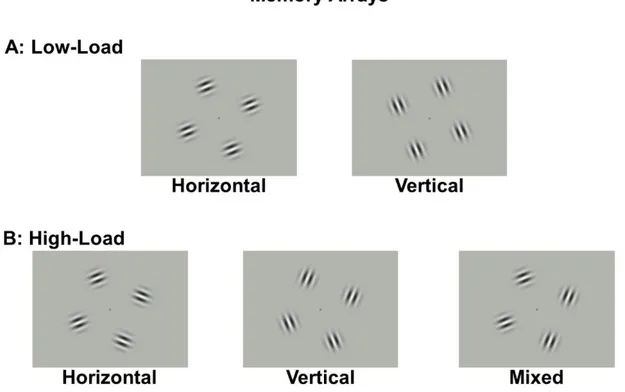
In low-load trials, the four Gabor patches all had the same orientation, whereas, in high-load trials, the four Gabor patches presented the same orientation two by two, with equally oriented stimuli that were either horizontally or vertically aligned (Figure 2.2B). In the high-load condition, Gabor patches subtended to three possible organizations: 1) a “horizontal memory array”, in which two Gabor patches were oriented at 22.5° and the other two at 157.5°; 2) a “vertical memory array”, in which two Gabor patches were oriented at 67.5° and the other two at 112.5°; 3) a “mixed memory array”, in which two Gabor patches were presented in one of the horizontal orientations (22.5° or 157.5°) and the other two in one of vertical orientation (67.5° or 112.5°). Thus, depending on the orientation of the following dot lattice, we obtained a congruent condition when a horizontal memory array was followed by a horizontal dot lattice or when a vertical memory array was followed by a vertical dot lattice; an incongruent condition when a horizontal memory array was followed by a vertical dot lattice or when a vertical memory array was followed by a horizontal dot lattice; or a mixed condition when mixed memory arrays were presented. This latter provided a neutral baseline for comparison with the congruent and the incongruent conditions. In the low-load condition, since all the stimuli within the memory array were in the same orientation, only vertical and horizontal memory arrays were possible, thus defining only congruent and incongruent conditions.
26
Figure 2.2: Memory arrays used for the different conditions of change detection task. Each array consists of a squared configuration of Gabor patches, rotated 22.5° clockwise or counterclockwise from the horizontal, with each stimulus being equidistant from the central fixation point. (A). In the low-load condition, all Gabor patches are in the same orientation: either horizontal (left) (22.5° and 157.5° rotations) or vertical (right) (67.5° and 112.5° rotations). (B). In the high-load condition, Gabor patches are in the same orientation two by two. Same orientation pairs can be either vertically or horizontally aligned. With respect to patch orientation, we distinguish: horizontal (with one pair of stimuli being at 22.5° and the other one being at 157.5°), vertical (with one pair of stimuli being at 67.5° and the other one being at 112.5°) and mixed (with all possible combinations of horizontal and vertical pairs).
27 2.2.3 Procedure
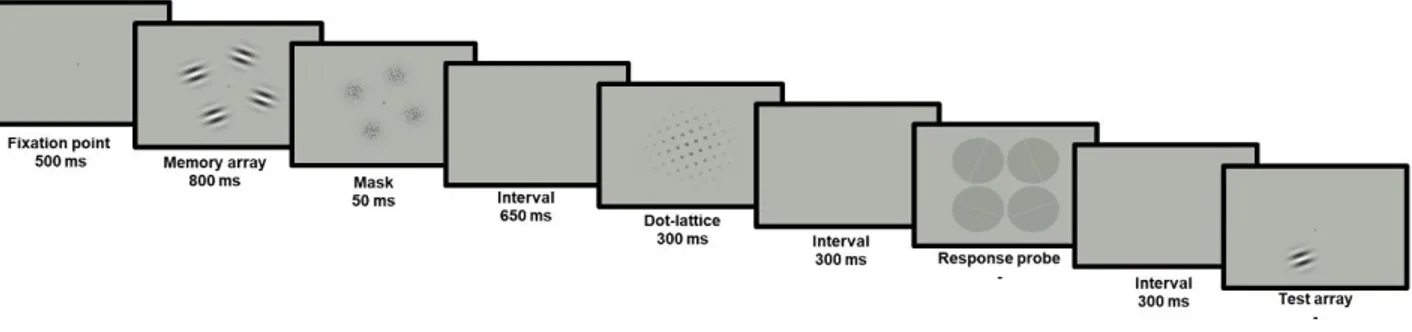
The experiment consisted in a visual discrimination task sandwiched in-between the two displays of a change detection task. Tasks were performed on a 23’’ LCD monitor (refresh rate of 60 Hz), placed at 70 cm from the participants. The whole procedure was administered using PsychoPy3 software (Pierce, 2007). Trials consisted of the following displays: fixation point, memory array, mask array, dot lattice, response probe, and test array (Figure 2.3). Memory array and test array referred to the change detection task, whereas dot lattice and response probe referred to the visual discrimination task.
Figure 2.3: Single trial routine in our experiment. The four Gabor patches in the memory array could be either all in the same orientation (low-load condition) or, as in this case, in the same orientation two by two (high-load condition). After the mask and a 650 ms interval, participants performed the perceptual judgment task. A dot lattice was shown for 300 ms and followed by the response probe, which lasted until participants reported an orientation. Once completing the visual discrimination task, a test array with only one Gabor patch was shown and participants responded whether its orientation had changed between the two displays. Also the test array lasted on the screen until participants provided a response.
28
Trials began with 500 ms of fixation point, followed by 800 ms presentation of the memory array, which could appear either in low-load or in high-load condition. To prevent for the retinal persistence of the memory array (e.g. Sligte et al. 2008), Gabor patches were followed by a 50 ms mask. The mask consisted in four two-dimensional squared sine-wave gratings of 3 dva with a noisy texture embedded in a Gaussian envelope. Each grating was superimposed on one of the Gabor patches of the memory array. Then, after 650 ms of blank screen, participants saw the dot lattice for 300 ms. After additional 300 ms blank screen, the response probe was displayed until response. The response probe consisted of four circles (response icons), each half-cut by a diameter parallel to one of the four possible orientations of the dot lattice (i.e. a, b, c or d). For each of the four orientations of the dot lattices, four different response probes were obtained by counterclockwise rotating the response icons to one of four possible locations on the screen (i.e. upper-left, lower-left, upper-right, lower-right, respectively). Participants reported the orientation of the dot lattice by pressing with the right hand one of four keys from the numerical keyboard (“4”, “1”, “5”, or “2”). These keys spatially corresponded to the locations of the response icons on the screen during each trial (i.e. “4” for top-left response icon, “1” for down-left response icon, “5” for top-right response icon, and “2” for down-right response icon). If participants did not perceive a prominent orientation in the dot lattice, they were asked to guess one. The visual discrimination report was followed by a 300 ms blank screen. Finally, the test array appeared and lasted until a response was provided. For the test array, only one of the four Gabor patches in the memory array was presented. Participants indicated whether the orientation between the test Gabor patch had changed between the two displays. In half of the trials, its orientation remained the same, whereas, in the other half, it was different. The new orientation was selected among the remaining three orientations, each of which occurring the same number of trials. Participants responded to
29
the test array with the keys “1” and “2” of the numerical keyboard. The association between keys and responses was counterbalanced across participants. Before the new trial, there was a 500 ms inter-trial interval. In order to familiarize with the whole procedure, before starting the experiment, participants completed 12 practice trials. At this stage, for each response icon, the corresponding key was printed on the screen. The practice trials were equal for all participants but presented in a random order. Participants could ask for more practice trials until they felt ready to proceed with the experiment. To avoid that participants exclusively focused on one task, our instructions emphasized that the change detection and the visual discrimination were equally important and that they had to perform both at their best.
The experiment consisted of 768 trials, divided into 8 blocks. Participants were allowed to do short breaks in-between the blocks. The number of high-load and low-load trials, as well as the number of trials for each AR and orientation of the dot lattices, was the same for each block. Within a block, the configuration of the memory array as well as the congruence between memory array and dot lattices was balanced for both high-load and low-load trials. The location of response icons were balanced between the blocks, and their order was randomized for each participant to prevent for an effect of the response probe configurations. The whole experiment lasted approximately 90 minutes.
30
2.3 Results
Based on the binomial distribution, we set the chance-level threshold for the change detection at 54% of correct responses. Six participants did not reach such threshold and were excluded from the analyses. In addition, one participant was excluded because of software errors during the experiment. This led to a final sample of 26 participants. This sample size was sufficient to obtain reliable estimates of the effects under investigation: sample computation using the software G-Power with the assumptions of medium effect sizes (𝜂𝑝2 = .08) and high statistic power (β = 0.9)
established that the minimum sample size required was 21 participants.
Since orientations along c and d were rarely reported (9.8% of total responses for c and 9.3% of total responses for d), we restricted our analyses to the trials reporting a and b responses.
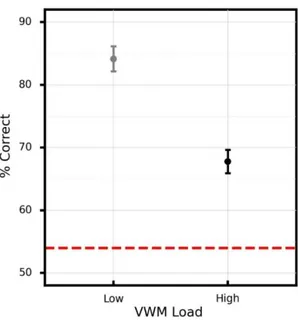
A preliminary check determined that no difference between the sample collected at KU Leuven and the one collected at Sapienza University of Rome emerged for both the change detection task and the perceptual judgment task. Thus, these subgroups were merged for all next analyses. We first compared the percentages of correct responses (accuracy) to the change detection task between the two VWM conditions (low vs. high). Mean accuracy was lower in high-load than in low-load condition (t(25) = -9.4, p < .001, 𝜂𝑝2 = .78), meaning that our manipulation of VWM load
31
Figure 2.4: Performance to the change detection task for the two VWM load conditions. Dots represent average percentages correct and bars represent standard errors. The red dashed line represents chance level accuracy .
For all next analyses, we used a within-subjects ANOVA with Greenhouse-Geisser correction (ε) of p-values when the sphericity of factors with more than one degree of freedom was violated and Bonferroni correction for post-hoc pairwise comparisons.
We checked for an orientation bias for vertical orientation using a 2x2 repeated-measures ANOVA on response probability using response type (a vs. b) and response orientation (vertical vs. horizontal) as factors (Figure 2.5). Similarly to the study of Nikolaev et al., 2016, we found higher probability of a than b responses (F(1,25) = 38.85, p < .001, 𝜂𝑝2 = .6) and higher probability of
vertical responses than horizontal ones (F(1,25) = 6.95, p < .05, 𝜂𝑝2 = .22). These findings are
32
Kubovy & Wagemans, 1995) and the existence of a bias for vertical orientation in the grouping of rectangular dot lattices (Bleumers et al., 2008; Claessens et al., 2008; Nikolaev et al., 2016).
Figure 2.5: The probability of a and b responses separated for vertical (V) and horizontal (H) response orientations. Dots represent average response probability and bars represent standard errors.
Based on these observations, we computed a proximity-based grouping index, P(a-b), by subtracting the proportions of a responses to the proportions of b responses (regardless of their orientation), and an orientation-based grouping index, V(v-h), by subtracting the proportions of vertical responses to the proportions of horizontal ones (regardless of a- or b type). These indexes were then used as dependent variables for further analyses. Notice that P(a-b) and V(v-h) are not mutually exclusive. Both indexes enhance when a vertical a is chosen. In this case, however, we cannot determine whether this occurs because it is the shortest distance or because it is the preferred orientation. Similarly, they both decreases if a horizontal b is chosen. Horizontal a and
33
vertical b have an opposite effect on these indexes. In former case, the enhancement of P(a-b) co-occurs with a decrease in V(v-h), and vice versa for the latter case. Thus, using the combination of both indexes, we can determine whether grouping in different conditions is mostly driven by proximity or by orientation bias. Specifically, if an increase in V(v-h) co-occurs to a decrease in P(a-b), this would reflect an increase of orientation-based grouping at the expense of proximity-based grouping. However, if both V(v-h) and P(a-b) increase, this implies a net shift from horizontal b responses to vertical a responses. If the VWM content is vertical, such a result may indicate a congruence effect. However, this does not necessarily imply an increase in orientation bias.
To test how VWM load affects grouping by proximity, we used a 2x3 ANOVA on the proximity-based grouping index P(a-b), with VWM load (low vs. high) and AR (1.0 vs. 1.1 vs. 1.2) as factors (Figure 2.6). In line with our predictions, we found P(a-b) to be higher in low-load than in high-load condition (F(1,25) = 14.08, p = .001, 𝜂𝑝2 = .36). Moreover, proximity-based grouping increased
as the dot lattices became less ambiguous (F(2,50) = 38.59, p < .001, 𝜂𝑝2 = .61, ε = .56), as expected
from the Pure Distance Law of grouping by proximity (Kubovy et al., 1998, Kubovy & Wagemans, 1995). We found an interaction between the two factors (F(2,50) = 7.8, p = .001, 𝜂𝑝2= .24). Pairwise
comparison showed that at AR = 1.0, P(a-b) was equal between low- and high-load conditions, whereas the difference between conditions emerged for AR = 1.1 and AR = 1.2, (t(25) = 4.09, p <
.001, 𝜂𝑝2 = .4 and t(25) = 4.13, p < .001, 𝜂𝑝2 = .4, respectively), This finding was not surprising,
since at AR = 1.0, no net preference for a over b responses is expected, so that the proximity index approaches to zero in both load conditions.
34
Figure 2.6: Proximity-based grouping indexes P(a-b) in two VWM load conditions for three levels of AR. Notice that when the AR is 1.0 (i.e. a = b), the two responses are equiprobable. As the stimuli become less ambiguous, proximity-based responses increase. Such increases are larger in the low-load condition than in the high-load condition. Dots represent average proximity index values and bars represent standard errors.
Same ANOVA over V(v-h) showed that preference for the vertical orientation increased in high-load condition with respect to low-high-load condition (F(1,25) = 6.79, p < .05, 𝜂𝑝2 = .21), and was higher
for more ambiguous dot lattices (F(2,50) = 7.98, p < .01, 𝜂𝑝2 = .24, ε = .72). No interaction between
35
Figure 2.7: Orientation bias V(v-h) in the two VWM conditions and for the three levels of AR. The preference for vertical orientation is higher in high-load condition, regardless of the dot lattices ambiguity. Dots represent average vertical preference and bars represent standard errors.
The overall opposite trends of P(a-b) and V(v-h) in the two VWM load conditions imply that they result from an increase in orientation-based grouping with memory load. However, some differences in P(a-b) and V(v-h) between conditions seem to emerge. In particular, we saw that proximity-based grouping is unaffected by VWM when AR = 1.0, whereas higher VWM load enhances orientation-based grouping indistinctly for all the levels of AR. Recall that at AR = 1.0, proximity-based grouping is defined both along a and b orientations, because the equivalence between a and b for these stimuli. Thus, this discrepancy does not prevent us from concluding that
36
VWM load is involved in the shift between proximity- and orientation-based grouping of dot lattices.
To investigate the role of VWM content, we ran separate ANOVAs on P(a-b) and V(v-h), taking the orientation of the memory arrays into account. Since the possible memory array orientations differed between low- and high-load conditions, we analyzed these two separately.
We ran a 3-way repeated-measures ANOVA on P(a-b) for low-load condition, with memory array orientation (vertical vs. horizontal), dot lattice orientation (vertical vs. horizontal) and AR (1.0 vs. 1.1 vs. 1.2) as factors (Figure 2.8). P(a-b) was higher for vertical dot lattices than for horizontal ones (F(1,25) = 5.1, p < .05, 𝜂𝑝2 = .17) and increased with the AR of the stimuli (F(2,50) = 34.34, p <
.001, 𝜂𝑝2 = .58, ε = .62). We found an interaction between memory array orientation and dot lattice orientation (F(1,25) = 16.64, p < .001, 𝜂𝑝2 = .4). For vertical dot lattices, P(a-b) was higher after
vertical memory arrays than after horizontal ones (t(25) = 3.48, p < .005, 𝜂𝑝2 = .32), whereas the
37
Figure 2.8: Proximity-based grouping index P(a-b) after vertical and horizontal memory arrays in the low-load condition. Proximity-based grouping is higher for vertical dot lattices after vertical memory arrays and for horizontal dot lattices after horizontal memory arrays. Dots represent average proximity-based grouping index and bars represent standard errors. Abbreviations: H: horizontal; V: vertical.
These results suggest a congruence effect promoted by VWM content. However, from Figure 2.8 it is evident that there is no difference in P(a-b) between vertical and horizontal dot lattices after horizontal memory arrays. In other words, the congruence effect observed for horizontal dot lattices would be due to vertical memory arrays increasing b responses, instead of an increase of a responses after horizontal VWM content. This is also evident for stimuli at AR = 1.0, which after
38
horizontal memory arrays approached zero, whereas after vertical memory arrays tuned towards vertical orientation.
This claim was confirmed by the same ANOVA performed on orientation-based response index V(v-h). We found the main effect of memory array orientation (F(1,25) = 16.64, p < .001, 𝜂𝑝2 = .4):
V(v-h) was higher overall with vertical than with horizontal memory arrays (Figure 2.9). This result shows that vertical memory arrays increased both a responses for vertical dot lattices and b responses for horizontal dot lattices. In other words, the preference for vertical orientation was strengthened for both dot lattice orientations after vertical memory arrays. This pattern was consistent across all the values of AR. This analysis also showed an interaction between AR and dot lattice orientation (F(2,50) = 34.34, p < .001, 𝜂𝑝2 = .58, ε = .62), meaning that at AR = 1.0, the
preference for vertical grouping was the same in vertical and horizontal dot lattices, whereas it diminished with AR for horizontal stimuli (t(25) = 5.65, p < .001, 𝜂𝑝2 = .56 and t(25) = 6.8, p < .001,
𝜂𝑝2 = .65; for AR = 1.1 and AR = 1.2, respectively). This trend implies an increase of a responses
with AR in both dot lattices orientation, whereas there was no difference between a and b responses at AR = 1.0, in line with what prospected by the Pure Distance Law (Kubovy et al., 1998).
39
Figure 2.9: Orientation-based grouping index V(v-h) after vertical and horizontal memory arrays in the low-load condition. Orientation-based grouping increases when vertical items are kept in VWM. Dots represent average vertical preference and bars represent standard errors. Abbreviations: H: horizontal; V: vertical.
For high-load condition, we performed a similar ANOVA as before on P(a-b), but now with three levels of memory array orientation (vertical vs. horizontal vs. mixed). This ANOVA kept the main effects of AR (F(2,50) = 35.35, p < .001, 𝜂𝑝2 = .59, ε = .58), dot lattice orientation (F(1,25) = 9.26, p <
.005, 𝜂𝑝2 = .27), and the interaction between memory array orientation and dot lattice orientation
(F(2,50) = 8.57, p < .001, 𝜂𝑝2 = .26). Proximity-based grouping for horizontal dot lattices was higher
40
= .28) memory arrays, as well as higher after mixed than after vertical ones (t(25) = 2.58, p < .05,
𝜂𝑝2 = .21). On the other hand, there was no difference in P(a-b) between the memory arrays for
vertical dot lattices (Figure 2.10).
Figure 2.10: Proximity-based grouping index P(a-b) after vertical and horizontal memory arrays in the high-load condition. Proximity-based grouping in vertical dot lattices does not depend on VWM content, whereas it is reduced for horizontal dot lattices after vertical memory arrays. Dots represent average proximity index and bars represent standard errors. Abbreviations: H: horizontal; M: mixed; V: vertical.
These results resemble the ones found for the low-load condition. Consistently to Figure 2.8, in Figure 2.10 the congruence effect for horizontal dot lattices is attributable to the effect of vertical
41
memory arrays, favoring vertical b over horizontal a responses. The main contrast with the low-load condition is the absence of memory array effects for vertical dot lattices.
Again, the pattern observed for P(a-b) was confirmed by the same ANOVA as before, using V(v-h) as dependent variable (Figure 2.11). As can be observed in Figure 2.9, the ANOVA reproduced a main effect of memory array orientation (F(2,50) = 8.94, p < .005, 𝜂𝑝2 = .26, ε = .63) and an
interaction between AR and dot lattice orientation (F(2,50) = 35.64, p < .001, 𝜂𝑝2 = .59). Vertical and
mixed memory arrays produced a larger number of vertical responses than horizontal ones (t(25) =
3.22, p < .05, 𝜂𝑝2 = .29 and t
(25) = 2.96, p < .05, 𝜂𝑝2 = .26, respectively). We found an interaction
between memory array orientation and dot lattice orientation (F(2,50) = 3.6, p < .05, 𝜂𝑝2 = .13). In
horizontal dot lattices, orientation-based grouping increased after vertical memory arrays relative to horizontal (t(25) = 3.44, p < .01, 𝜂𝑝2 = .32) and mixed (t(25) = 2.58, p < .05, 𝜂𝑝2 = .21) ones, and
following mixed memory arrays relative to horizontal ones (t(25) = 3.13, p < .05, 𝜂𝑝2 = .28). This
further supports the finding that orientation-based grouping increases for horizontal dot lattices after vertical VWM content. As previously seen for P(a-b), V(v-h) for vertical dot-lattices was unaffected by memory array orientation. Such an interaction was not observed in the corresponding analysis for low-load condition, where both vertical and horizontal dot lattices showed a generalized enhancement of V(v-h) after vertical memory arrays.
42
Figure 2.11: Orientation-based grouping index V(v-h) after vertical and horizontal memory arrays in the high-load condition. Orientation-based grouping in vertical dot lattices is unaffected VWM content, whereas it increases for horizontal dot lattices after vertical memory arrays. Dots represent average proximity index and bars represent standard errors. Abbreviations: H: horizontal; M: mixed; V: vertical.
Taken together, these analyses suggest that both P(a-b) and V(v-h) are highly sensitive to vertical VWM content. In other words, when VWM content is consistent with the orientation bias, we find a higher tendency for orientation-based grouping of the dot lattices. When the stimuli are actually vertical, this manifests as enhanced a responses, whereas when they are horizontal this manifests as enhanced b responses. This produces a congruence effect in perceiving both vertical and
43
horizontal dot lattices, which, however, is asymmetric. This is clearly evident in Figure 2.8, where horizontal VWM content leaves proximity-based responses between horizontal and vertical dot lattices invariant. This effect seems to dissipate in the high-load condition when vertical dot lattices are presented. In this case, therefore, vertical VWM content would not promote vertical a responses, compared to horizontal and mixed VWM contents. This can be considered a ceiling effect due to the higher presence of orientation bias in this condition, which equates vertical responses among the different types of VWM contents.
Overall, the results of this study are in line with the hypothesis that proximity-based grouping depends, at least in part, on VWM top-down modulation on lower level perceptual areas. When high VWM load prevents this modulation, or when VWM content matches with the biased orientation, the perceptual system is more likely to group the dots in accordance to the orientation bias. This enhancement in preference for vertical orientation is accompanied by a drop in proximity-based grouping. Thus, both VWM load and content shape how the grouping process in dot lattices unfolds. To address this complex pattern of results within a unitary and coherent framework, we propose and evaluate a model of the role of VWM in perceptual grouping.
2.4 VWM Gating of Perceptual Grouping
The effect of VWM load on grouping are consistent with studies suggesting that VWM promotes for the active maintenance of intermediate representations of percepts (proto-representations) until visual processing is completed (Gao, Gao et al., 2011; Gao, Ding et al., 2013; Roelfsema, 2005). In our case, such proto-representation may underlie to the proximity organization of the dot lattices. This mechanism would be refined by VWM content, which would promote
proximity-44
based grouping at the expense of orientation-based grouping when it is inconsistent with biased orientation.
Based on our observations, we suggest that whether grouping in dot lattices is proximity- or orientation-based depends on the competition between the orientation bias and the proximity proto-representation of the stimulus. In high-load condition, given the smaller amount of VWM capacity available to maintain proximity proto-representations, these would be weaker than in the low-load condition. This weakening would render the perceptual system more subjected to the orientation bias. The role of VWM content would be to gate which one amongst proto-representation and orientation bias gets to determine grouping. Specifically, when consistent with orientation bias (i.e. it is vertical), the content promotes orientation-based grouping, whereas when it is inconsistent (i.e. it is horizontal), it promotes proximity-based grouping.
To evaluate this hypothesis, we ran separate additive linear models for the low- and high-load conditions, using P(a-b) and V(v-h) as criteria and the following conditions as categorical predictors1:
- V_h: VWM content is vertical and the proto-representation is horizontal; - V_v: VWM content is vertical and the proto-representation is vertical; - H_h: VWM content is horizontal and the proto-representation is horizontal; - H_v: VWM content is horizontal and the proto-representation is vertical.
The regression model for low-load condition on P(a-b) was significant (F(3,100) = 7.65, p < .001,
R2 = .19). For the single comparisons, we used H_h as the control condition. P(a-b) decreased in