DISI -‐ Via Sommarive 5 -‐ 38123 Povo -‐ Trento (Italy)
http://disi.unitn.it
MULTI-DEVICE ACTIVITY
LOGGING
Mattia Zeni, Ilya Zaihrayeu and Fausto
Giunchiglia
2014-July
Multi-device Activity Logging
Mattia Zeni, Ilya Zaihrayeu and Fausto Giunchiglia Department of Information Engineering and Computer Science, University of Trento, via Sommarive 14 I-38123, Povo, Trento, Italy{mattia.zeni, ilya and fausto}@disi.unitn.it
Abstract. In this paper we are presenting i-Log, a system which is able to collect
user’s personal information, generate streams of data from smartphone’s integrated sensors and attached wearable devices. We decided to focus our attention on these general purpose devices as we believe they can generate truthful readings because of their easy integration with our day-life activities, while invasive dedicated logging devices can alter our normal routines. The system consists of a Mobile Application that collects sensor data from the smartphone and from additional external wearable devices through a Bluetooth connection. We designed it to be user friendly, transparent, unobtrusive and able to provide smart sensing strategies in order to preserve battery life. Moreover, i-Log has a back-end server that accepts streams of data from the application and stores them into a persistent storage system that can be queried for further real time analysis.
Keywords: Logging; Sensing; Sensor Streams; Smartphone; Smartwatch; Wearable
1 Introduction
Nowadays society is moving towards an ecosystem in which electronic devices are everywhere and permit to collect an incredible amount of data from a multitude of sensors. Among these devices, the most important from a time consuming point of view is the smartphone. Smartphones diffusion has reached extraordinary numbers, with a penetration rate of 56% worldwide1, up to 97% in the range
18-292. In addition, they are able to deliver advanced mobile applications, capable of supporting users’ daily activities. According to Ericsson ConsumerLab3, people are increasingly interacting with
their smartphones and the internet in many different daily situations. To support this trend, there’s also the fact that devices are becoming every year more compact, light, powerful with an increasing number of sensors, such as GPS, accelerometers and gyroscope, among others. Recently, smartphones are being integrated with additional external devices, such as wearables. Statistics says that in the following 5 years, wearable market share will grow up by 5 times4. We believe that the
combination of smartphones plus wearables can add useful contributions to the field of activity recognition as they can collect truthful user’s personal information not limited by a constrained testing and sensing environment.
In this Demo Paper, we are presenting i-Log, a system able to collect personal information from users’ smartphones and additional wearables. At the moment of writing this paper, our application can leverage on 21 streams of data, 18 from the smartphone and 3 from the wearable device we used for our tests. In a day of logging at the fastest speed, without any smart sensing technique, the system can log 100 million sensor values for a total of 6 GB.
Recently, in the field of activity recognition, the research community is addressing the problem of collecting information from general purpose devices such as smartphones, instead of using dedicated external sensors in order to remove the constraints of a controlled experiment. For example, [2] presents a method for activity recognition using accelerometer data collected from a smartphone. In particular, their method works independently on the position of the phone on the user’s body. In [1], smartphone collected data are used for activity recognition in a healthcare scenario. In [4], the authors use smartphone’s accelerometer for patient monitoring.
2 System Design
As shown in Fig. 1, i-Log system consists of two main components: (1) a front-end part that collects data from user’s smartphone and wearable devices and a (2) back-end server that stores sensor streams to allow further analysis.
1 http://supermonitoring.com/ 2 http://www.compendium.com/
3 http://www.ericsson.com/thinkingahead/consumerlab
PERSISTENCE SYSTEM (CASSANDRA)
INPUT ENGINE QUERY ENGINE
BACK-END FRONT-END
Figure 1. i-Log System Architecture
Front-end
The front-end component of our system is a mobile application designed for Android devices (screenshots in Fig. 2, 3 and 4) which is able to log sensor data and generate timestamped streams. Information is collected directly from both physical and virtual sensors. For the virtual sensor we mean a software algorithm able to produce a data stream, like a physical sensor. In order to give some examples, it can be a ”social virtual sensor” aimed at collecting information about the people surrounding the user by capturing others devices in range through Bluetooth; or an ”audio virtual sensor” able to extract audio features in real time from the microphone. Physical sensors are those installed on Samsung Galaxy S4 smartphone and Samsung Galaxy Gear smartwatch: accelerometer, gyroscope, microphone on both devices and thermometer, GPS, gravity, magnetic field, orientation, proximity, light, pressure and humidity detectors only on the smartphone. The application has been designed to be as unobtrusive and transparent to the final user as possible. In fact, once the user starts it and manually enables the logging mode, the application keeps running in the background as an Android Service, without interfering with the use of core phone features. It is common knowledge that smartphones are limited in terms of resources, in particular in hard drive capacity and CPU. Recently, some models can provide up to 64GB of memory, but since our application can generate a lot of data in a reduced amount of time, we implemented smart management strategies. In particular, data are stored in an internal SQL persistence system and are periodically uploaded to the back-end server, and the memory on the phone is released. Different strategies can be chosen according to user preferences: for example, data streams can be synchronized in real-time to the server (useful for live applications), or when the phone is plugged to a charger and the screen is turned off, among others. Moreover, we implemented different logging strategies: the user can enable logging for single sensors, for some or for all of them, depending on the results he wants to obtain. We also provided the application with smart logging strategies, that can log from different sensors according to different variables. For example, speaking of the user location, it can be obtained in 3 ways on a smartphone: (1) from the GPS with high accuracy, (2) from WIFI with less accuracy but with less battery consumption and (3) with cellular network triangulation with very poor accuracy. When smart sensing is enabled, the location is normally captured by the GPS, but if a WIFI signal is detected, the GPS is turned off. This is done to preserve battery life, since GPS is one of the most battery-consuming elements on the phone. External multiple wearable devices are supported by our system, which collects their data through a Bluetooth connection and generates time-stamped streams that are stored in the internal database, one for each sensor. For our tests we used a Samsung Galaxy S4 smartphone and a Samsung Galaxy Gear smartwatch, but this application works with any Android-based smartphones and wearable devices.
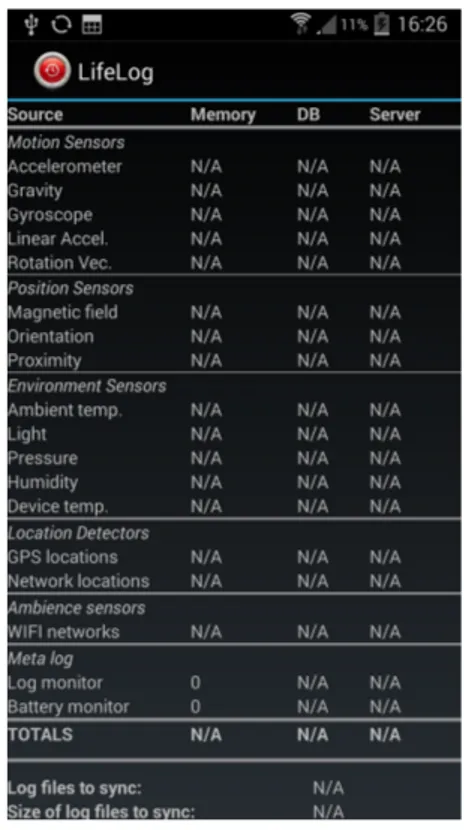
Figure 2. i-log for Smartphone Figure 3. i-log log summary
Figure 4. i-log for Smartwatch
Back-end
The back-end server consists of a persistence system based on Cassandra5that stores data sent by the
front-end application. We designed a tool for accepting REST POST requests from the client, that sends sensor streams in the JSON format. The system has been designed to be scalable, because of the amount of data and the speed at which they are generated are huge. Moreover, we designed a query system that permits to interrogate the db for further analysis. As a first version of the back-end
5
we used the system presented in [3] from which we took inspiration and that we have now redone using Cassandra.
3 User Experience
With the information collected by i-Log we want to infer the context in which the user is involved, in order to create a new framework for activity recognition designed to the supply of services. We agree with [5], that affirms that machines have to be aware of the context in order to identify and interpret human behavior and react accordingly. Our context is composed by several dimensions: (1) a location, (2) a time frame and (3) a social dimension. With these three components we believe we can infer most of the possible context in which the user is involved. The most important is location in combination with the time frame, because depending on where the user is at what time, and accordingly with his daily routine, the list of possible performed activities can be drastically reduced and, therefore, the overall recognition accuracy will increase. Moreover, having information about the people surrounding the user, through Bluetooth logging and/or audio analysis, we can add additional useful information to the context. For example, if we know that we are in a building where we stayed for the last year every day from Monday to Friday during the normal working hours and we additionally know that we are surrounded by our colleagues, then it is probable that we are in the working place, in a meeting since we are not moving and someone is talking. This is a very simple example of our idea of context that is a critical aspect of a new activity recognition framework we want to build.
4 Conclusion and Future Works
The final goal of this project is to create a system for collecting personal user information that can be used for activity recognition. We decided to use general purpose devices in order to remove the constraints of a controlled environment typical for experiments in the field of activity recognition. We can successfully and in an efficient way collect 21 streams of data, for 100 million collected values, resulting in 6 GB per day, ranging from accelerometer data to temperature, audio and others. Next steps will be to further improve the application performance, in particular in terms of battery life, using even smarter logging strategies and sensor fusion techniques, enabled according to high level information provided by a semantic model, a representation of the world and the relations among its objects.
5 Acknowledgements
This work has been supported by the SmartSociety (
http://www.smart-society-project.eu
) EU FP7 project.
References
[1] Altakouri, B., Kortuem, G., Grunerbl, A., Kunze, K., and Lukowicz, P. The benefit of activity recognition for mobile phone based nursing documentation: A wizard-of-oz study. In Wearable Computers (ISWC), 2010 International Symposium on (Oct 2010), 1–4.
[2] Khan, A., Lee, Y. K., Lee, S., and Kim, T. S. Human activity recognition via an accelerometer-enabled-smartphone using kernel discriminant analysis. In Future Information Technology (FutureTech), 2010 5th International Conference on (May 2010), 1–6.
[3] Kim, P. H., and Giunchiglia, F. The open platform for personal lifelogging: the elifelog architecture. In CHI’13 Extended Abstracts on Human Factors in Computing Systems, ACM (2013), 1677–1682.
[4] Lau, S. L., Konig, I., David, K., Parandian, B., Carius-Dussel, C., and Schultz, M. Supporting patient monitoring using activity recognition with a smartphone. In Wireless Communication Systems (ISWCS), 2010 7th International Symposium on (Sept 2010), 810–814.
[5] Pentland, A. Looking at people: sensing for ubiquitous and wearable computing. Pattern Analysis and Machine Intelligence, IEEE Transactions on 22, 1 (Jan 2000), 107–119.