2016
Publication Year
2020-06-25T13:47:10Z
Acceptance in OA@INAF
3C 279 IN OUTBURST IN 2015 JUNE: A BROADBAND SED STUDY BASED ON
THEINTEGRALDETECTION
Title
BOTTACINI, EUGENIO; Böttcher, Markus; PIAN, Elena; Collmar, Werner
Authors
10.3847/0004-637X/832/1/17
DOI
http://hdl.handle.net/20.500.12386/26209
Handle
THE ASTROPHYSICAL JOURNAL
Journal
832
3C 279 IN OUTBURST IN 2015 JUNE: A BROADBAND SED STUDY
BASED ON THE INTEGRAL DETECTION
Eugenio Bottacini1,2, Markus Böttcher3, Elena Pian4,5,6, and Werner Collmar7
1
W.W. Hansen Experimental Physics Laboratory & Kavli Institute for Particle Astrophysics and Cosmology, Stanford University, USA;[email protected]
2
Dipartimento di Fisica e Astronomia“G. Galilei”, Università di Padova, I-35131 Padova, Italy
3
Centre for Space Research, North-West University, Potchefstroom 2531, South Africa
4INAF, Istituto di Astrofisica Spaziale e Fisica Cosmica, via P. Gobetti 101, I-40129 Bologna, Italy 5
Scuola Normale Superiore, Piazza dei Cavalieri 7, I-56122 Pisa Italy
6
INFN, Sezione di Pisa, Largo Pontecorvo 3, I-56127 Pisa, Italy
7
Max-Planck-Institut für extraterrestrische Physik, Giessenbach, D-85748 Garching, Germany Received 2016 April 14; revised 2016 September 9; accepted 2016 September 12; published 2016 November 11
ABSTRACT
Blazars radiate from radio through gamma-ray frequencies and thereby make ideal targets for multifrequency studies. Such studies allow the properties of the emitting jet to be constrained. 3C279 is among the most notable blazars and therefore subject to extensive multifrequency campaigns. We report the results of a campaign ranging from near-IR to gamma-ray energies that targeted an outburst of 3C279 in 2015 June. The campaign pivots around the detection in only 50 ks by INTEGRAL, whose IBIS/ISGRI data pin down the high-energy component of the spectral energy distribution(SED) between Swift-XRT data and Fermi-LAT data. The overall SED from near-IR to gamma rays can be well represented by either a leptonic or a lepto-hadronic radiation transfer model. Even though the data are equally well represented by the two models, their inferred parameters challenge the physical conditions in the jet. In fact, the leptonic model requires parameters with a magnetic field far below equipartition with the relativistic particle energy density. In contrast, equipartition may be achieved with the lepto-hadronic model, although this implies an extreme total jet power close to the Eddington luminosity.
Key words: accretion, accretion disks – galaxies: individual (3C 279) – galaxies: jets – radiation mechanisms: non-thermal– X-rays: galaxies
1. INTRODUCTION
Blazars are radio-loud, jet-dominated active galactic nuclei (AGNs) with their jets closely aligned with the line of sight to the observer. Due to this geometric arrangement, their emission is strongly Doppler-enhanced. Consequently, they are bright sources from radio wavelengths to gamma-ray energies and allow for detailed multifrequency studies. Precise modeling of the multiwavelength emission allows us to constrain the physical properties of the emitting source. However, the emission from blazars is known to be variable on various timescales (Aharonian et al. 2007; Albert et al. 2007).
Therefore, for a meaningful interpretation of these properties and emission mechanisms, the observations need to be at least quasi-simultaneous and to cover a wide range of frequencies. Such a detailed multifrequency campaign was carried out on the prominent blazar 3C279. The campaign pivots around its detection by the INTEGRAL mission during an outburst in 2015 June. This outburst exhibited the source’s brightest flare ever observed at GeV energies (Cutini2015; Lucarelli et al.2015; Paliya 2015). 3C279, at redshift z=0.5362 (Marziani et al. 1996), is among the most luminous and variable extragalactic
objects and gained prominence due to its bright flaring state detected by the Energetic Gamma Ray Experiment Telescope at the beginning of the Compton Gamma-Ray Observatory’s mission(Hartman et al.1992), and it was the first (of currently
onlyfive) flat-spectrum radio quasar detected by ground-based atmospheric Cerenkov telescope facilities in very-high-energy (VHE: E > 100 GeV) gamma rays (Albert et al. 2008; Mirzoyan 2015). An interesting finding regarding 3C279 is
the change in the optical polarization angle following a
gamma-rayflare (Abdo et al.2010) that was seen also in a number of
other blazars, as shown in a recent study by Kiehlmann et al. (2016). Therefore, this intriguing source is subject to extensive
monitoring programs revealing low-activity and high-activity states. In a low-activity state, the modeling of the broadband spectral energy distribution (SED) at X-ray energies is quite satisfactory(e.g., Collmar et al.2010), while in some cases in a
high-activity state of the source the same modeling is challenging(e.g., Hayashida et al.2015).
In this work, we report the detection in the hard X-ray band of an outburst of 3C279 around which a multifrequency campaign is centered. First, we detail the multifrequency campaign, followed by the compilation of the broadband SED and its modeling.
2. OBSERVATIONS AND DATA ANALYSES OF 3C279 2.1. X-Ray Observations
INTEGRAL—A monitoring campaign on 3C279 was performed by the INTEGRAL mission during its extragalactic survey program on the Coma sky area. While surveying the sky, astrophysical sources are monitored by INTEGRALʼs instruments because of their wide field of view (FOV). This approach of monitoring has provided excellent opportunities for single-source studies(e.g., Bottacini et al.2010). During the
Coma survey observations in 2015 June, INTEGRAL detected 3C279 (Bottacini et al. 2015) with its imager IBIS (Ubertini
et al. 2003) using the ISGRI detector (Lebrun et al. 2003).
This is IBIS’s low-energy detector sensitive to photons of 15–1000 keV and having a FOV of 29×29 deg2. IBIS/ISGRI
data from this observation are analyzed with the latest version 10.2 of the standard Off-line Scientific Analysis software8 provided by the INTEGRAL Science Data Centre (Courvoisier et al. 2003) using the method described in Bottacini et al.
(2012). With this software we analyze the INTEGRAL data set
of revolution 1553 that comprised 15 Science Windows, each of which corresponds to a∼3500 s pointed observation. These add up to a total exposure time of ∼50 ks. Only one Science Window (155300040010) has a much shorter exposure of ∼500 s. The quality of this single observation is comparable to all the other Science Windows. The id numbers of the analyzed Science Windows run from 155300040010 (2015 June 15 15:46 UTC) to 155300170020 (2015 June 16 05:13 UTC) and account for pointed observations only. In the resulting mosaic sky image, thanks to its wide FOV, IBIS/ISGRI is able to detect 3C279 even at a far off-axis angle (14°) with respect to the center of the dither pattern at 5.7σ in the energy range 18–55 keV at a constant flux level. The source spectrum in the energy range 20–100 keV can be fit with a flux-pegged power-law model pegpwrlw of XSPEC (Arnaud 1996), which
allows for normalization by totalflux, with a spectral index of 1.080.15
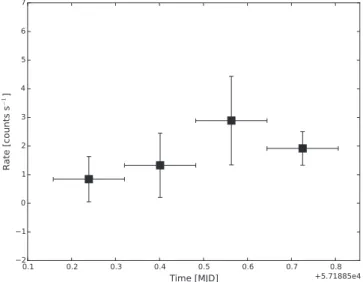
1.98. The result is reported in Table1. A timing analysis of
this INTEGRAL observation shows a rather constant flux displayed in the light curve of Figure1. Unfortunately, because the center of the dither pattern of this INTEGRAL survey on the Coma region is at a large angular distance from 3C279, the smaller FOV of JEM-X and OMC did not allow for an observational coverage of the source at X-ray and optical frequencies, respectively. Moreover, we have analyzed IBIS/ ISGRI data of INTEGRAL revolution 1545 including Science Windows from 154500300010 (2015 May 26 04:16 UTC) to 154500470010(2015 May 26 23:13 UTC), which did not yield a detection of 3C279. However, the non-detection is used in the discussion in Section4.
Swift-XRT—During the INTEGRAL monitoring of 3C279, the source was observed nearly simultaneously by Swift-XRT in photon counting mode on 2015 June 15 14:27 UTC(obs id: 00035019176). The observation log is reported in Table1. Data analysis is performed using xrtproducts and HEAsoft 6.17. In agreement with the very timely analysis by Pittori et al. (2015a), we find the spectrum to be affected by pile-up. To
correct for this effect we extract the spectrum from an annular region (rather than from a circular region) that excludes the central circlular area of 2 pixels radius. The outer radius of the annulus is 30 pixels and the background is extracted from a source-free circular region of 50 pixels(each pixel corresponds to ∼2 36, Moretti et al. 2004). The background spectrum
accounts for less than 1% of the total net count rate. We generated the ancillary response file with xrtmkarf and we
used the response matrix of swxpc0to12s6_20130101v014. rmf.9 To confidently use the chi-square statistic for spectral fitting, we bin the data to at least 20 counts bin−1. The spectrum
is fitted in the energy range 0.6–6.0 keV. The baseline fit model is a power law with neutral hydrogen absorption (wabs∗powerlaw) fixed to the Galactic value, which is
NHgal=2.2×10²⁰atoms cm–2obtained from the LAB Survey of Galactic HIdatabase(Kalberla et al.2005). We do not find
any evidence for excess absorption or for more sophisticated models. The fit results and derived values, which are in agreement with the analysis by Pittori et al. (2015a), are
reported in Table 1. No significant variability within this observation is found (see the light curve in Figure 2).
Additionally, we have analyzed Swift-XRT observation 00092194008 (2015 May 26 09:20 UTC), which is used in the discussion in Section4.
2.2. UV to Near-IR Observations
Swift-UVOT—Simultaneously with the INTEGRAL and Swift-XRT observations, the UV–Optical Telescope (UVOT, Roming et al. 2005) on board the Swift satellite observed
3C279 with its filter of the day, which was the U filter. We use the standard pipeline products, which are co-added and corrected for exposure. The standard 5′ aperture is used for photometry. The resulting magnitude is U=14.92 (±0.03), which is in agreement with the detailed analysis in Pittori et al. Table 1
3C279: Hard X-Ray and X-Ray Spectral Fits
Observation Start Exposure Model Γ Norm Chi-square dof Flux (Inst. obs. id) (date UTC) (s) (10−11erg cm−2s−1)
IBIS 12200240002 2015 Jun 15 15:46:00 50000 pegpwrlw 1.080.151.98 1.621.092.16 4.79 5 7.8310.455.57
XRT 00035019176 2015 Jun 15 14:27:58 1995 abs*powerlaw 1.371.301.44 5.84 5.48
6.20 32.22 35 2.27 2.19 2.37
XRT 00092194008 2015 May 26 09:20:59 1115 abs*powerlaw 1.851.991.71 3.352.993.69 14.33 19 0.7030.6400.705
Note. Normalization: IBIS/ISGRI in units of 1010
ergcm−2s−1in the 20–100 keV band; Swift-XRT in units of 10−3photonskeV−1cm−2s−1. Fluxes: IBIS/ISGRI
flux is given in the 18–55 keV band; Swift-XRT flux is computed in the 2–6 keV band. Errors are reported at 1σ level.
Figure 1. IBIS/ISGRI light curve of 3C 279 binned to 12.5 ks.
8
http://www.isdc.unige.ch/integral/analysis#Software
9 http://heasarc.gsfc.nasa.gov/docs/heasarc/caldb/data/swift/xrt/
index.html
(2015b). To convert magnitudes to fluxes we use the constants
of the photometric system in Poole et al.(2008).
SMARTS—The blazar 3C279 is part of an extensive monitoring program run by Yale University with the Small and Moderate Aperture Research Telescope System (SMARTS). During the INTEGRAL monitoring, SMARTS has been monitoring the source quasi-simultaneously. Data reduction and analysis are detailed in Bonning et al. (2012).
Observations are performed in the optical and near-IR bands B, V, R, J, and K (see Table 2). Similarly to a precise study by
Larionov et al. (2008), we convert magnitudes to fluxes using
the constants from Mead et al. (1990).
Correction for the effect of interstellar extinction of data collected by Swift-UVOT and SMARTS is presented in Section 3.
2.3. Gamma-ray Observations
Simultaneously with the INTEGRAL observations, 3C279 was also observed at MeV and GeV gamma-ray energies. The detection by the Italian AGILE mission (Tavani et al. 2008) is
detailed in Lucarelli et al. (2015), and the Fermi gamma-ray
mission has detected 3C279 (Cutini 2015) simultaneously
with INTEGRAL at GeV energies with its Large Area Telescope (LAT; Atwood et al. 2009). A prompt analysis of
this detection of 3C279 was performed in a precise time-resolved spectral study by Paliya(2015). From this study, we
take the LAT spectral results for the time window that is contemporaneous with the IBIS/ISGRI observations and that shows resolved variability on a 6 hr timescale.
3. SED AND ITS MODELING
Even though the line of sight to the source is hardly affected by extinction because of its position at high Galactic latitude, we correct for this attenuation in the near-IR, optical, and UV bands (i.e., SMARTS and UVOT data). We compute the extinction with Cardelli’s law (Cardelli et al. 1989) with a
reddening coefficient of RV=3.1 and an extinction coefficient in the V band of AV=0.095 (Schlegel et al.1998).
The SED of 3C279 displays the two broad non-thermal radiation components characteristic of blazars. The low-energy component is well understood as being due to synchrotron
emission by relativistic electrons (possibly also positrons) in the jet, while the high-energy component can be either due to Compton scattering by the same relativistic electrons(leptonic processes) or due to proton-synchrotron radiation and synchro-tron emission from secondaries produced in photo-pion interactions (hadronic processes). The peak position of the high-energy component is well constrained by the LAT data: the best-fit log-parabola spectrum having a spectral index α=2.05 (±0.05) indicates that the peak of the SED is at νHE
3×10²² Hz (Paliya 2015). The onset of the high-energy
component is constrained by the Swift-XRT data. The onset and the peak of the high-energy component are bridged by the IBIS/ISGRI data. At low energies, the synchrotron component is constrained by the Swift-UVOT and SMARTS data, placing its peak at frequencies belowνsy 10
14
Hz.
To model the overall SED, we adopt the two complementary approaches mentioned above: a leptonic and a hadronic model. Their time-independent homogeneous one-zone jet radiation transfer is used as described in detail in Böttcher et al.(2013),
building upon the earlier work of Böttcher et al. (1997) and
Böttcher & Chiang(2002). In both models, a spherical (in the
comoving frame) emission region of radius R moves with bulk Lorentz factorΓ (corresponding to a speed of βΓc) within an angle θobs that determines the Doppler factor
( [ ])
d= G 1 -bGcosqobs -1. The emitting volume is pervaded
by a randomly oriented magnetic field of strength B and it is subject to injection of relativistic leptons (and protons, in the case of a hadronic model) with a comoving power-law distribution in particle energies(i = e, p for electrons/positrons and protons, respectively):
( ) ( ) [ ] ( ) g = g- - - g g g Q ;t Q t cm s for , 1 i i i q i i i inj ,0 inj 3 1 ,1 ,2
which may be thought of as the result of an unspecified, rapid acceleration mechanism, such asfirst-order Fermi acceleration at a shock traveling through the jet.
In the leptonic model, the electron cooling is driven by synchrotron and inverse-Compton emission. For the latter the code accounts for synchrotron self-Compton (SSC) and external radiation fields from the accretion disk (EC-disk) known to be present in this source (e.g., Pian et al. 1999; Hartman et al. 2001) and an isotropic external radiation field,
which represents the emission from the broad-line region(BLR —EC-BLR) or an infrared-emitting dust torus (EC-DT). A detailed description can be found in Böttcher et al.(2013). The
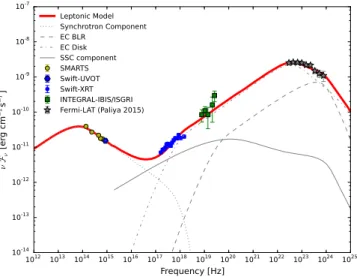
solution for the equilibrium state between particle injection, cooling, and escape from the spherical volume is self-consistently computed. The result is illustrated by the red solid curve in Figure 3, and the model parameters are reported in Table 3. In this model, the Swift-XRT X-ray emission is Figure 2. Swift-XRT light curve of 3C 279 binned to ∼300 s.
Table 2 UV to Near-IR Observations
Instrument Start Filter Mag. Mag. Error (UTC) SMARTS 2015 Jun 15 23:15:24 B 15.706 0.004 SMARTS 2015 Jun 15 23:19:21 V 15.187 0.004 SMARTS 2015 Jun 15 23:22:24 R 14.662 0.004 SMARTS 2015 Jun 15 23:15:20 J 12.903 0.005 SMARTS 2015 Jun 15 23:19:18 K 10.651 0.003 UVOT 2015 Jun 15 14:32:11 U 14.92 0.03
produced by a combination of SSC and EC-disk emission. The observational evidence for the existence of this latter comp-onent in the X-ray regime of 3C279 has been set forth in an early multifrequency study of 3C279 by Pian et al. (1999).
Even though in that work the source was in a low-activity state, the same EC-disk component alone might dominate the hard X-ray emission in the INTEGRAL regime. The Fermi-LAT spectrum is a combination of the EC-disk radiation dominating at lower energies and the EC-BLR emission dominating above a few GeV. The slope of the injected electron distribution of 3 can plausibly be obtained, e.g., in diffuse shock acceleration at oblique relativistic shocks (e.g., Summerlin & Baring 2012).
The photon energy densities due to the accretion disk and of the isotropic external radiationfield in the stationary rest frame of the AGN are 4.9 erg cm−3 and 3.0×10⁻³erg cm−3, respec-tively. The inferred location of the emitting region is 0.011 pc from the supermassive black hole. The resulting power in Poynting flux obtained from a magnetic field B=1 G is LB=2.0×1044 erg s−1 and the kinetic power carried in
relativistic electrons is Le=2.1×1045erg s−1. This
corre-sponds to a magnetization parameter of
BºLB Le=0.095, indicating that the emission region is dominated by kinetic energy by a factor of ∼10. These modeling results are underpinned by the observationally well constrained accretion disk and BLR parameters.In the lepto-hadronic model, in addition to the leptonic processes described above, the contribution of ultrarelativistic protons to the radiative output is accounted for. The protons are subject to synchrotron radiation and photo-pion production. As hadronic models require significantly higher magnetic fields (typically of order ∼100 G) than leptonic ones, electron cooling is strongly dominated by synchrotron emission, and the dominant target photon field for photo-pion production by the relativistic protons is the comoving synchrotron radiation of the primary electrons with a photon energy density
¢ = ´ -
-usyn 2.5 10 2erg cm 3, which can be compared with the energy density of the magnetic field, ¢ =uB 570 erg cm-3. The assumed dominance of the synchrotron emission over the
external radiation photon field places the emitting region necessarily outside the BLR to satisfy the requirement of
¢ > G ´
usyn 2 uext. The equilibrium particle (electron/positron
and proton) spectra and the radiative outputs are calculated self-consistently, as described in Böttcher et al. (2013). The
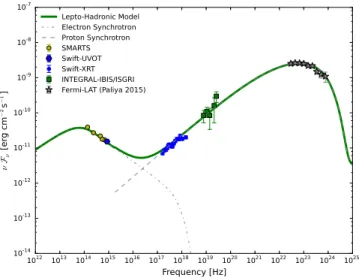
result is shown by the green solid curve in Figure 4, and the model parameters are listed in Table3. In the lepto-hadronic model, the entire X-ray through gamma-ray emission is strongly dominated by proton-synchrotron radiation, with a negligible contribution from photo-pion-induced processes. The model requires a magnetic field of B=100G, corresp-onding to a power carried in Poyntingflux of LB=1.5×1048 ergs−1, compared with a power carried in relativistic protons of Lp=1.6×10
48
ergs−1 and in relativistic leptons of Le=1.9×1042 ergs−1. It is obvious that the kinetic energy
in the jet is strongly dominated by the relativistic protons, and the magnetization parameter, i.e., the ratio of magnetic-field energy to kinetic energy carried in the jet, isòB≈LB/Lp=0.9. This indicates that in this model, kinetic and magnetic energy are significantly closer to equipartition than in the case of our leptonic model. Additionally, for the external radiationfield to be negligible, the emission region has to be located outside the BLR, which will also allow for potential VHE gamma-ray emission to escape unattenuated. Figures3and4illustrate that both (leptonic and lepto-hadronic) models are able to almost indistinguishably represent the SED data, and both models are able to reproduce the spectral curvature seen in the Fermi-LAT gamma-ray spectrum well. However, the lepto-hadronic model requires a very hard spectral index of the proton spectrum of 1.8, which may be difficult to realize in nature. It is furthermore subject to the well-known extreme power requirements of lepto-hadronic models of blazars (e.g., Böttcher et al. 2013; Diltz et al. 2015; Petropoulou & Dimitrakoudis2015), which
may be incompatible with our current understanding of jet launching mechanisms (Zdziarski & Böttcher 2015).
Specifi-cally, our model requires a total jet power of Ljet≈3.1×1048
ergs−1, which is almost exactly equal to the Eddington luminosity of the 2.5×10⁸Meblack hole powering the AGN
in 3C279. This finding regarding the total jet power is strengthened by the equipartition condition known to be close to the minimal energy requirement.
4. DISCUSSION
The active state of 3C279 in 2015 June allowed for a 5.7σ detection with IBIS/ISGRI in only ∼50 ks of observations. This can be compared with a quiescent state, in which IBIS/ ISGRI needs an exposure ∼10 times longer (∼500 ks) for a 7.5σ detection as shown in a multifrequency study by Collmar et al. (2010). To explore possible hard X-ray variability on
longer timescales, we analyzed the data of INTEGRAL revolution 1545 a month earlier, in 2015 May, for a total exposure of ∼44 ks. This did not yield a detection, which indicates that the source was in a quiescent state. A confirmation of this finding is provided by a simultaneous Swift-XRT observation (id 00092194008, see Table 1) that
reveals the sourceflux to be three times lower than in the active state. This draws a consistent picture of the source state: it indicates that the hard X-ray emission of 3C279 is variable, and that this variability may be correlated with the soft X-ray variability, as expected in both model scenarios considered here, in which the emission in both frequency regimes is produced by the same relativistic particle population. Wefind Figure 3. Quasi-simultaneous SED of 3C279, along with the leptonic (red
solid) model, as described in the text. In the leptonic model, the different line styles represent the individual emission components: synchrotron (dotted), synchrotron self-Compton (solid), external Compton scattering of accretion disk photons(dotted–dashed), external Compton scattering of BLR radiation (dashed), and the sum of all components (solid). See Table 3 for model parameters.
that homogeneous, single-zone radiation transfer models provide a satisfactory representation of the SED, in both a leptonic and a lepto-hadronic scenario.
Our leptonic SED model indicates that the emission region needs to be dominated by kinetic energy by a factor of ∼10 with respect to the energy carried in magnetic fields. Such a situation may be difficult to realize in scenarios of jet formation and acceleration in which the magnetic field is the primary source of jet power, because one would naturally expect any mechanism that converts magnetic-field energy to particle kinetic energy to cease once approximate equipartition is reached. A particle acceleration scenario involving relativistic shocks in a particle-dominated jet(e.g., Marscher & Gear1985; Sokolov et al.2004; Joshi & Böttcher2011) and/or shear layer
acceleration in a spine–sheath geometry (e.g., Stawarz & Ostrowski2002; Ghisellini et al.2005) may provide a suitable
alternative. In the leptonic scenario the inferred location of the emitting region is well within the BLR (at 0.011 pc from the supermassive black hole), so VHE photons would not be able to escape this region unattenuated(Böttcher & Els2016). Thus,
our model predicts that no VHE emission should have been detected from thisflare, if not originating at a different location. Such a location is found to be far beyond the BLR of 3C279 in order for VHE photons of ∼100 GeV to be detectable, as derived in a dedicated study of the gamma-ray emission site by Dermer et al.(2014). In fact, the single highest-energy
gamma-ray revealed by the Fermi-LAT in this flare from 3C279 is detected at no more than∼52 GeV (Paliya2015).
In contrast, our lepto-hadronic SED model allows us to choose parameters close to equipartition between the magnetic field and the relativistic proton population. This model requires a spectral index for proton injection of 1.8, which is harder than what one would expect, e.g., in standard scenarios of particle acceleration at non-relativistic shocks or relativistic, parallel shocks. However, diffusive shock acceleration at relativistic, oblique shocks (Summerlin & Baring 2012) or at relativistic
shear layers (e.g., Rieger & Duffy 2006) may produce
relativistic particle spectra much harder than E−2. Further support for the lepto-hadronic scenario is provided by the quite good agreement in terms of the minimum-time variability of ∼6.2 hr derived from our modeling and the measured resolved variability of ∼6 hr in the study of Paliya (2015). In our
modeling, we have assumed that the comoving electron-synchrotron radiation field dominates over external radiation fields, which requires the emission region to be located outside the BLR. An important issue for the lepto-hadronic model may be the extreme jet power, of the order of the Eddington luminosity of the central black hole in 3C279. Our observa-tions show that INTEGRAL data tie in with both the Swift-XRT soft X-ray data and the Fermi-LAT gamma-ray data, forming a straight power law, which strongly suggests that it is one single emission component that is responsible for the entire X-ray through gamma-ray spectrum. This is compatible with the proton-synchrotron interpretation.
The low-energy synchrotron emission and the high-energy inverse-Compton emission originate in the very same region under the assumption of one-zone radiation transfer. With this assumption, the leptonic model cannot explain the observed low-energy and high-energy variability in many cases (e.g., Böttcher et al.2009; Nalewajko et al.2012; Paliya et al.2016),
which calls for alternative sophisticated models including the lepto-hadronic model, although that faces the issue of the extreme jet power in our study. Dedicated studies of hadronic processes are also put forward in a sophisticated work by Ackermann et al.(2016) to explain sub-orbital scale variability
in two out of 11 one-orbit bins during a Fermi-LAT ‘Target of Opportunity’ observation. A time-dependent lepto-hadronic model(e.g., Diltz et al.2015) might represent a viable avenue
for a solution.
In quiescent states of 3C279, leptonic models can often reproduce the SED satisfactorily (e.g., Collmar et al. 2010; Zheng & Yang2016). Such modeling suggests that the
gamma-ray emission site is outside the BLR(Zheng & Yang2016) and
thus makes the detection of VHE photons possible. On the other hand, the leptonic model is far from equipartition (Böttcher et al.2009) when trying to reproduce the VHE data
from the Major Atmospheric Gamma-ray Imaging Cerenkov (MAGIC) telescope (Albert et al.2008). However, those data
Table 3
List of Parameters from SED Modeling
Model R ηesc B Γ γmin γmax q γpmin γpmax qp
(1) (2) (3) (4) (5) (6) (7) (8) (9) (10) (11)
Leptonic 1 7 1 20 1×10³ 1×10⁵ 3 L L L
Lepto-hadronic 1 1 100 20 1×10² 1×10⁴ 3 1×10³ 6×10⁸ 1.8 Note. Explanation of columns: (1) SED model; (2) radius of emitting volume ×1016cm;(3) escape time parameter: t
esc=ηesc×R/c; (4) magnetic field in gauss; (5)
bulk Lorentz factor;(6) and (7) minimum and maximum random Lorentz factors of injected electrons; (8) slope of the injected electron distribution; (9) and (10) low-and high-energy cut-offs of the proton spectrum in GeV;(11) slope of the injected proton distribution.
Figure 4. Quasi-simultaneous SED of 3C279, along with the lepto-hadronic (green solid) model, as described in the text. In the lepto-hadronic model, the different components are: primary electron synchrotron(dotted–dashed) and proton synchrotron(dashed). See Table3for model parameters.
can be well explained in the context of a lepto-hadronic model (Böttcher et al.2009).
5. CONCLUSIONS
3C279 was caught in outburst by INTEGRAL–IBIS/ISGRI in 2015 June. The multifrequency campaign around this detection has collected observations in the optical, X-ray, hard X-ray, and gamma-ray bands. The SED of these observations can be equally well modeled by a leptonic model and by a lepto-hadronic one. Yet, the derived parameters of these models challenge the physical conditions in the jet. In fact, for the leptonic model it is not possible to obtain an arrangement that is even approximate to equipartition. The same model also predicts that no VHE photons should have been detected during this outburst. In contrast, an arrangement close to equipartition in the lepto-hadronic scenario favors this model, even though the jet power remains extreme. Our INTEGRAL data tie in with Swift-XRT and Fermi-LAT data and form a straight power law, which is compatible with the proton-synchrotron component of the lepto-hadronic scenario.
We thank the anonymous referee for an exhaustive and constructive refereeing process. We also thank the INTEGRAL and Swift teams for the observations. This research is based on observations with INTEGRAL, an ESA project with instru-ments and science data center funded by ESA member states (especially the PI countries: Denmark, France, Germany, Italy, Switzerland, Spain) and Poland, and with the participation of Russia and the USA. This paper has made use of up-to-date SMARTS optical/near-infrared light curves that are available atwww.astro.yale.edu/smarts/glast/home.php. This research has made use of the NASA/IPAC Extragalactic Database (NED), which is operated by the Jet Propulsion Laboratory, of data obtained from the High Energy Astrophysics Science Archive Research Center (HEASARC) provided by NASA’s Goddard Space Flight Center. E.P. acknowledges partial support from the Italian Ministry for Research and Scuola Normale Superiore, and grants ASI INAF I/088/06/0, INAF PRIN 2011, and PRIN MIUR 2010/2011. The work of M.B. is supported by the South African Research Chair Initiative (SARChI) of the Department of Science and Technology and the National Research Foundation10 of South Africa through SARChI Chair grant No. 64789. E.B. acknowledges support through NASA grants NNX13AO84G, NNX13AF13G, and partial support through grant NNX16AF27G. This paper is dedicated in memory of Lea Bottacini.
Facilities: Fermi, INTEGRAL, Swift, SMARTS.
REFERENCES
Abdo, A. A., Ackermann, M., Ajello, M., et al. 2010,Natur,463, 919 Ackermann, M., Anantua, R., Asano, K., et al. 2016,ApJL,824, L20 Aharonian, F., Akhperjanian, A. G., Bazer-Bachi, A. R., et al. 2007,ApJL,
664, L71
Albert, J., Aliu, E., Anderhub, H., et al. 2007,ApJ,669, 862 Albert, J., Aliu, E., Anderhub, H., et al. 2008,Sci,320, 1752 Arnaud, K. A. 1996, adass,101, 17
Atwood, W. B., Abdo, A. A., Ackermann, M., et al. 2009,ApJ,697, 1071 Bonning, E., Urry, C. M., Bailyn, C., et al. 2012,ApJ,756, 13
Bottacini, E., Ajello, M., & Greiner, J. 2012,ApJS,201, 34 Bottacini, E., Böttcher, M., Schady, P., et al. 2010,ApJL,719, L162 Bottacini, E., Ferrigno, C., Fotopoulou, S., et al. 2015, ATel,7648 Böttcher, M., & Chiang, J. 2002,ApJ,581, 127
Böttcher, M., & Els, P. 2016,ApJ,821, 102
Böttcher, M., Mause, H., & Schlickeiser, R. 1997, A&A,324, 395 Böttcher, M., Reimer, A., & Marscher, A. P. 2009,ApJ,703, 1168 Böttcher, M., Reimer, A., Sweeney, K., & Prakash, A. 2013,ApJ,768, 54 Cardelli, J. A., Clayton, G. C., & Mathis, J. S. 1989,ApJ,345, 245 Collmar, W., Böttcher, M., Krichbaum, T. P., et al. 2010,A&A,522, A66 Courvoisier, T. J.-L., Walter, R., Beckmann, V., et al. 2003,A&A,411, L53 Cutini, S. 2015, ATel,7633
Dermer, C. D., Cerruti, M., Lott, B., Boisson, C., & Zech, A. 2014,ApJ, 782, 82
Diltz, C. D., Böttcher, M., & Fossati, G. 2015,ApJ,802, 133 Ghisellini, G., Tavecchio, F., & Chiaberge, M. 2005,A&A,432, 401 Hartman, R. C., Bertsch, D. L., Fichtel, C. E., et al. 1992,ApJL,385, L1 Hartman, R. C., Böttcher, M., Aldering, G., et al. 2001,ApJ,553, 683 Hayashida, M., Nalewajko, K., Madejski, G. M., et al. 2015,ApJ,807, 79 Joshi, M., & Böttcher, M. 2011,ApJ,727, 21
Kalberla, P. M. W., Burton, W. B., Hartmann, D., et al. 2005,A&A,440, 775 Kiehlmann, S., Savolainen, T., Jorstad, S. G., et al. 2016,A&A,590, A10 Larionov, V. M., Jorstad, S. G., Marscher, A. P., et al. 2008,A&A,492, 389 Lebrun, F., Leray, J. P., Lavocat, P., et al. 2003,A&A,411, L141
Lucarelli, F., Pittori, C., Verrecchia, F., et al. 2015, ATel,7631 Marscher, A. P., & Gear, W. K. 1985,ApJ,298, 114
Marziani, P., Sulentic, J. W., Dultzin-Hacyan, D., Calvani, M., & Moles, M. 1996,ApJS,104, 37
Mead, A. R. G., Ballard, K. R., Brand, P. W. J. L., et al. 1990, A&AS,83, 183 Mirzoyan, R. 2015, ATel,7080
Moretti, A., Campana, S., Tagliaferri, G., et al. 2004,Proc. SPIE,5165, 232 Nalewajko, K., Sikora, M., Madejski, G. M., et al. 2012,ApJ,760, 69 Paliya, V. S. 2015,ApJL,808, L48
Paliya, V. S., Diltz, C., Böttcher, M., Stalin, C. S., & Buckley, D. 2016,ApJ, 817, 61
Petropoulou, M., & Dimitrakoudis, S. 2015,MNRAS,452, 1303 Pian, E., Urry, C. M., Maraschi, L., et al. 1999,ApJ,521, 112 Pittori, C., Verrecchia, F., Puccetti, S., et al. 2015a, ATel,7639 Pittori, C., Verrecchia, F., Puccetti, S., et al. 2015b, ATel,7668
Poole, T. S., Breeveld, A. A., Page, M. J., et al. 2008,MNRAS,383, 627 Rieger, F., & Duffy, P. 2006,ApJ,652, 1044
Roming, P. W. A., Kennedy, T. E., Mason, K. O., et al. 2005,SSRv,120, 95 Schlegel, D. J., Finkbeiner, D. P., & Davis, M. 1998,ApJ,500, 525 Sokolov, A., Marscher, A. P., & McHardy, I. M. 2004,ApJ,613, 725 Stawarz, L., & Ostrowski, M. 2002,ApJ,578, 763
Summerlin, E. J., & Baring, M. G. 2012,ApJ,745, 63
Tavani, M., Barbiellini, G., Argan, A., et al. 2008,NIMPA,588, 52 Ubertini, P., Lebrun, F., Di Cocco, G., et al. 2003,A&A,411, L131 Zdziarski, A. A., & Böttcher, M. 2015,MNRAS,450, L21 Zheng, Y. G., & Yang, C. Y. 2016,MNRAS,457, 3535
10
Any opinion,finding, and conclusion or recommendation expressed in this material is that of the authors and the NRF does not accept any liability in this regard.