Pharraacology Btochermstry & Behawor. Vol 24, pp 1031-1037, 1986 ¢ Ankho Internattonal lnc Pnnted m the U S A 0091-3057/86 $3 00 + 00
Effect of Different Parameters on the
Binding of Two Anti-Inflammatory Drugs
to Human Serum Albumin
C R I S T I N A Z O N A , * G I A N N A R O S C E ' I q ' I , * F R A N C E S C A V E N T U R E L L I *A N D L . G I O R G I O R O D A ~ ~
*Dtpartimento di M e d w i n a Spertmentale e Sctenze Btochimiche, " T o r V e r g a t a " Umverstty, R o m e , Italy ~fLaboratorio di Farmacologia, Universtty o f A n c o n a , A n c o n a , Italy
R e c e i v e d 3 J a n u a r y 1985
ZONA, C , G ROSCETTI, F VENTURELLI AND L G RODA Effect ofd,fferent parameters on the bmd, ng of two antt-mflammatory drugs to human serum albumin PHARMACOL BIOCHEM BEHAV 24(4) 1031-1037, 1986 --The binding to human serum albumin of two anU-mflammatory drugs, tndomethacm and ~ndoprofen, has been stud~ed by chromato- graphic and spectroscopic techmques The results shown ~nd~cate that the binding of both drugs~but more notably of ~ndoprofen---ms very sensitive to vanauons of the envmronmental condmuons The binding ~s also dependent upon hmmted modmficatmons m the tertmry structure of the protein The evmdences shown tend to md|cate that these two phenomena are related, and that the binding ms permmtted under condmtmons of a relauvely open structure of the protein molecule
Human serum albumin lndomethacmn Indoprofen Anu-tnflammatory drug binding
S E R U M aibumtns are multiple-functton proteins present at very high (up to 55 mg/ml) concentratton in the plasma of vertebrates Because o f their abundance in p l a s m a ~ a n d hence ease o f purdicat~on--and because these proteins act as carriers of a number o f both physiologically and phar- macologtcally relevant substances [8], serum albumins con- statute a wtdely studied class o f proteins, so that a very ex- tensive literature exists on this topic ( e . g , [5, 9, 14]).
Among the substances that are bound to and carried by serum albumins, anti-inflammatory drugs have been exten- stvely studted, and the bindmg phenomena have been quite well characterized [4, 11, 16], particularly with respect to kmeucs (e.g., [7,12]). Nevertheless, ustng non-sterotdal anti-inflammatory drugs in the course of studtes concermng the serum albumins bindtng behaviour, we came across some unexpected results, suggesting a dependence of the binding upon the conformation assumed by the prote~n under d~ffer- ent cond~Uons.
The present work reports the results obtained ~n the course of these studies, c o v e n n g some aspects of the binding of two of these drugs--tndoprofen and ~ndomethacm--to the human serum album~n The arm o f thts study ~s actually to investigate the role o f the protein tn the binding, and, more speofically, the effects o f the enwronment parameters and of the prote~n concentration ttself on the protein conforma- tton and thus on the binding phenomena
METHOD Detectton Methods
Labelled mdoprofen and ~ndomethacm were quanttta- uvely determmed by counting sample aliquots ~n a L K B model 1211 sc~ntdlatton counter (LKB Produkter, Bromma, Sweden) equipped with an external standard accessory Human serum albumin (HSA) was quantdied spec- trophotometncally, usmg an extmct~on coefficient (0 i%) o f 0 53 at 277.5 nm [11], or by the Lowry assay [6].
B~nding was measured e~ther as described under " d e - tection m e t h o d s " after separation of the incubation mixture by stenc exclusion chromatography, or by following the spectral modtficattons of the protein aromatmc chromophores, as described under "ultraviolet spectro- scopy "
Chromatography
Stenc excluston chromatography was performed w~th a 7.6×600 mm T S K G3000SW or 7 6× 300 mm T S K G2000SW column (Toyo Soda Ltd., Tokyo, Japan) equdibrated wtth 10 mM tns-HCI pH 7.4 plus 10% ethylene glycol (henceforth called tns buffer) and eluted at 2.2 ml × cm ~ x mm -~ Ethylene glycol was used in the elution buffer to obtam a quant~tative recovery o f the free drug. Reverse phase chro-
~Requests for repnnts should be addressed to L G~orgmo Roda, D~partmmento dm Medmona Spenmentale, Umversmth degh Studm "Tor Vergata," Vm O Rmmondo, I 00173 Roma, Italy
1032 ZONA, ROSCETTI, V E N T U R E L L I AND RODA
matography was performed using a 4.6× 100 C-18 column ( S I 0 0 D S , Phase Separation Ltd.. Queensferry, U K ) The column was eluted at 6 ml × cm ~ × mtn -~ with a gradient of CH~CN ~n 2 5 mM H~PO.~
Reverse phase chromatography performed under lsocra- t~c conditions was also used to control the purity of the drugs. Under the test conditions, the labelled lndomethactn was found to be approximately 97% pure. and the labelled indoprofen 93% pure
To optimize the reproduclbd~ty of the chromatographic procedures, a "filled loop'" ~nject~on techmque was em- ployed A 300 p.l loop and a 100 ~.1 loop were used with a Rheodyne 7125 valve (Rheodyne lnc , Cotat~, CA) for sterlc exclusion and reverse phase chromatography respectively Three runs were made for each sample, and the results aver- aged
Ultravu~let Spectroscopy
Ultraviolet spectra were recorded with a Cary 219 spec- trophotometer ( V a n a n Associates, Palo Alto, CA) eqmpped with a thermostatted cell assembly The spectrophotometer was connected ~n-hne to a Hewlett Packard model 86B desk-top computer (Hewlett Packard C o , Palo Alto, CA) wa a Varlan 954550 module and a HP 82941A BCD ~nterface
To record d~fference spectra, Hellma type 238 QS double-sector cells were used (Hellma Gmbh, Mullhetm/Ba- den, DBR) The compartments of both cuvettes were filled w~th a constriction p~pette, the cuvettes were placed ~n the thermostatted sample compartement and the temperature was allowed to balance off. The base hne was zeroed, re- corded, and stored ~n the HP86 peripheral memory. The sample cuvette was mixed and the difference spectrum was recorded tn the computer and subsequently analyzed with the appropriate software
Because of the high absorbance levels, difference spectra cannot be recorded with the double-sector cells at very high prote~n concentration Therefore, these spectra were re- corded using i 0, 0 5 and 0 2 opttcal path cuvettes (Helima type 201/202). The cuvettes, f'dled wtth the appropriate buf- fer, were placed in the spectrophotometer cell holder and the base line was recorded The sample cuvette was removed, emptted, dried and refilled in turn with pure protein, protein plus hgand and free hgand at the correct concentrations and the relative spectra were recorded. The absorption spectra were stored in the computer and analyzed as described be- low
Data Reduction
The spectrophotometnc data stored m the HP 86 mag- nettc memory were analyzed off-line The concentration- difference s~gnals were computed by separately recordmg the absorption spectra obtained at different protein concen- trattons and by storing them In the magnetic memory of the computer The signals were then weighed using a factor corresponding to the dtfference tn the ongmal concentration multiplied by the reciprocal of the optical path used to record each spectrum The less concentrated solution was obtmned dllutmg the more concentrated one, and the same set of cuvettes was used m all the experiments Using cuvettes of the appropriate pathlength, the recorded absorbances were maintained in the range of 0 5-1 5 Thus, within the spectral range examtned, the slgnal-to-no~se ratio of the |nstrument was better than 5 to 10L Therefore, the major source of error was due to ptpettlng Th~s was m~mmlzed using the same set
0.25
I
0.20
i
0.15-
0.10-
0.05-
m l-10.0
-8.0 ~
-8.0
i
?
-4,0 - 2 . 0FIG
I
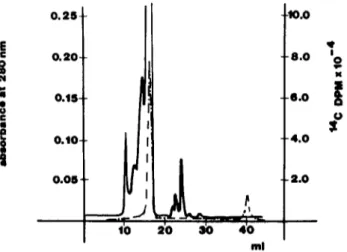
Stenc exclusion chromatography of labelled mdomethac~n incubated (3 minutes at 37°C) m whole plasma Incubation and chromatographic conditions as described ~n the text The sohd hne represents absorbance at 280 nm. the dash-dotted hne represents ~ndomethacm DPMof constrlctton p~pettes The reproduclbhty of the pipettes used was checked and found to be approximately 0.5% of the measured volume So, s~nce two ptpettlngs were necessary, the potential maximum error was about 1% of the nominal concentration.
Difference spectra at h~gh protein concentration were computed from the previously-recorded absorption spectra To take ~nto account volume variations, the correct absor- bance was computed as the product of the recorded absor- bance mult~phed by the original volume and dlwded by the final volume. Then, the difference spectra were calculated by adding the separately-registered protein and hgand spectra, and by subtracting the result from the pure prote~n spectrum
Matertal
Human blood, freshly collected from healthy volunteers, was centrifuged (10 mm at 2000 × g) m a refrigerated cen- trifuge Supernatant plasma---pooled to average the results--were stored under llqmd mtrogen until used. In- domethacm, i-(p-chlorobenzoyl)-5-methoxy-2-methyl-3-m- dolacetlc acid was purchased from Sigma Chemtcal Co (St Louts, MO), and '4C ~ndomethacln from the Radlochemlcal Centre (Amersham, U.K ) Indoprofen, 2-[4-(l-carboxyethyl) phenyl-l]lsomdohnone, and ~4C indoprofen were a g~fl from Farmltaha Carlo Erba (Mdan, Italy). Human serum albumin was obtained from Serva Felnb~ochem~a (Heidelberg, DBR) CH~CN for reverse phase chromatography was "'L~ch- rosolv" grade from E Merck (Darmstadt, DBR) All other chemicals used were of a reagent grade and used w~thout further purification
RESULTS Role o f the Envmmmental Parameters
lndomethacm binding m plasma When whole human plasma was ~ncubated for different periods of time w~th la- belled mdomethacln (2 5× l0 -a moles in 500 ~l) and the mcu-
S E R U M A L B U M I N A N D A N T I - I N F L A M M A T O R Y D R U G S 1033
0.10.
i ~i ~ ~ ~ ~ mlI
-7.5
~
-5.0 ~.1
. 2 . 8FIG 2. Sterac exclusion chromatography of labelled ~ndomethactn mcubated (3 m~nutes at 37"C) m tns buffer. Incubation and chromat- ographic conditions as described m the text The sohd hne repre- sents absorbance at 280 nm, the dash-dotted hne represents m- domethacm DPM
bat~on mixture was fracttoned by stenc exclusion chroma- tography, results such as the ones shown in Fig. I were obtained. The sohd Ime m the figure--which refers to a 3 mm incubation t i m e - - s h o w s the absorbance at 280 nm, whde the dash-dotted line indicates 14C DPM. In the figure, the radioactive label ms d~strlbuted m two peaks. The first one, accounting for 74% of the total radmoactmv~ty, ms eluted at a volume corresponding to the elution volume o f pure HSA. The second radmoactmve peak ms eluted at the volume of the free mdomethacln. The same experiments were repeated at dmfferent incubation tmmes, obtaining the results described under "tmme d e p e n d e n c e " and |ndmcated m Fig. 4
indoprofen btndmg m plasma
The experiments de- scribed in the previous paragraph were repeated using lndoprofen---mstead of m d o m e t h a c m - - a s hgand. Even in this case the major part (67% at 3 minutes) of the radioactive label was found to be assocmted to the serum albumin.lndomethacm binding in buffer.
Labelled mdomethacln (2.5× 10 -9 moles in 500 ~1) was incubated w~th H S A in trls buffer for d~fferent periods of tmme. The concentration of the protein was 50 mg/mi, which is approximately the physiolog- ical concentratmon of th~s protein in human plasma, and the Incubatmon mixture was fractloned by stenc exclusion chro- matography as described under the Method section. The re- sults for 3 minutes o f incubation are shown m Frog 2. Even in this case, two radmoactmve peaks were obtained However, only 42% of the radioactive label (at 3 mmnutes) is eluted in assocmatton wroth the serum albumin, in contrast with the 74% bound measured in whole plasma at the same incubation timelndoprofen bin&ng In buffer.
The same experiments were repeated under the same condmt~ons wroth indoprofen as the hgand, and completely different results were obtained In this case, the major part o f the radioactive label was eluted at the free drug elution volume, a n d - - a t 3 m i n u t e s - - o n l y 1.7% o f the drug was found to be associated to the serum albumin This result strongly contrasts with the 67% o f albumin- associated drug measured when the incubation was per- formed in whole plasma with the same substance.'U e. 0 m e u ~,
5o
30
20
10
I0
a
I
I
I
20
30
40
[I ,°
b
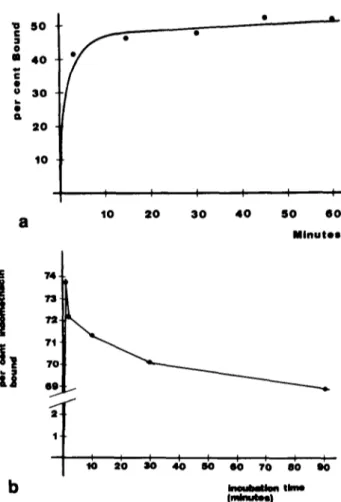
I I 5 0 6 0 M i n u t e s ~ I I I I I I I I ~ 0 2 0 ~ 0 4 0 8 0 GO ? 0 8 0 9 0 ~ t i m * ( m !FIG 3 Panel a HSA-bound tndomethacm as functmon of the mcu- batmon t~me Labelled mdomethacm was incubated w~th HSA m tns buffer and the incubation m~xture was separated as described m the text The data are expressed as bound drug as percent of the total Sohd c~rcles represent experimental points (average of three runs) Panel b represents the same data as panel a, but mdomethacm was incubated m whole plasma
Time Dependence
Indomethacln (2 5×10 -9 moles) was incubated in the presence o f H S A (50 mg/ml) tn tris buffer, or in whole plasma, as described prewously. The reaction was allowed to proceed for amounts of time varying between 30 seconds and 90 minutes, and the reactmon mixtures were separated by stenc exclusion chromatography.
When the experiments were performed m buffer, a steady, though modest, mncrease o f the bound tndomethacm was evidenced, as predictable, at the longer incubation times (e.g., from 42 to 50% bound between 3 and 60 minutes, solid line in Frog 3 panel a). Opposite results were obtained when the same experiments were performed m plasma. As shown in Fig. 3, panel b, at the longer incubation times (that ms, beyond 3 minutes) a limited decrease of the bound drug be- came evident ~n lieu o f the increase evidenced in buffer.
The latter result can be interpreted in two ways: either the albumin-bound drug is partmlly metabohzed in plasma, or else it binds other plasma components with kinetics slower than those of the serum albumin.
To verify the first hypothesis, labelled mdomethacm was incubated for up to 90 minutes wroth whole plasma, and the
1034 Z O N A , R O S C E ' V F I , V E N T U R E L L I A N D R O D A - 5
0 . 2 5 -
0 . 1 5 - 0 . 1 0 -0 . 0 5
- ,~ "~ A - t \ , o - 4 - 3 - 2-1
" , I - I l 1 2 3 4 aFIG 4 Stenc exclusion chromatography ofmdomethaon incubated in whole plasma Incubation and chromatographic procedures as described in the text The sohd hne represents absorbance at 280 nm The dash-dotted line represents ~ndomethaon DPM at 1 minute of incubation and the dash-three dots hne represents mdomethac~n DPM at 90 m~nutes of incubation
i n c u b a t i o n m i x t u r e w a s f r a c t i o n e d by r e v e r s e phase c h r o m a - tography as d e s c r i b e d u n d e r the M e t h o d section U n d e r t h e s e c o n d i t i o n s the binding is d e s t r o y e d by the organic m o d i f i e r and o v e r 96% o f the label is eluted at the position o f the ~ntact m d o m e t h a c m , thus making the hypothes~s o f drug d e g r a d a t i o n an unhkely o n e
T h e s e c o n d hypothes~s was ~nvestigated as d e s c r i b e d ~n the p r e v i o u s paragraph, but the incubation mixture was fract~oned on a G2000 c o l u m n This was d o n e b e c a u s e o f the h y p o t h e s i s that s o m e o f the r a d i o a c t i v e label m a y bind low m o l e c u l a r weight plasma c o m p o n e n t s which are not sepa- rated f r o m the free drug by the G3000 c o l u m n The results o f this e x p e r i m e n t are s h o w n ~n Fig 4 T h e d a s h - d o t t e d line ~n the figure indicates the radioactivity after 1 minute o f incu- bation. T w o main r a d i o a c t i v e peaks are e v i d e n t , c o r r e s p o n d - lng to the H S A and free drug elutlon v o l u m e s On the o t h e r hand, tn the c h r o m a t o g r a m relative to 90 minutes o f incuba- tion (dash-three dots line), three r a d i o a c t i v e peaks are sepa- rated T h e peak eluted at i n t e r m e d i a t e v o l u m e , not present at the short incubation t~mes, v e r y likely r e p r e s e n t s ln- domethac~n bound w~th s l o w k~netlcs to plasma material o f a relatively low m o l e c u l a r weight This ~nterpretation is also c o n f i r m e d by q u a n t i t a t i v e m e a s u r e m e n t s . I n d e e d , the m- d o m e t h a o n eluted at the i n t e r m e d i a t e v o l u m e a l m o s t e x a c t l y c o r r e s p o n d s to the d e c r e a s e m the a l b u m i n - b o u n d drug s h o w n in F~g. 3b
Serum Albumm Con~entratum
W h e n binding e x p e r i m e n t s w e r e p e r f o r m e d with ln- d o m e t h a c m in a q u e o u s buffer at an H S A c o n c e n t r a t i o n o f I mg/ml, no blndang at all was e v i d e n c e d T h e r e f o r e , a series o f binding e x p e r i m e n t s w e r e p e r f o r m e d at different protein c o n c e n t r a t i o n s to ascertaan the possible role o f this param- e t e r L a b e l l e d ~ndomethacln (2.5× 10 -a m o l e s In 500 p.I) was
• 1 . 5 S t . i k
-~
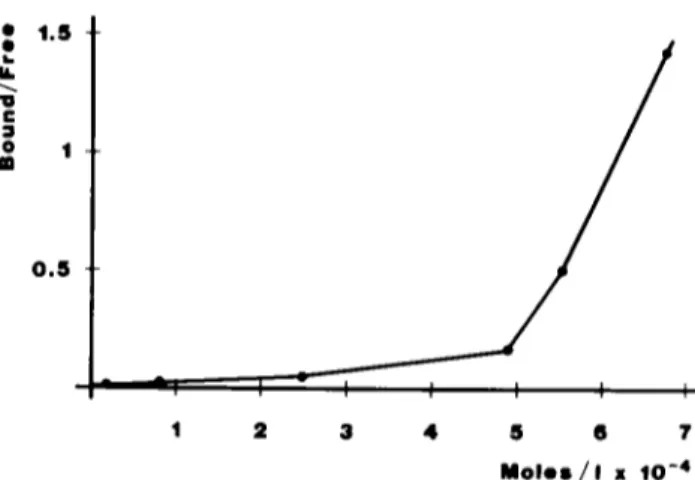
~ ~ i~ 0 . 5 I 1 I 5 6 ? M o l e s / I • 1 0 - 4FIG 5 HSA-bound ~ndomethaon as function of the serum album~n concentration Labelled tndomethacm was incubated 3 minutes at 37°C w~th the HSA concentrations indicated, and the incubation m~xtures were fract~oned by stenc exclusion chromatography The results are plotted as bound/free drug against the protein molar con- centrat~on (average of three runsl
i n c u b a t e d for 15 minutes at 37°C in t n s buffer ~n the p r e s e n c e o f H S A at c o n c e n t r a t i o n s ranging from 1 to 4.5 mg/ml T h e incubation m i x t u r e was s e p a r a t e d by s t e n c e x c l u s i o n chro- m a t o g r a p h y on the G3000 c o l u m n , and the results plotted as b o u n d / f r e e hgand v e r s u s the prote~n c o n c e n t r a t i o n (Fig 5) T h e c u r v e s h o w n indicates a m a r k e d d e p e n d e n c y o f the b o u n d drug on the albumin c o n c e n t r a t i o n , and also an abrupt c h a n g e m the slope o f the c u r v e at a c o n c e n t r a t i o n corre- sponding to a p p r o x i m a t e l y 30 mg/ml, as further d e s c r i b e d m the next paragraph
Serutn Albumin Conformation
As indicated m Fig 5, the relationship b e t w e e n the protein c o n c e n t r a t i o n and the drug bound is linear up to a p p r o x i m a t e l y 30 mg/ml B e y o n d this c o n c e n t r a t i o n , the slope o f the c u r v e b e c o m e s s t e e p e r This p h e n o m e n o n could be related to a c o n f o r m a t l o n a l c h a n g e o f the protein m o l e c u l e , such as to f a v o u r the protein-drug interaction If this h y p o t h e s i s is c o r r e c t , the protein c o n f o r m a t i o n at high c o n c e n t r a t i o n should be different f r o m its c o n f o r m a t i o n at low c o n c e n t r a t i o n M o r e o v e r , an abrupt con- f o r m a t i o n a l c h a n g e should b e c o m e e v i d e n t in the vicinity o f the critical c o n c e n t r a t i o n o f 30 mg/ml
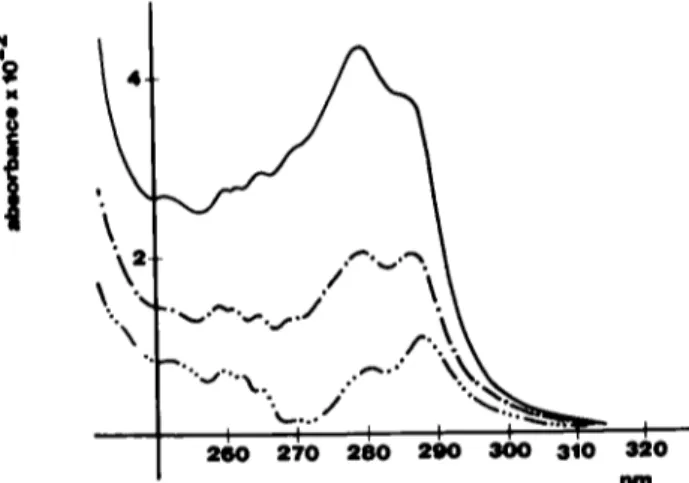
T o verify this h y p o t h e s i s , ultraviolet spectra o f human s e r u m albumin w e r e r e c o r d e d at different protein c o n c e n t r a - tions, and the results a n a l y z e d as d e s c r i b e d u n d e r the M e t h o d section T h e difference s p e c t r a b e t w e e n 55, 40 and 20 mg/ml and i mg/ml H S A are s h o w n in Fig 6 The signals thus obtained are totally p o s i t i v e , and exhibit t w o strong m a x i m a , at 27%280 and 286--287 nm plus a series o f ripples b e t w e e n 250 and 270 nm. It is also n o t e w o r t h y that the ratio o f the t w o m a x i m a c e n t e r e d at 279 6 and 289 3 nm m the 55 mg/ml s p e c t r u m changes with the c h a n g e s in the s e r u m al- bumin c o n c e n t r a t i o n , ranging from 133 to 0 64 (shorter w a v e l e n g t h divided by longer w a v e l e n g t h )
T h e c o n c e n t r a t i o n difference signals thus calculated seem to be g e n e r a t e d by d i f f e r e n c e s in the protein tertiary struc- ture directed t o w a r d s a polarity r e d u c t i o n o f the c h r o m o p h o r e s ' e n v i r o n m e n t w h e n the protein ~s at low con-
SERUM A L B U M I N AND A N T I - I N F L A M M A T O R Y DRUGS 1035
. . . .
260 270 280 290 300 310
~'~O Im
~ i
FIG 6 Concentration-difference spectra of HSA tn tns buffer calcu- lated against the 1 mg/ml spectrum The sohd line represents the 55 mg/ml spectrum, the dash-dotted line represents the 30 mg/ml spec- trum and the dash-three dots hne represents the 20 mg/ml spectrum
centrat~on. Actually, both the poslt~on of the two maxima and the pattern of the concentratton-d~fference spectra correspond very well to an HSA perturbation spectrum Th~s ~s clear tf the curve representing the 1-20 mg/ml difference spectrum (Fig 6) is compared to Fig. 7, which shows an HSA perturbat|on spectrum for a transfer from 0 to 10% ethylene glycol [15] Since the spectrum recorded at the lower prote~n concentration was subtracted from the spectra recorded at high protein concentration, the resulting positive differences can be interpreted as generated by a reduction of the environment polarity of the less concentrated protem in respect to the more concentrated one.
Moreover, the e n w r o n m e n t polarity variation does not follow hnearly the change ~n the prote~n concentration. In- deed, F~g 8 shows the dependence of the 279 nm signal upon the HSA concentration. The curves obtained by piottmg both bound tndomethacm (Fig. 5) and HSA conformat~onal changes (Fig. 8) against the protein concentration follow the same general pattern. This certainly favours the hypothesis that the observed differences tn binding are dependent on a conformaaonal change tn the protein molecule.
Finally, control experiments were performed to ascertmn the possible role of ethylene glycol on the HSA concentration-dependent structural changes Concen- tration-difference spectra were recorded as described m the previous paragraphs, using as buffer 10 mM tns-HCI pH 7 4 w~th no ethylene glycole Under these conditions (not shown), the detads of the fine structure of the spectra understandably differed from the ones registered m the pres- ence of the perturbing agent Nevertheless, both the general pattern of the spectra and the differences measured were in good agreement w~th the ones measured in the pres- ence of ethylene glycol, thus disproving the hypothesis that the described phenomena may be caused by the presence of the glycol
FIG 7 Perturbation spectrum of 2 mg/ml HSA for a transfer from 0% to 10% ethylene glycol m 10 mM tns-HCl pH 7 4
•
! 0.02
20
30
40
50
e~o
I ~ A mg/nd
FIG 8 Magmtude of the 279 nm HSA concentration difference s~gnals as function of the protein concentration Sohd circles repre- sent the experimental points
ential exposure of s~tes (or s~te) which are at least partially h~dden when the serum albumin assumes a low- concentration conformation, notably m a polar environment To obtain more ewdence m this respect, we performed b~nd-
~ng experiments under condmons which should lead to a hm~ted and to an almost complete unfoldmg of the HSA molecule The rationale for these experiments was that--~f the hypothes~s of a protein's conformat~onal control on the binding were c o r r e c t - - a modest unfoldmg of the protein could ~ncrease, or permit, b~nd~ng, while a severe unfolding should almost certainly prevent ~t.
The results of these experiments are summarized tn Ta- ble 1 Actually, under conditions of a lmalted relaxation of the protein tertiary structure (4 M guanld~ne-HCI and unreduced S-S bonds, [10]), a hm~ted binding between HSA and mdo- profen can be evidenced. On the other hand, under non- d e n a t u n n g conditions, th~s binding can be ewdenced only ~n plasma, but not ~n aqueous buffer In addition, no binding at all--e~ther with tndoprofen or with mdomethac~n--can be ewdenced w~th the reduced and carbox~methylated protem [4] ~n 6 M guamdtne-HCI, conditions that should mamtmn the prote~n tn a near-random cod status
Binding Under Denaturing Conditions
The evidence presented so far tends to favour the hypoth- es~s that the binding phenomena are controlled by the prefer-
DISCUSSION
The experiments described m the previous section can be summarized as follows
1036 Z O N A , R O S C E T T I , V E N T U R E L L I A N D RODA
T A B L E 1
PERCENT OF EACH DRUG BOUND TO HSA AT 3 MINUTES OF INCUBATION lndomethacm Indoprofen Whole plasma 74 66 Native protein in 42 2 ins buffer In 4 M guanldme-HCI 28 15 m 1 0 m M t n s p H 7 2 In 6 M guamdme-HCl 0 0 m 1 0 m M t n s p H 7 2
Reduced and carboxy- 0 0
methylated protein m 6 M guamd~ne-HCI ~n 1 0 m M t n s p H 7 2 Performic acid-oxidized 2 3 protein in 10 mM tns buffer
Prote~n concentration. 50 mg/ml except m plasma Tns buffer 10 mM tns-HCI pH 7 2, 10% ethylene glycol
(I) Both drugs, when incubated in whole plasma, are bound to serum albumin (2) l n d o m e t h a c m - - b u t not i n d o p r o f e n - - b l n d s serum albumin in aqueous buffer while, (3) both drugs bind the H S A under partially-denaturing con- dltions (4) The b~ndmg between H S A and indomethacln is non-hnearly dependent on the protein concentration (5) The H S A absorption spectra show concentration-dependent fea- tures suggestive o f a relatively relaxed structure when the protein is at high concentration Moreover, the spectral modifications are non-hnear with the protein concentration, and the departure from hneanty parallels the departure from the hneanty evidenced for the indomethacin binding
T w o o f the phenomena evidenced seem to be related and worth discussing, the absence of HSA-mdoprofen binding in aqueous buffer, and the absence of HSA-indomethacln bind- ing at low protein concentration
A possible explanation o f both phenomena is that the con- formation assumed by the serum albumin in plasma ~s differ- ent from the conformation assumed in the more polar en- vironment constituted by the aqueous buffer In addit~on, the conformation o f the protein can be different at low concen- tration and at high concentration. In both cases, only one conformation can favour, or permit, binding. Some of the evidence shown under the Results section may help to ascer- tain the rehabdlty o f these hypotheses. First, no binding is detectable---even with m d o m e t h a c m - - a t low protein con- centration We advanced the hypothesis that, if a con- formatlonal change of the protein molecule was responsible
for the observed differences in binding, then the albumin conformation should be different at high concentration m respect to the conformation assumed at low concentration Moreover, if the two phenomena are related, the concentration-dependent conformational changes should fol- low the same pattern as the concentration-dependent binding variations Both aspects of this hypothesis were verified
concentration-difference spectra IFig 6) show features that can be attributed to concentration-dependent modlficat|ons In the protein structure The dependence of both binding (Fig 5) and spectral modifications (F~g 8) on the protein concentration follows the same pattern Even if the exist- ence o f these phenomena cannot be considered ,i definite proof o f a causal relationship, it may be considered a strong argument in favour of it
Moreover, even the data relative to the binding under denaturing conditions seem to favour the same hypothes~s As shown, the partial unfolding of the protein molecule caused by the breaking of the hydrogen bonds in 4 M guamdine could very roughly mime the relatively relaxed conformation assumed by the protein at high concentration, thus favouring or permitting binding
An intriguing point raised by our results is that several of the effects of the binding to serum albumins of the non- steroidal anti-inflammatory drugs have been detected at protein concentrations where, according to our data, no binding could be detected These effects include protection from thermal denaturation and from enzymatic cleavage, differences in UV and CD spectra, differences in heat- induced polymerization and so tbrth II, 11, 12, 13J It is certainly possible--although not probable--that both the drugs examined behave in a very anomalous way in respect to the albumin binding It ~s also possible that some of the effects reported were due to causes other than the direct proteln-hgand interactions Whatever the reason, ~t seems worth further mvest|gatlon
In summing, the data reported tend to suggest that protein-drug binding is dependent upon the conformatlonal status of the protein, and that it is favoured or permitted by a relatively loose structure of the HSA Incidentally, it should be noted that a non-hnear, concentration-dependent be- havlour of a serum albumin has been described elsewhere ~n the case of bovine serum albumin-leu-enkephahn interaction [2] Hypotheses other than the above mentioned ones are certainly possible To gain a better insight to these phenomena, it seems necessary to obtain thermodynamic
evidences, by directly measuring the energies involved In the protem-hgand and protein-solvent interactions as well as in the protein-protein interact|on causing the structural re- arrangements that seem to be of paramount ~mportance for the protein-drug binding
ACKNOWLEDGEMENT
We would hke to thank Professor Bruno Camerlno for the k~nd g~ft of lndoprofen and of labelled mdoprofen
REFERENCES
1. Chtgnell, C F Optical studies of drug-protein complexes, 11 Interaction of phenylbutazone and its analogues with human serum albumin Mol Pharmacol 5: 244-252, 1969
2 De Marco, V . R Possenu, F V~ta, B Rapposelh. M D'Alagm and L G~orgio Roda Enkephahn-b,ndmg systems in human plasma, II Leu-enkephahn serum album,n lnteracuon Neuro- t h e m Res 10: 1355-1369, 1985
S E R U M A L B U M I N A N D A N T I - I N F L A M M A T O R Y D R U G S 1037
3 Hirsh, C H W Reduction and S-carboxymethylatlon of proteins In Methods m Enzymology, vol XI, edited by C H W HIrsh New York Academic Press, 1967, pp 199-203. 4 Hutmark, D , K O Borg, R Elofsson and L Palmer Interac-
tion between salycihc acid and mdomethacm in binding to human serum albumin Acta Pharra Suec 12: 259-276, 1975 5 Kragh-Hansen, U Molecular aspects ofhgand binding to serum
albumin Pharrnacol Rev 33: 17-53, 1981.
6 Lowry, O H , N J Rosenbrough, A L F a r r a n d R J Randall Protein measurements with the Fohn phenol reagent J Bud Chem 193: 265-275, 1951
7 Mason, R V and E G McQueen Protein binding of in- domethacm Binding of mdomethacm to human plasma albumin and its displacement from binding by tbuprofen, phenyl- butazone and salycdate, in vitro Pharmacology 12: 12-19, 1974
8 McMenamy, R H Albumin blndmg sytes In Albumin Struc- ture. Function and Uses, edited by V M Rosenoer and M A Oratz Oxford Pergamon Press, 1977, pp 143-158
9 Meyer, C and D E Guttman The binding of drugs by plasma proteins J Pharmacol Set 57: 895-918, 1968
10 Nozaky, Y and C Tanford Examination oftltratl6n behavlour In Methods in Enzymology, vol XI, edited by C H W Hirsh New York Academic Press, 1967, pp 715-734
I 1 0 t a g m , M and J H P e m n Circular dlchrolc investigations of the binding of sahcylate and related compounds to human serum albumin Btochem Pharmacol 26: 283-288, 1977
12 Rosen, A The measurement of binding constants using circular dlchrolsm binding of phenylbutazone and oxyphenylbutazone
Btochem Pharmacol 19: 2075-2081, 1970
13 Rossini, L Hemmung tier mptischen Albummspaltung dutch 2 4-dmltro-pbenol Hoppe Seylers Z Physml Chem 333: 1--4,
1963
14 Vallner, J J Binding of drugs by albumin and plasma proteins
J Pharmacol Sc~ 66: 447-465, 1977
15 Wetlaufer, D B Ultraviolet spectra of proteins and amino acids Adv Protein Chem 17: 303-390, 1962
16 Wh;tlam, J B , M J Crooks, K F Brown and P V Pedersen Binding of non-steroidal antnnflammatory agents to proteins 1
lbuprofen-serum albumin interaction Btochem Pharmacol 28: