Maternal insulin resistance multigenerationally
impairs synaptic plasticity and memory via
gametic mechanisms
Salvatore Fusco
1,2
*, Matteo Spinelli
2
, Sara Cocco
2
, Cristian Ripoli
1,2
, Alessia Mastrodonato
2
,
Francesca Natale
2
, Marco Rinaudo
2
, Giulia Livrizzi
2
& Claudio Grassi
1,2
*
Metabolic diseases harm brain health and cognitive functions, but whether maternal
meta-bolic unbalance may affect brain plasticity of next generations is still unclear. Here, we
demonstrate that maternal high fat diet (HFD)-dependent insulin resistance
multi-generationally impairs synaptic plasticity, learning and memory. HFD downregulates BDNF
and insulin signaling in maternal tissues and epigenetically inhibits BDNF expression in both
germline and hippocampus of progeny. Notably, exposure of the HFD offspring to novel
enriched environment restores Bdnf epigenetic activation in the male germline and
coun-teracts the transmission of cognitive impairment to the next generations. BDNF
adminis-tration to HFD-fed mothers or preserved insulin sensitivity in HFD-fed p66Shc KO mice also
prevents the intergenerational transmission of brain damage to the progeny. Collectively, our
data suggest that maternal diet multigenerationally impacts on descendants
’ brain health via
gametic mechanisms susceptible to lifestyle.
https://doi.org/10.1038/s41467-019-12793-3
OPEN
1Fondazione Policlinico Universitario A. Gemelli IRCCS, 00168 Rome, Italy.2Institute of Human Physiology, Università Cattolica del Sacro Cuore, 00168
Rome, Italy. *email:[email protected];[email protected]
123456789
I
n the past years, growing attention has been devoted to the
impact of overnutrition and metabolic diseases on brain health
and function
1. Epidemiological evidence indicate a higher risk
of cognitive decline and neurodegenerative diseases in patients
affected by obesity and type 2 diabetes
2,3. Moreover, maternal
obesity and consumption of high-fat diet (HFD) are associated
with anxiety-like behavior and neurodevelopmental disorders in
the offspring
4,5. Strikingly, in experimental models HFD has been
reported to transgenerationally predispose to obesity and
meta-bolic syndrome until the third generation via an epigenetic
inheritance
6. This probably occurs because genes can retain
memory of the early-life metabolic stress via epigenetic changes
that include posttranslational modifications of histone proteins
and DNA methylation
7. In this regard, early-life stress may
induce long-term neurobiological modifications affecting synaptic
function and structural plasticity
8,9.
Hippocampus is a brain area playing a critical role in learning
and memory via changes in synaptic plasticity
10that is targeted
by nutrient- and metabolic disease-related signals
11–13. We
recently reported that increased GluA1 S-palmitoylation
under-lies hippocampal synaptic plasticity impairment and cognitive
decline observed in experimental models of metabolic diseases
14.
However, whether maternal diet or metabolic alterations around
the gestational age may multigenerationally affect learning and
memory is not yet known. Here we demonstrate that maternal
HFD affects synaptic plasticity and memory of descendants until
the third generation and reduces exon-specific brain-derived
neurotrophic factor (Bdnf) expression. Accordingly, the early-life
metabolic stress alters epigenetic markers on the promoters of
Bdnf gene in both germline and hippocampus of HFD progeny.
Exposure to novel enriched environment (NEE), a paradigm of
physical and mental training, counteracts the multigenerational
transmission of HFD detrimental effects by restoring both
epi-genetic modifications and BDNF levels in the hippocampus of
progeny. Finally, our
findings suggest that the intergenerational
inhibition of neurotrophic factor expression and memory is
triggered by alteration of both BDNF and insulin signaling in
insulin-resistant mothers. Accordingly, BDNF administration or
lack of pro-insulin resistance gene p66Shc in mothers abolishes
the HFD-dependent transmission of cognitive impairment to the
offspring.
Results
Maternal HFD impairs learning and memory in the offspring.
Previous studies reported that maternal HFD affected
hippo-campal plasticity of the offspring by impairing adult
neurogen-esis, dendritic spine formation, and cognitive functions
15–17.
However, it is unknown whether brain function of the next
generations may be impaired and/or epigenetically influenced by
the dysmetabolic environment of the ancestor. To test this
hypothesis, we fed female mice (named F0) with HFD for 4 weeks
before mating, during the pregnancy, and until the second week
of lactation (hereinafter referred as F0 HFD mother) and
eval-uated hippocampal-dependent synaptic plasticity and memory of
the male descendants, hereinafter named F1HFD, F2HFD, and
F3HFD
indicating the
first, the second, and the third generations,
respectively (Fig.
1
a). Remarkably, in our experimental model the
offspring of HFD mothers were consistently fed with standard
diet (SD) and they were never exposed to HFD.
We started studying the diet-dependent metabolic alterations
in overfed female mice before mating. After 4 weeks of HFD, mice
showed a moderate increase in both weight (32.5 ± 0.7 vs. 26.8 ±
0.3 g; n
= 10, unpaired Student’s t test p = 8.9 × 10
−7) and fasting
plasma glucose levels (7.7 ± 0.2 vs. 6.6 ± 0.5 mmol L
−1; p
= 4.3 ×
10
−5) compared to controls (Fig.
1
b, c). More importantly, they
had higher levels of fasting plasma insulin (234.0 ± 4.9 vs. 118.7 ±
3.3 pmol L
−1; unpaired Student’s t test p = 6.1 × 10
−14) causing a
significant increase of homeostatic model assessment of insulin
resistance (HOMA-IR) score (80.0 ± 2.1 vs. 34.9 ± 1.6; p
= 8.4 ×
10
−13) resembling a model of peripheral insulin resistance
(Fig.
1
d, e). Next, we investigated hippocampus-dependent
learning and memory in the offspring of insulin-resistant
mothers. In the Morris water maze (MWM), F1HFD
mice showed
higher latency to reach the hidden platform starting from the
second day of training (30.9 ± 1.8 vs. 19.0 ± 2.2 s for day 2; 23.3 ±
2.0 vs. 11.3 ± 1.9 s for day 3; 19.1 ± 2.6 vs. 8.3 ± 1.1 s for day 4;
n
= 10, unpaired Student’s t test p < 0.001 for each day; Fig.
2
a).
During the probe test, they also spent less time than controls
(i.e., mice born to SD-fed mice) in the target quadrant (time in
the target quadrant: 24.6 ± 1.7 vs. 39.6 ± 1.8 s, unpaired Student’s
t test p
= 7.27 × 10
−6; time in the four quadrants: North–East
(NE) vs. South–East (SE), one-way analysis of variance (ANOVA)
p
= 0.078 for F1HFD; Fig.
2
b). The F1HFD
mice also showed less
preference than controls for the novel object in the novel object
recognition (NOR) test (69.2 ± 0.4% vs. 56.5 ± 0.8%; n
= 10,
unpaired Student’s t test p = 3.55 × 10
−11; Fig.
2
c). Accordingly,
we found a significant reduction of long-term potentiation (LTP)
at the CA3–CA1 hippocampal synapses in slices from F1HFD
mice
(field excitatory postsynaptic potential (fEPSP) amplitude
poten-tiation: 57.9 ± 6.7% vs. 91.9 ± 7.2%, p
= 0.0016; fEPSP slope:
52.6 ± 9.8% vs. 102.2 ± 9.2%, p
= 0.0008; n = 14 for SD and n =
12 for HFD; unpaired Student’s t test Fig.
2
d). Notably, weight,
food consumption, glucose and insulin plasma levels, and insulin
sensitivity were not significantly different between F1HFD
and SD
mice (Fig.
2
e–h and Supplementary Fig. 1a).
HFD alters the cognitive functions of descendants. Male
off-spring of HFD mothers was crossed with control, SD-fed, females
and their descendants were studied until the third generation that
had no contacts with the dysmetabolic environment of the
ancestor
18. We chose to investigate the paternal inheritance
because recent evidence pointed out the critical role of male
germline in the multigenerational transmission of HFD
effects
6,19.
F2HFD
and F3HFD
mice exhibited a cognitive impairment
comparable to F1HFD
mice, as assessed by LTP and
hippocampus-dependent learning and memory tasks. Specifically, in the MWM
test both F2HFD
and F3HFD
mice took longer times to
find the
platform (F2HFD
and F3HFD: unpaired Student’s t test p < 0.05
from the day 2; n
= 9 for F2 and n = 8 for F3; Fig.
3
a, d) and
explored the target quadrant less than controls (F2HFD: 22.9 ± 3.2
vs. 34.1 ± 2.4 s, p
= 0.0097; F3HFD: 21.9 ± 1.1 vs. 29.3 ± 0.5 s,
unpaired Student’s t test p = 1.6 × 10
−5; Fig.
3
b, e).
Similarly, in the NOR test both F2HFD
and F3HFD
mice showed
lower preference index than controls (F2HFD: 54.6 ± 0.6% vs.
68.8 ± 0.3%, p
= 1.6 × 10
−11; F3HFD: 55.8 ± 0.9% vs. 68.7 ± 1.0%,
unpaired Student’s t test p = 1.6 × 10
−8; n
= 9 for F2 and n = 8
for F3; Fig.
3
c, f). The progeny of HFD mothers also exhibited a
decrease in LTP similar to that observed in F1HFD
mice (F2HFD:
fEPSP amplitude, 35.8 ± 5.1% vs. 78.3 ± 8.3%, p
= 0.0002; fEPSP
slope, 35.9 ± 6.0% vs. 94.6 ± 10.1%, p
= 0.00005; n = 12 for SD
and n
= 11 for F2HFD; F3HFD: fEPSP amplitude, 45.7 ± 4.8% vs.
94.7 ± 8.6%, p
= 2.9 × 10
−5; fEPSP slope, 44 ± 6% vs. 96 ± 10.7%,
p
= 0.0002; n = 15 for SD and n = 14 for F3HFD; unpaired
Student’s t test; Fig.
3
g, h).
To investigate whether the multigenerational effects of HFD
were sex specific, we also assessed the performance of F2HFD
and
F3HFD
female mice in the NOR test and we found no significant
differences with impairment of hippocampus-dependent memory
observed in the male progeny (Supplementary Fig. 2a). Finally, to
test whether the mothers’ overnutrition during lactation played a
critical role in the intergenerational transmission of HFD
detrimental effects, we set up another experimental model in
which mothers were fed with HFD until the birth of pups, then
they were switched to SD during lactation. The F1HFD
male mice
were then mated with control females and their descendants,
named F2HFD NL
(i.e., no lactation) and F3HFD NL
mice, were
subjected to the NOR test. The cognitive impairment exhibited by
the descendants of HFD mothers undergoing this shortened
overnutrition protocol was not significantly different from what
observed in our typical experimental model, thus suggesting that
the detrimental effects of HFD are primarily exerted during
pregnancy with no significant contribution of the lactation period
(Supplementary Fig. 2b). Collectively, our
findings suggest that
maternal insulin resistance occurring in the critical phase of
embryo development multigenerationally impairs brain functions
in the adulthood.
HFD multigenerationally reduces Bdnf expression. To gain
insight into the mechanisms underlying the altered hippocampal
plasticity in HFD mothers’ descendants, we analyzed the expression
of a large number of plasticity-related genes in hippocampal
extracts of F1HFD, F2HFD, and F3HFD
mice. Real-time PCR
(RT-PCR) array revealed either upregulation or downregulation of
several genes in all generations of F0 HFD descendants
(Supple-mentary Table 1). Remarkably, the transcription of genes coding for
the neurotrophic factors BDNF and nerve growth factor was
reduced in F0 HFD progeny (Supplementary Fig. 3a). However,
Bdnf was the only gene whose inhibition was statistically significant
in all the three generations (F1HFD:
−479%, F2HFD:
−285%, F3HFD:
−402%; n = 4; Supplementary Fig. 3a).
Bdnf gene has a complex structure in both humans and
mice
20–22with multiple exons whose expression is regulated by
different stimuli, including neuronal activity and stressful
conditions
23–25. We analyzed the expression of Bdnf transcripts
in all generations and found a significant reduction of exons I, IV,
and IXa in the hippocampus of all F0 HFD descendants (F3.09
=
30.22 for exon I, F1HFD
vs. SD p
= 0.00028, F2HFD
vs. SD p
=
0.00026, F3HFD
vs. SD p
= 0.00012; F3.09
= 5.57 for exon IV, F1HFD
vs. SD p
= 0.021, F2HFD
vs. SD p
= 0.038, F3HFD
vs. SD p
= 0.021;
F3.09
= 21.29 for exon IXa, F1HFD
vs. SD p
= 6.62 × 10
−8, F2HFD
vs.
SD p
= 0.00038, F3HFD
vs. SD p
= 0.0014; n = 6; one-way
ANOVA; Fig.
4
a). Bdnf expression was significantly
down-regulated in neurons, as indicated by single-cell analysis
performed on mRNAs extracted from hippocampal CA1 neurons
of SD and F1HFD
mice (−77%, unpaired Student’s t test p =
0.0016; n
= 3; Supplementary Fig. 3b, c). Accordingly, BDNF
protein levels were also decreased in hippocampi of F0 HFD
F0 HFD
a
b
c
d
e
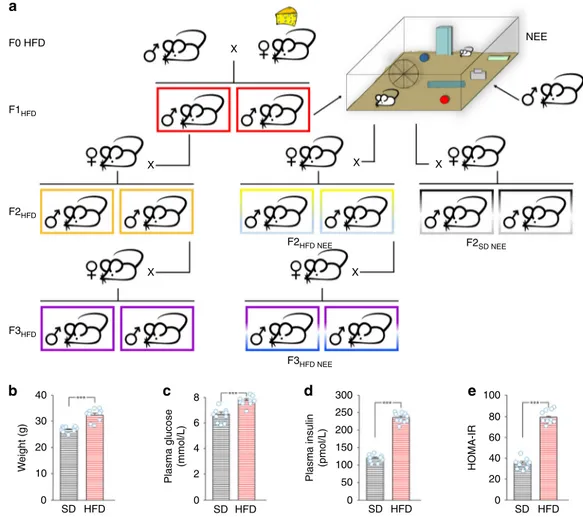
NEE F1HFD F2HFD F3HFD NEE F2HFD NEE F2SD NEE X X X X X X F3HFD 40 8 300 100 80 60 40 20 0 250 200 150 100 50 0 6 4 2 0 30 20 W eight (g) Plasma glucose (mmol/L) Plasma insulin (pmol/L) HOMA-IR 10 0 SD HFD SD HFD SD HFD SD HFDFig. 1 Experimental model. a Female mice (F0) were fed with either standard or high-fat diet (F0 SD and F0 HFD, respectively) for 4 weeks before mating
with control males fed with SD. Unless otherwise specified, HFD was maintained during the pregnancy and until the second week of lactation. The offspring
(F1HFD) and descendants (F2HFDand F3HFD) were always fed with SD. F1HFDand F2HFDmale mice were mated with control females to generate F2HFDand
F3HFDmice, respectively. A subgroup of F1HFDmice was exposed to novel enriched environment (NEE) for 4 weeks after the weaning. Subsequently,
they were mated with control females to generate F2HFDNEE mice. F2HFDNEE male mice were mated with control females to generate F3HFDNEE mice.
b Weight, c fasting glucose plasma levels, d fasting insulin plasma levels, and e HOMA-IR score of SD and HFD female mice after 4 weeks of dietary regimen (n = 10 for each group; statistics by unpaired Student’s t test). Data are expressed as mean ± standard error of the mean (SEM). ***p < 0.001
progeny (F2.94
= 157.59, F1HFD
vs. SD p
= 5.15 × 10
−10, F2HFD
vs.
SD p
= 8.28 × 10
−10, F3HFD
vs. SD p
= 3.27 × 10
−11; n
= 8;
one-way ANOVA; Fig.
4
b) and independently of the dietary regimen
of F1 pups during lactation (Supplementary Fig. 2c). The
multigenerational effect of maternal overnutrition on Bdnf
expression could be due to the recurrence of
metabolism-related humoral alterations in each generation. To address this
issue, we
first analyzed weight, food consumption, plasma glucose
and insulin levels, and insulin sensitivity in F2HFD
and F3HFD
mice, and we did not
find significant changes compared to SD
mice (Supplementary Fig. 2d–h). All F0 HFD descendants also
showed locomotor activity comparable with control mice
(Supplementary Fig. 2i).
Later we tested the intriguing hypothesis that the
multi-generational reduction of Bdnf expression depended on epigenetic
inhibition occurring in both germline and hippocampus of all
descendants. Expression of Bdnf exons is
finely regulated by
epigenetic changes on multiple regulatory sequences
26,27.
Speci-fically, lysine 9 acetylation (H3K9ac) and lysine 4 trimethylation
(H3K4me3) on histone 3 tail promote exon transcription.
Therefore, we studied these epigenetic markers on the promoter
of exons I, IV, and IXa in the male gonads of F0 HFD progeny.
H3K9ac and H3K4me3 on the Bdnf promoters were critically
reduced in the germline of F0 HFD descendants (promoter I:
F3.09
= 31.83 for H3K9ac and F3.09
= 22.73 for H3K4me3, p <
0.001 for SD vs. all HFD generations; promoter IV: F3.09
= 31.64
for H3K9ac, p < 0.001 for SD vs. all HFD generations and F3.09
=
15.85 for H3K4me3, p < 0.01 for SD vs. all HFD generations;
promoter IX: F3.09
= 23.52 for H3K9ac, p < 0.001 for SD vs. all
HFD generations and F3.09
= 13.19 for H3K4me3, p < 0.01 for SD
vs. all HFD generations; n
= 6; one-way ANOVA; Fig.
4
c).
Accordingly, the expression of Bdnf exon I and XIa were
significantly inhibited in the male germline of HFD progeny
(exon I: F1HFD
= −61%, F2HFD
= −40%, F3HFD
= −48%; exon
Latency (s) Time in quadr ant (s) Pref erence inde x (%) 40a
b
c
d
e
f
g
h
45 80 70 60 50 40 30 20 10 0 SD F1HFD SD F1HFD SD F1HFD SD F1HFD SD F1HFD SD F1HFD SD F1HFD 40 35 30 25 20 15 10 5 0 NE SE SW NW NE SE SW NW 30 20 10 0 300 150 125 100 75 50 25 0 150 125 100 75 50 25 0 SD 1 2 1 2 5 ms 0.2 mV F1HFD 250fEPSP amplitude (% of baseline)
W eight (g) LTP amplitude (% of baseline) LTP slope (% of baseline) 200 150 100 40 F ood (g/die) Plasma glucose (mmol/L)
Plasma insulin (pmol/L)
5 8 180 180 120 90 60 30 0 6 4 2 0 4 3 2 1 0 30 20 10 0 –10 0 10 HFS Time (min) 20 30 40 50 60 1 2 Training (days) 1 2 3 SD F1HFD 4 n.s. n.s. n.s. n.s. n.s.
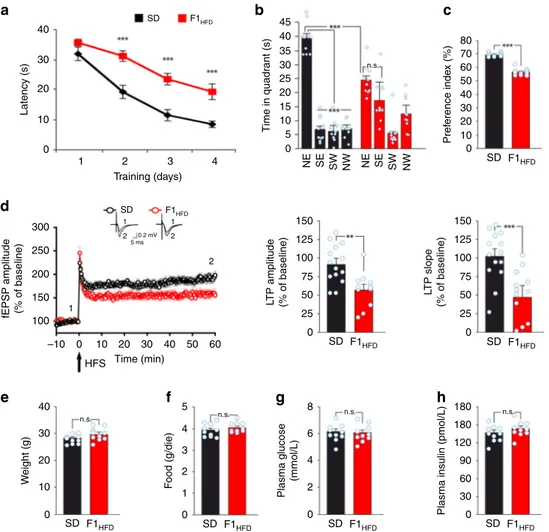
Fig. 2 Maternal HFD impairs hippocampal synaptic plasticity, learning, and memory. a Latency to reach the hidden platform in the MWM test for SD and F1HFDmice (n = 10 mice derived from 6 to 7 litters for each group; statistics by unpaired Student’s t test). b Time spent in the four quadrants during the
probe test performed on day 5 of MWM. North–East (NE) is the quadrant where the platform was placed during the training (target quadrant) (n = 10
mice derived from 6 to 7 litters for each group; statistics by unpaired Student’s t test for time in the target quadrant and one-way ANOVA and Bonferroni
post hoc for time in all quadrants).c Preference for the novel object in the NOR paradigm (n = 10 mice derived from 6 to 7 litters for each group; statistics
by unpaired Student’s t test). d On the left, time course of LTP at CA3–CA1 synapses induced by HFS delivered at time 0 (arrow) in hippocampal slices
obtained from SD mice (n = 14 slices from 5 mice of different litters) or F1HFD(n = 12 slices from 4 mice of different litters). Results are expressed as
percentages of baseline fEPSP amplitudes (=100%). Insets show representative fEPSPs at baseline (1) and during the last 5 min of LTP recordings (2).
Traces are averages of 5 consecutive responses at the time points indicated with 1 and 2. On the right, bar graphs showing LTP assessed by measuring
fEPSP amplitudes and slopes during the last 5 min in SD and F1HFDmice (statistics by unpaired Student’s t test). e Weight, f average food consumption,
g fasting glucose plasma levels, and h fasting insulin plasma levels of SD and F1HFDmice at the time point of behavioral tests (n = 10 mice derived from 6 to
7 litters for each group; statistics by unpaired Student’s t test) after 2 fasting hours. Data are expressed as mean ± SEM. **p < 0.01; ***p < 0.001; n.s. not significant
XIa: F1HFD
= −39%, F2HFD
= −33%; p < 0.01 for all groups vs.
SD; one-way ANOVA; Fig.
4
d). Moreover, mRNA expression of
BDNF coding exon IX appeared reduced in the germline as well
as in gastrocnemius muscle and heart of F1HFD
mice (−30; −57
and
−33%, respectively; Supplementary Fig. 3d). More
importantly, plasma BDNF protein levels were also significantly
reduced in all HFD progeny (Supplementary Fig. 3e).
The Bdnf regulatory sequences were also epigenetically
inhibited in the hippocampi of these mice (promoter I: F3.09
=
27.75 for H3K9ac and F3.09
= 29.53 for H3K4me3, p < 0.01 for SD
NE SE SW NW NE SE SW NW NE SE SW NW NE SE SW NW Latency (s) Latency (s) 40
a
b
c
d
g
h
e
f
Time in quadr ant (s) Pref erence inde x (%) 45 80 70 60 50 40 30 20 10 0 Pref erence inde x (%) 80 70 60 50 40 30 20 10 0 SD F2HFD SD F3HFD SD F2HFD SD F2HFD SD F3HFD SD F3HFD SD F3HFD SD F2HFD 40 35 n.s. n.s. 30 25 20 15 10 5 0 Time in quadr ant (s) 45 40 35 30 25 20 15 10 5 0 30 20 10 0 40 30 20 300 150 125 100 75 50 25 0 150 125 100 75 50 25 0 250 200 150 1 2 1 2 100 300 250 200 150 100 10 0 1 2 Training (days) 3 4 1 2 –10 0 10 20 30 40 50 60 SD 1 2 1 2 5 ms 0.2 mV F2HFD SD 1 2 1 2 5 ms 0.2 mV F3HFD Training (days) Time (min) HFS –10 0 10 20 30 40 50 60 Time (min) HFSfEPSP amplitude (% of baseline)
fEPSP amplitude (% of baseline)
LTP amplitude (% of baseline) 150 125 100 75 50 25 0 LTP amplitude (% of baseline) 150 125 100 75 50 25 0 LTP slope (% of baseline) LTP slope (% of baseline) 3 4
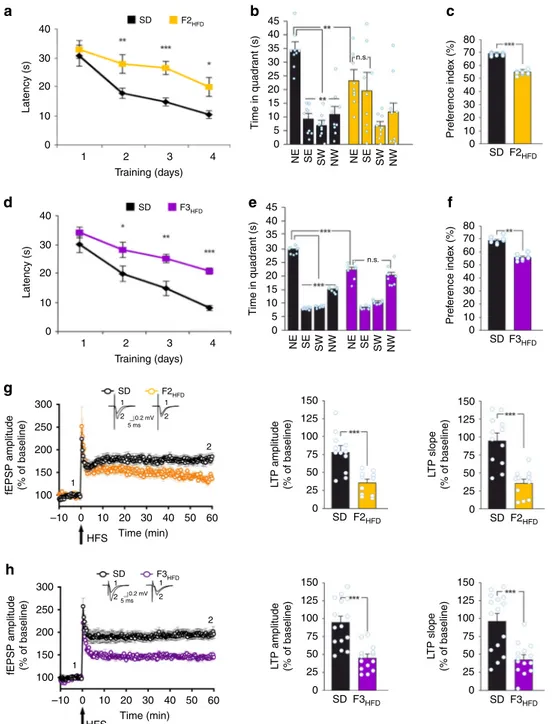
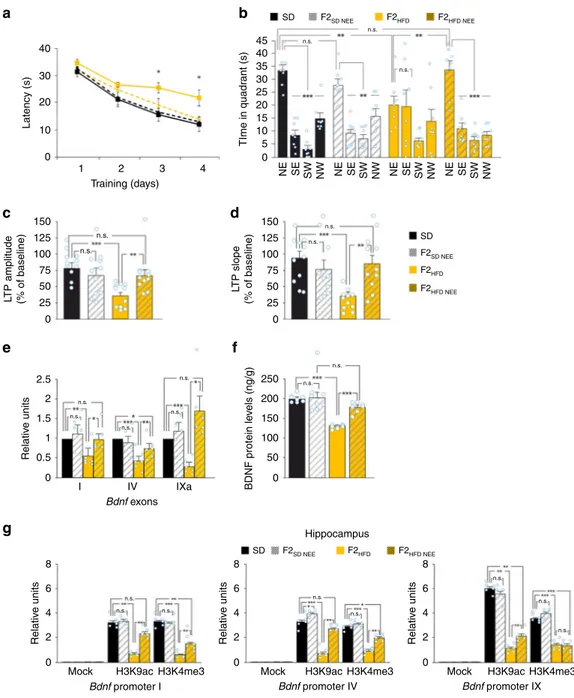
Fig. 3 Progenitor’s HFD affects cognitive functions until the third generation. a Latency to reach the hidden platform in the MWM test for SD and F2HFD
mice (n = 9 mice from 6 litters for each group; statistics by unpaired Student’s t test). b Time spent in the four quadrants during the probe test by SD and F2HFDmice. NE is the target quadrant (n = 9 mice from 6 litters for each group; statistics by unpaired Student’s t test for time in the target quadrant and
one-way ANOVA and Bonferroni post hoc for time in all quadrants).c Preference index in the NOR paradigm for SD and F2HFDmice (n = 9 mice from 6
litters for each group; statistics by unpaired Student’s t test). d Escape latency in MWM test for SD and F3HFDmice (n = 8 for each group; statistics by
unpaired Student’s t est). e Probe test of SD and F3HFDmice (n = 8 mice from 6 litters for each group; statistics by unpaired Student’s t test for time in the
target quadrant and one-way ANOVA and Bonferroni post hoc for time in all quadrants).f Preference index for SD and F3HFDmice (n = 8 mice from 6
litters for each group; statistics by unpaired Student’s t test). g Time course of LTP at CA3–CA1 synapses and bar graphs showing changes in fEPSP
amplitudes and slopes in SD (n = 12 slices from 4 mice of different litters) and F2HFD(n = 11 slices from 4 mice of different litters) mice, as described in
Fig.2d (statistics by unpaired Student’s t test). h LTP at CA3–CA1 synapses in SD (n = 15 slices from 5 mice of different litters) and F3HFD(n = 14 slices
from 5 mice of different litters) mice (statistics by unpaired Student’s t test). Data are expressed as mean ± SEM. *p < 0.05; **p < 0.01; ***p < 0.001; n.s. not significant
vs. all HFD generations; promoter IV: F3.09
= 15.69 for H3K9ac,
p < 0.01 for SD vs. all HFD generations and F3.09
= 35.69 for
H3K4me3, p < 0.001 for SD vs. all HFD generations; promoter IX:
F3.09
= 20.65 for H3K9ac, p < 0.01 for SD vs. all HFD generations
and F3.09
= 37.84 for H3K4me3, p < 0.001 for SD vs. all HFD
generations; n
= 6; one-way ANOVA Fig.
4
e), whereas both
H3K9ac and H3K4me3 were not significantly modified on the
promoters III and VI of Bdnf gene (Supplementary Fig. 3f).
Moreover, to investigate whether the intergenerational effects
of HFD were mediated by changes in maternal behavior and to
differentiate between gametic and somatic transmission of the
phenotype, we performed cross-fostering (CF) and in vitro
fertilization (IVF) experiments. Both F1HFD
mice fostered by
control females (hereinafter named F1HFD
CF) and mice
generated by fertilizing control oocytes with sperm of F1HFD
mice (hereinafter named F2HFD
IVF) showed behavioral and
Relativ e units Relativ e units Relativ e units Relativ e units Relativ e units 2.5 BDNF protein le v els (ng/g) 250 200 150 100 50 0 Hippocampus
a
b
c
d
e
Hippocampus Germline Germline SD F1 HFD F2HFD F3HFD 2 1.5 1 0.5 0 8 6 4 2 0 2.5 2 1.5 1 0.5 8 6 4 2 0 Relativ e units 8 6 4 2 0 Relativ e units 8 6 4 2 0 0 8 6 4 2 0 Relativ e units 8 6 4 2 0 I II III IV V n.s. n.s. n.s. Bdnf exonsVI VII VIII IXa
Mock H3K9ac I VI IXa Bdnf promoter I Bdnf exons H3K4me3 Mock H3K9ac Bdnf promoter I
H3K4me3 Mock H3K9ac
Bdnf promoter IV
H3K4me3 Mock H3K9ac
Bdnf promoter IX H3K4me3 Mock H3K9ac
Bdnf promoter IV
H3K4me3 Mock H3K9ac
Bdnf promoter IX H3K4me3
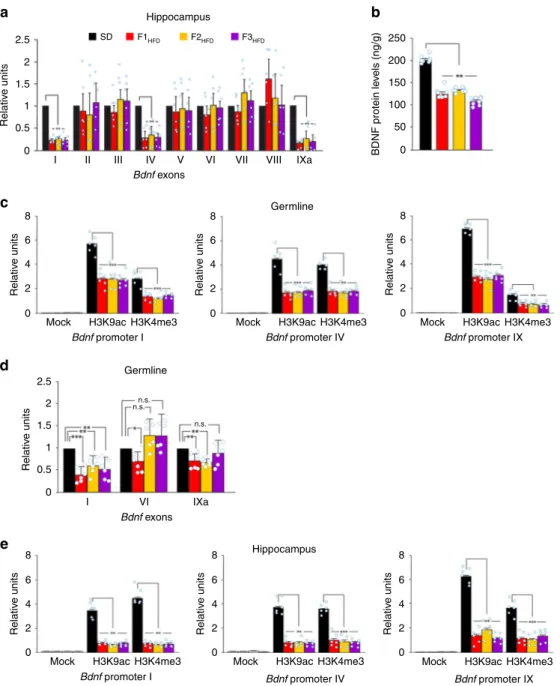
Fig. 4 Progenitor’s HFD multigenerationally decreases Bdnf expression via epigenetic mechanisms. a Expression of Bdnf exons in the hippocampus of SD
mice and F0 HFD descendants. Gene expression was normalized to actin. Data represent mean values obtained from six mice derived fromfive litters for
each group; experiments were performed in triplicate (statistics by one-way ANOVA and Bonferroni post hoc).b BDNF levels in the hippocampus of SD
mice and F0 HFD descendants. ELISA assay was performed in duplicate (n = 8 mice derived from 5 litters per group; statistics by one-way ANOVA and
Bonferroni post hoc).c Chromatin immunoprecipitation (ChIP) assays of histone 3 lysine 9 acetylation (H3K9ac) and histone 3 lysine 4 trimethylation
(H3K4me3) on the promoters I, IV, and IX of Bdnf gene in the germline of SD and F0 HFD descendant male mice. qPCR experiments were performed in triplicate (n = 6 mice derived from 5 litters for each group; statistics by one-way ANOVA and Bonferroni post hoc). d Bdnf exon expression in the germline of SD and F0 HFD descendant male mice. Exons II, III, IV, V, VII, and VIII were not detectable. Experiments were performed in triplicate (n = 6 mice derived
from 5 litters for each group; statistics by one-way ANOVA and Bonferroni post hoc).e ChIP assays of H3K9ac and H3K4me3 on the promoters I, IV, and
IX of Bdnf gene in the hippocampus of SD and F0 HFD descendant male mice. Experiments were performed in triplicate (n = 6 mice derived from 5 litters for each group; statistics by one-way ANOVA and Bonferroni post hoc). Data are expressed as mean ± SEM. *p < 0.05; **p < 0.01; ***p < 0.001; n.s. not significant
molecular alteration similar to F1HFD
animals raised by F0 HFD
mothers (Supplementary Fig. 4a–d, e–h). Collectively, our data
demonstrated that progenitor’s HFD intergenerationally
down-regulated BDNF at multi-organ level by epigenetically inhibiting
the expression of the neurotrophic factor through a gametic
mechanism.
NEE blocks the multigenerational transmission of HFD effects.
Lifestyle (e.g., stress, social interaction, diet) has been shown to
influence cognitive functions
28–30. In particular, NEE has been
proposed to counteract the detrimental effects of HFD on brain
health
31. We investigated the possibility to break the
transge-nerational transmission of cognitive impairment due to the
pro-genitor’s overnutrition by exposing F1HFD
male mice to NEE
(F1HFD
NEE) for 4 weeks before mating (Fig.
1
a). We then studied
the second generation (F2HFD NEE
mice), sharing with F2HFD
mice
the same HFD ancestor but being descendant of F1HFD
males
grown in NEE. The cognitive performance of F2HFD NEE
mice was
compared with those of F2HFD, SD, and F2SD NEE
mice born from
SD mice exposed to NEE. In SD descendants, paternal exposure to
NEE did not significantly change learning, memory, and
hippo-campal synaptic plasticity compared to controls (time in the target
quadrant: F3.07
= 5.2, F2SD NEE
vs. SD, p
= 0.093; fEPSP
ampli-tude: F2.92
= 4.78, F2SD NEE
vs. SD, p
= 0.44; two-way ANOVA).
Interestingly enough, F2HFD NEE
mice showed an almost complete
rescue of cognitive functions assessed by the MWM (day 4:
F3.07
= 6.74, F2HFD NEE
vs. F2HFD, p
= 0.034; time in the target
quadrant: F3.07
= 4.78, F2HFD NEE
vs. F2HFD, p
= 0.0098; n = 8;
two-way ANOVA; Fig.
5
a, b). Accordingly, LTP of F2HFD NEE
mice was significantly higher than that observed in F2HFD
mice
(fEPSP amplitude: 67.6 ± 9.6% vs. 36.7 ± 5.3%, F2.92
= 5.62, p =
0.009; fEPSP slope: 87.5 ± 13.7% vs. 41 ± 5.9%, F2.92
= 6.54, p =
0.005, n
= 11; two-way ANOVA; Fig.
5
c, d).
We also found that Bdnf expression in hippocampi of F2HFD
NEE
mice was significantly higher than that of F2HFD
mice at both
mRNA (F3.28
= 9.27 for exon I, p = 0.014; F3.28
= 20.72 for exon
IV, p
= 0.0072; F3.28
= 7.57 for exon IXa, p = 0.019; n = 6;
two-way ANOVA; Fig.
5
e) and protein levels (F3.07
= 24.45, p =
1.28 × 10
−6, n
= 8; two-way ANOVA; Fig.
5
f). NEE has been
demonstrated to regulate Bdnf expression via epigenetic changes
on loci closely related to those we studied
32. We therefore
analyzed H3K9ac and H3K4me3 on Bdnf promoters I, IV, and IX
in hippocampal extracts of F2HFD
NEE mice and found an almost
complete rescue of histone epigenetic activation on the regulatory
sequences of exons I and IV (promoter I: F3.28
= 8.09 for H3K9ac,
F2HFD NEE
vs. F2HFD
p
= 0.0085, SD vs. F2HFD NEE
p
= 0.18,
F3.28
= 26.81 for H3K4me3, F2HFD NEE
vs. F2HFD
p
= 0.0093, SD
vs. F2HFD NEE
p
= 0.0034; promoter IV: F3.28
= 18.15 for H3K9ac,
F2HFD NEE
vs. F2HFD
p
= 0.016, SD vs. F2HFD NEE
p
= 0.73,
F3.28
= 26.2 for H3K4me3, F2HFD NEE
vs. F2HFD
p
= 0.0034, SD
vs. F2HFD NEE
p
= 0.031; promoter IX: F3.28
= 35.56 for H3K9ac,
F2HFD NEE
vs. F2HFD
p
= 0.0015, SD vs. F2HFD NEE
p
= 0.0028,
F3.28
= 23.06 for H3K4me3, F2HFD NEE
vs. F2HFD
p
= 0.99, SD vs.
F2HFD NEE
p
= 0.00031; n = 6; two-way ANOVA; Fig.
5
g). To
determine whether NEE induced epigenetic changes on the
germline of F1HFD
mice, we analyzed both H3K9ac and
H3K4me3 on Bdnf regulatory sequences before and after
exposure to NEE. We found significant changes of these
epigenetic marks on Bdnf promoters I and IV in the germline
of F1HFD
NEE mice compared to F1HFD
animals (promoter I:
F3.28
= 13.29 for H3K9ac, p = 0.0034, F3.28
= 11.96 for H3K4me3,
p
= 0.015; promoter IV: F3.28
= 11.32 for H3K9ac, p = 0.0069,
F3.28
= 9.12 for H3K4me3, p = 0.014; n = 6; two-way ANOVA;
Supplementary Fig. 5a). Accordingly, we detected
NEE-dependent rescue of learning and memory in F3HFD NEE
mice
similar to what observed in F2HFD NEE
generation (day 4 of
MWM: F3.63
= 36.69, F3HFD NEE
vs. F3HFD
p
= 8.43 × 10
−5; time
in target quadrant: F3.63
= 28.88, F3HFD NEE
vs. F3HFD
p
= 1.66 ×
10
−4; n
= 9; two-way ANOVA; Supplementary Fig. 5b).
Collec-tively, our
findings suggested that both maternal HFD and
paternal exposure to NEE multigenerationally influenced
cogni-tive functions of F0 HFD descendants and regulated Bdnf
expression via common epigenetic mechanisms.
HFD affects histone acetyl-transferase/histone deacetylase
(HAT/HDAC) binding to Bdnf promoters in the ovaries. To
understand the molecular events triggering the intergenerational
transmission of HFD-dependent cognitive impairment, we
investigated the expression and activation of the key nutrient
sensors cAMP response element binding (CREB) and forkhead
box protein O3a (FOXO3a) in the ovaries of mothers after
4 weeks of HFD. Both transcription factors CREB and FOXO3a
were hypophosphorylated (−76.5%, p = 6.36 × 10
−5and
−52.3%,
p
= 0.004, respectively; n = 8; unpaired Student’s t test) in the
female gonads upon HFD, leading to CREB inhibition and
FOXO3a activation (Fig.
6
a). A common molecular cascade
impinging on both CREB and FOXO transcriptional activity is
the BDNF/Tropomyosin receptor kinase B (TrkB) signaling
33,34.
Therefore, we measured plasma BDNF levels and TrkB receptor
activation in the ovaries of HFD-fed female mice before mating.
Strikingly, we found both lower plasma BDNF levels (33.9 ± 3.8
vs. 47.6 ± 4.4 pg mL
−1, p
= 0.025; n = 8; unpaired Student’s t test;
Fig.
6
b) and significant reduction of ovarian TrkB
phosphoryla-tion in insulin-resistant mothers compared to controls (−55.2%,
n
= 7; Fig.
6
c). Dephosphorylation of FOXO transcription factors
may be due to alteration of insulin signaling in the tissues
35.
Accordingly, we found higher levels of inhibitory
phosphoryla-tion of insulin receptor substrate 1 (pIRS1
Ser612), a marker of
insulin resistance, in the ovaries of HFD-fed females (+54.7%,
n
= 7; Fig.
6
c). Since FOXO3a dephosphorylation promotes
nuclear translocation of this transcription factor and may affect
its interaction with chromatin remodelers, we investigated its
binding with HDAC2 and SIRT2 in the ovaries. HFD females
showed higher levels of protein complexes FOXO3a/SIRT2 and
FOXO3a/HDAC2 in the gonads (n
= 3; Fig.
6
d). Finally, we
analyzed the binding of chromatin remodelers interacting with
CREB and FOXO3a on the regulatory sequences of Bdnf gene in
the ovaries. We found lower levels of acetyl transferase
CREB-binding protein (CBP) on Bdnf promoters I and IV (−43 and
−46%, respectively; n = 6, p < 0.05 for each promoter) and higher
binding of histone deacetylases HDAC2 and SIRT2 on promoters
I and IV in the gonads of F0 HFD female mice (promoter I:
SIRT2
+118%, HDAC2 +105%, p < 0.01; promoter IV: HDAC2
+156%, Mann–Whitney test p < 0.01; Fig.
6
e).
BDNF counteracts the intergenerational effects of HFD. To dip
inside the critical role of BDNF signaling alteration in
HFD-dependent mother to offspring transmission of cognitive
impairment, we intraperitoneally (IP) injected HFD-fed female
mice with BDNF (3 times per week for 4 weeks) as long as they
fed HFD until the breeding (hereinafter named F0 HFD BDNF).
As expected, ovarian TrkB
Tyr816phosphorylation in F0 HFD
BDNF mothers was similar to control females and significantly
higher than that observed in F0 HFD dams (F6.94
= 10.03, F0
HFD BDNF vs. F0 HFD p
= 0.032, F0 HFD BDNF vs. SD p =
0.51; n
= 3; two-way ANOVA; Fig.
7
a). BDNF administration
exerted anorectic effects on HFD-fed mice, as indicated by both
reduced weight gain and calorie intake of F0 HFD BDNF females
(Fig.
7
b and Supplementary Fig. 6a). However, administration of
peripheral insulin resistance, as shown by the plasma levels of
insulin, glycemia, and HOMA index (Fig.
7
c and Supplementary
Fig. 6a), nor did it rescue the hyperphosphorylation of ovarian
IRS1
Ser612(Fig.
7
d). More importantly, the offspring of F0 HFD
BDNF females (i.e., F1HFD BDNF
mice) showed cognitive
perfor-mances significantly higher than F1HFD
animals and comparable
to controls when evaluated in MWM (day 4: F3.63
= 10.79, F1HFD
BDNF
vs. F1HFD
p
= 0.035, F1HFD BDNF
vs. SD p
= 0.15; time in
target quadrant: F1HFD BDNF
vs. F1HFD
p
= 0.035, F1HFD BDNF
vs.
SD p
= 0.15; n = 8; two-way ANOVA; Fig.
7
e). Moreover, they
showed a greater preference index than F1HFD
mice (F3.63
=
13.92, F1HFD BDNF
vs. F1HFD
p
= 0.012, F1HFD BDNF
vs. SD p
=
0.032; n
= 8; two-way ANOVA; Fig.
7
f). We also found an almost
complete rescue of Bdnf exon I, IV, and IXa expression in the
Latency (s) Relativ e units Relativ e units BDNF protein le v els (ng/g) LTP amplitude (% of baseline) LTP slope (% of baseline) 40
a
b
c
e
g
f
d
TIme in quadr ant (s) 45 SD n.s. n.s. n.s. n.s. n.s. n.s. n.s. n.s. n.s. n.s. n.s. n.s. n.s. n.s. n.s. n.s. n.s. n.s. n.s. n.s. n.s. n.s. F2SD NEE F2HFD F2HFD NEE SD F2 SD NEE F2HFD F2HFD NEE 40 35 30 25 20 15 SD F2SD NEE F2HFD NEE F2HFD 10 5 0 NE SE SW NW NE SE SW NW NE SE SW NW NE SE SW NW 30 20 10 0 150 125 100 75 50 25 2.5 8 6 4 2 0 Relativ e units 8 6 4 2 0 Relativ e units 8 6 4 2 0 250 200 150 100 50 0 Hippocampus 2 1.5 1 0.5 0 0 Bdnf exons 150 125 100 75 50 25 0 1 2 Training (days) I Mock H3K9ac Bdnf promoter IH3K4me3 Mock H3K9ac
Bdnf promoter IV
H3K4me3 Mock H3K9ac
Bdnf promoter IX H3K4me3 IV IXa
3 4
Fig. 5 NEE blocks the multigenerational transmission of HFD-dependent cognitive impairment. a Latency to reach the hidden platform in the MWM test for SD, F2SDNEE, F2HFD, and F2HFDNEE mice (see Fig.1for the experimental design; n = 8 mice derived from 6 litters for each group; significance is indicated
between F2HFDand F2HFDNEE mice; statistics by two-way ANOVA and Bonferroni post hoc).b Time spent in the four quadrants during the probe test of
MWM by SD, F2SDNEE, F2HFD, and F2HFDNEE mice. NE is the target quadrant (n = 8 mice derived from 6 litters for each group; statistics by two-way
ANOVA and Bonferroni post hoc).c Bar graphs showing changes in fEPSP amplitudes and d slopes in SD, F2SDNEE, F2HFD, and F2HFDNEE mice (n =
11 slices from 4 mice of different litters per each group; statistics by two-way ANOVA and Bonferroni post hoc).e Bdnf exon I, IV, and IXa expression
(normalized to actin) in the hippocampus of SD, F2SDNEE, F2HFD, and F2HFDNEE mice. Data represent mean values obtained from six mice derived from
five litters for each group; experiments were performed in triplicate (statistics by two-way ANOVA and Bonferroni post hoc). f BDNF levels in the
hippocampus of SD, F2SDNEE, F2HFD, and F2HFDNEE mice. ELISA assay was performed in duplicate (n = 8 mice derived from 5 litters per group; statistics
by two-way ANOVA and Bonferroni post hoc).g ChIP assays of H3K9ac and H3K4me3 on the promoters I, IV, and IX of Bdnf gene in the hippocampus of
SD, F2SDNEE, F2HFD, and F2HFDNEE mice. Data represent mean values obtained from 6 mice derived from 4 to 5 litters for each group; qPCR experiments
were performed in triplicate (statistics by two-way ANOVA and Bonferroni post hoc). Data are expressed as mean ± SEM. *p < 0.05; **p < 0.01; ***p < 0.001; n.s. not significant
F0 SD F0 SD #1 Kd
a
b
d
e
c
IB: α- pCREB 2 1.5 1 0.5 0 2 1.5 1 0.5 0 2 1.5 1 0.5 0 3.5 2 1.5 1 0.5 0 3 2.5 2 1.5 1 0.5 0 2 1.5 1 0.5 0 2 1.5 1 0.5 0 IB: α- CREB IB: α- pFOXO3a IB: α- FOXO3a IB: α- SIRT2 IB: α- SIRT1 IB: α- ACTIN IB: α- pTrKB IB: α- SIRT2 IB: α- HDAC2 IB: α- FOXO3a IB: α- SIRT2 IB: α- HDAC2 IB: α- FOXO3a n.s. n.s. n.s. n.s. IB: α- TrKB IB: α- pIRS1 IB: α- IRS1 IB: α- ACTIN 100 80 60 40 20 0 37 50 100 37 50 100 Kd 50 50 100 100 50 100 50 100 100 150 150 50 #2 #3 #4 #1 #2 #3 #4 F0 HFD F0 HFD F0 SD F0 HFD pCREB/CREB (relativ e units) Plasma BDNF (pg/mL) IP: α - FO XO3a T otal lysates pFO XO3a/FO XO3a (relativ e units) pT rkB/T rk B (relativ e units) FO XO3a/HD A C 2 comple x (r .u.) 3.5 3 2.5 2 1.5 1 0.5 0 Mock CBP Bdnf promoter ISIRT2 HDAC2 Mock CBP
Bdnf promoter IV
SIRT2 HDAC2 Mock CPB
Bdnf promoter IX SIRT2 HDAC2 Relativ e units 3.5 3 2.5 2 1.5 1 0.5 0 Relativ e units 3.5 3 2.5 2 1.5 1 0.5 0 Relativ e units FO XO3a/SIR T2 comple x (r .u.) pIRS1/IRS1 (relativ e units) SIR T2 (relativ e units) F0 SD #1 Kd #2 #3 #1 #2 #3 F0 HFD F0 SD #1 #2 #3 #1 #2 #3 F0 HFD IgG
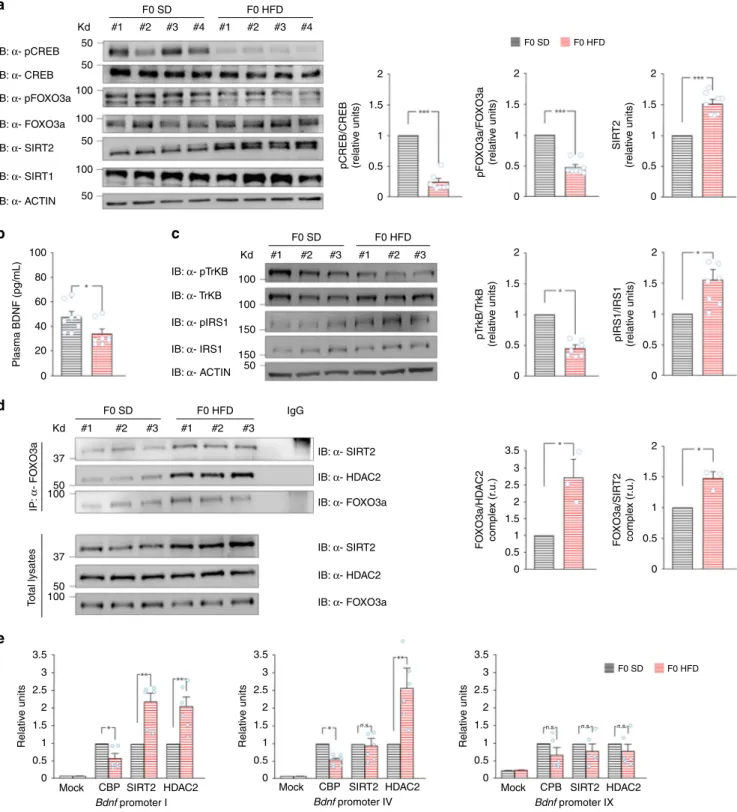
Fig. 6 HFD affects HAT/HDAC recruitment on Bdnf promoters in ovaries. a Immunoblots and bar graphs of both CREBSer133and FOXO3aSer256
phosphorylation and sirtuin expression in the ovaries from F0 SD and F0 HFD female mice (n = 8 per group; statistics by unpaired Student’s t test).
Samples were harvested from two independent experiments.b BDNF plasma levels of F0 SD and F0 HFD female mice measured by ELISA performed in
duplicate (n = 8 mice per group; statistics by unpaired Student’s t test). c Immunoblots (left) and bar graphs (right) of both TrkBTyr816and IRS1Ser612
phosphorylation in the ovaries from F0 SD and F0 HFD mothers (n = 7 per group; statistics by Mann–Whitney test). Samples were harvested from two
independent experiments.d Immunoblots (left) and densitometry (right) of FOXO3a interaction with both SIRT2 (top) and HDAC2 (middle) in the ovaries
from F0 SD and F0 HFD mice (n = 3 per group; statistics by Mann–Whitney test). At the bottom, tissue lysates probed with SIRT2, HDAC2, and
α-FOXO3a.e ChIP assays of CBP, SIRT2, and HDAC2 binding on the promoters I, IV, and IX of Bdnf gene in the gonads of F0 SD and F0 HFD female mice.
Data represent mean values obtained from six mice for each group; qPCR experiments were performed in triplicate (statistics by Mann–Whitney test).
hippocampus of F1HFD BDNF
mice (F4.1
= 40.07 for exon I, F1HFD
BDNF
vs. F1HFD
p
= 0.0018; F4.1
= 17.97 for exon IV, F1HFD BDNF
vs. F1HFD
p
= 0.00039; F4.1
= 49.23 for exon IXa, F1HFD BDNF
vs.
F1HFD
p
= 0.00067; n = 6; two-way ANOVA; Fig.
7
g).
Accord-ingly, epigenetic marker activation on the regulatory sequences of
Bdnf gene were higher in the hippocampus of F1HFD BDNF
mice
compared to that in F1HFD
(promoter I: F4.1
= 14 for H3K9ac,
p
= 0.0051, F4.1
= 28.75 for H3K4me3, p = 0.0013; promoter IV:
F4.1
= 74.19 for H3K9ac, p = 0.00011, F4.1
= 43.49 for H3K4me3,
p
= 0.00045; promoter IX: F4.1
= 13.71 for H3K9ac, p = 0.0074,
F4.1
= 70.99 for H3K4me3, p = 6.2 × 10
−5; n
= 6; two-way
ANOVA; Fig.
7
h). Collectively, our
findings reveal a critical
role of BDNF signaling in the mother to offspring transmission of
HFD-dependent cognitive deficits.
p66Shc deficiency abolishes HFD intergenerational effects. To
investigate the causative role of maternal insulin resistance in the
intergenerational transmission of HFD-related changes of brain
function, we used p66Shc knockout (KO) mice. p66Shc is one of
F0 SDa
b
c
d
e
f
g
h
300 250 200 150 100 50 40 30 20 10 0 80 Relativ e units 2.5 2 1.5 1 0.5 0 I IV Bdnf exons IXa 70 60 50 40 30 20 10 0 8 7 6 5 4 3 2 1 0 Mock H3K9ac Bdnf promoter IH3K4me3 Mock H3K9ac Hippocampus
Bdnf promoter IV
H3K4me3 Mock H3K9ac Bdnf promoter IX H3K4me3 0 F0 SD 1# – Kd 100 100 50 BDNF IB: α- pTrKB IB: α- TrKB IB: α- ACTIN Kd 150 150 45 40 35 30 25 20 15 10 5 0 NE SE SW NW NE SE SW NW NE SE SW NW 50 BDNF IB: α- pIRS1 IB: α- IRS1 IB: α- ACTIN 1 2 Training (days) 3 4 n.s.
Plasma insulin (pmol/L)
Latency (s) Pref erence inde x (%) Relativ e units 8 7 6 5 4 3 2 1 0 Relativ e units 8 7 6 5 4 3 2 1 0 Relativ e units Time in quadr ant (s) – – – – – + + + 2# 3# 1# 2# 3# 1# 2# 3# F0 HFD F0 HFD F0 HFD BDNF SD F1HFD F1HFD BDNF SD F1HFD F1HFD BDNF pT rkB/T rk B (relativ e units) pIRS1/IRS1 (relativ e units) 2 W eight (g) 40 30 20 10 0 n.s. n.s. n.s. n.s. n.s. n.s. n.s. n.s. n.s. 2.5 2 1.5 1 0.5 0 1.5 1 0.5 0 F0 SD 1# – 2# 3# 1# 2# 3# 1# 2# 3#– – – – – + + + F0 HFD
the three isoforms of the adaptor protein family ShcA mediating
insulin sensitivity in tissues
36. Ranieri et al. found that p66Shc
deficiency induced a protective effect in lepOb/Ob mice, an
established genetic model of obesity and insulin resistance
with-out affecting (hyper)insulinemia
37. More importantly, their
findings demonstrated that p66Shc interacted with IRS1 and
promoted its inhibitory phosphorylation in white fat. Given this
background, we hypothesized that p66Shc deficiency might
pre-serve the insulin sensitivity in maternal tissues and counteract the
intergenerational transmission of cognitive impairment.
First, we confirmed that p66Shc was expressed in the ovaries of
wild-type females and deleted in KO mice (Supplementary
Fig. 7a). HFD-fed p66Shc KO females showed increases of weight
and plasma insulin levels resembling the insulin resistance
phenotype observed in wild-type mice (Supplementary Fig. 7b,
c). Nevertheless, no significant changes of IRS1
Ser612phosphor-ylation were detected in their ovaries after 4 weeks of HFD dietary
regimen compared to SD mice (Fig.
8
a). Strikingly, the offspring
generated from HFD-fed p66Shc KO females (hereinafter named
F1HFD
p66Shc KO) showed learning and memory comparable to
those of mice born from SD-fed females (Fig.
8
b, c). Accordingly,
LTP was not significantly different between F1HFD
and SD p66Shc
KO mice (fEPSP amplitude: 55.6 ± 13.1% vs. 46 ± 5.4%, p
= 0.46;
fEPSP slope: 59.7 ± 12.2% vs. 45.2 ± 4.8%, p
= 0.23, n =
10–12 slices for each group; unpaired Student’s t test).
Remarkably, BDNF levels were comparable in the hippocampus
of both experimental groups (Fig.
8
d). Finally, we did not
find
significant changes of epigenetic markers H3K9ac and H3K4me3
on Bdnf promoters I, IV, and IX between F1HFD
p66Shc KO and
SD mice in both hippocampus and germline (Fig.
8
e, f).
Collectively, our data suggest that insulin signaling dysregulation
contribute to trigger the HFD-dependent intergenerational effects
on cognitive functions.
Discussion
HFD-induced insulin resistance affects synaptic plasticity,
learn-ing, and memory
14. Nutrient availability also impacts on the
developing brain and it is now recognized that early-life dietary
experience influences brain function in adult offspring
38.
How-ever, whether metabolic factors may transgenerationally affect the
cognitive function and the underlying molecular mechanisms
remain largely unknown.
It is now clearly emerging that some epigenetic modifications
can be inherited over generations and have a role in mediating the
susceptibility to various diseases
39,40. Here we show that maternal
HFD multigenerationally impairs synaptic plasticity, learning,
and memory via gametic mechanisms involving epigenetic
inhi-bition of exon-specific Bdnf expression in the hippocampus of
descendants.
We set up a model of HFD-fed female mice showing a
meta-bolic profile resembling the human insulin resistance (Fig.
1
c–e)
41.
Analysis of the offspring revealed significant deficits in LTP at
CA3–CA1 synapses (Fig.
2
d) and hippocampus-dependent
learning and memory tasks (Fig.
2
a–c). Surprisingly, in the
sec-ond and the third generations of HFD descendants we found
behavioral and electrophysiological alterations similar to those
observed in F1HFD
mice (Fig.
3
a–h). The unbiased analysis of
synaptic plasticity gene expression also revealed altered
expres-sion of several targets in the hippocampus of F0 HFD mother’s
descendants (Supplementary Fig. 3a) including decreased
amounts of neuronal activity-related Bdnf exons (I, IV, IXa)
42,43(Fig.
4
a) and BDNF protein (Fig.
4
b). The
first set of our data
demonstrated that maternal diet multigenerationally affects gene
expression, hippocampal plasticity, and cognitive functions
similarly to adverse environments and psychological stress
44.
The intergenerational epigenetic transmission may be the
consequence of behavioral and/or germline transfer of a
pheno-type. The
first condition occurs when environmental factors
persist across the generations as, for example, in case of the
transmission of maternal care behavior
45,46. In our experimental
model, the descendants of HFD mothers did not exhibit
sig-nificant changes of metabolic profile resembling those observed in
their ancestor (compare Fig.
2
e–h and Supplementary Fig. 2d–g
with Fig.
1
b–e). However, we found low BDNF plasma levels in
HFD progeny (Supplementary Fig. 3e), which might contribute to
the multi-organ downregulation of Bdnf observed in HFD
des-cendants (Fig.
4
c–e and Supplementary Fig. 3d). Moreover, we
cannot exclude that other metabolic changes or unmeasured
alterations might occur in our experimental model and influence
the phenotype of next generations (e.g., cryptic maternal effects,
transfer of parental microbiota to offspring, or effects of seminal
fluid on maternal behavior or physiology)
47,48. CF experiments
keep out the involvement of maternal behavior in HFD-induced
intergenerational cognitive effects (Supplementary Fig. 4a–d), and
IVF data point out the male sperm as vehicle of epigenetic
phe-notype (Supplementary Fig. 4e–h). A common characteristic of
intergenerational phenotype transmitted via the germline is to
find an epigenetic mark in both somatic and gametic tissues
49.
We found lower levels of gene activation-related molecular marks
such as H3K9ac and H3K4me3 in both germline and
hippo-campus of HFD mother’s male descendants (Fig.
4
c, e).
Diet-dependent epigenetic modifications may be then inheritable but
they should also be editable in response to environmental
fac-tors
39. Indeed, exposure of F1HFD
male mice to NEE counteracted
the multigenerational transmission of HFD detrimental effects on
brain functions, leading to almost complete rescue of learning,
memory, and synaptic plasticity in F2HFD NEE
and F3HFD NEE
mice (Fig.
5
a–d and Supplementary Fig. 5b). Of note, we found a
Fig. 7 Maternal BDNF administration counteracts the effect of HFD on offspring’s cognitive function. a Immunoblots and bar graphs of TrkBTyr816
phosphorylation in the ovaries of females fed with SD or HFD and intraperitoneally injected with vehicle or BDNF (F0 SD, F0 HFD, F0 HFD BDNF; n = 3
mice per group; statistics by two-way ANOVA and Bonferroni post hoc).b Weight and c plasma insulin after 4 weeks of treatment and calorie intake of F0
SD, F0 HFD, and F0 HFD BDNF female mice (n = 8 mice per group; statistics by two-way ANOVA and Bonferroni post hoc). d Immunoblots and bar graphs
of IRS1Ser612phosphorylation in the ovaries of F0 SD, F0 HFD, and F0 HFD BDNF mice (n = 3 mice per group; statistics by two-way ANOVA and Bonferroni
post hoc). Source data are provided as a Source Datafile. e Latency (left) and time spent during the probe test (right) in the MWM test for SD, F1HFD, and
F1HFD BDNFmice (n = 8 mice derived from 5 litters for each group; significance is indicated between F1HFDand F1HFD BDNFmice; statistics by two-way
ANOVA and Bonferroni post hoc).f Preference index of SD, F1HFD, and F1HFD BDNFmice in NOR test (n = 8 mice derived from 5 litters for each group;
statistics by two-way ANOVA and Bonferroni post hoc).g Bdnf exon I, IV, and IXa expression (normalized to actin) in the hippocampus of SD, F1HFD, and
F1HFD BDNFmice. Data represent mean values obtained from six mice derived from four litters for each group; experiments were performed in triplicate
(statistics by two-way ANOVA and Bonferroni post hoc).h ChIP assays of H3K9ac and H3K4me3 on the promoters I, IV, and IX of Bdnf gene in the
hippocampus of SD, F1HFD, and F1HFD BDNFmice. Data represent mean values obtained from six mice derived from four litters for each group; qPCR
experiments were performed in triplicate (statistics by two-way ANOVA and Bonferroni post hoc). Data are expressed as mean ± SEM. *p < 0.05; **p < 0.01; ***p < 0.001; n.s. not significant
F0 SD #1 Kd 150 150 50 IB: α- pIRS1 Latency (s) Relativ e units Time in quadr ant (s) BDNF protein le v els (ng/g) 40 45 250 200 150 100 50 0 40 35 30 25 20 15 10 5 0 30 20 10 0 8 6 4 2 0 Relativ e units 8 6 4 2 0 Relativ e units 8 6 4 2 0 Relativ e units 8 6 4 2 0 Relativ e units 8 6 4 2 0 Relativ e units 8 6 4 2 0 IB: α- IRS1 IB: α- ACTIN #2 #3 #4 #1 #2 #3 #4 F0 HFD n.s. n.s. n.s. n.s. n.s. n.s. n.s. n.s. n.s. n.s. n.s. n.s. n.s. n.s. n.s. 2 80 F1SD p66Shc KO F1HFD p66Shc KO F1SD p66Shc KO F1HFD p66Shc KO F1SD p66Shc KO F1HFD p66Shc KO 70 60 50 40 30 20 10 0 1.5 1 0.5 0 F0 SD 1 2 Mock H3K9ac Bdnf promoter I H3K4me3 Mock H3K9ac Bdnf promoter I H3K4me3 Mock H3K9ac Bdnf promoter IV H3K4me3 Mock H3K9ac Bdnf promoter IV H3K4me3 Mock H3K9ac Bdnf promoter IX H3K4me3 Mock H3K9ac Bdnf promoter IX H3K4me3 Training (days) 3 4 NE SE SW NW NE SE SW NW F0 HFD p66Shc KO mice
a
b
c
d
e
f
Hippocampus Germline pIRS1/IRS1 (relativ e units) Pref erence inde x (%)Fig. 8 p66Shc deficiency abolishes the maternal HFD-dependent effects on F1 cognitive functions. a Immunoblots and bar graphs of IRS1Ser612
phosphorylation in the ovaries of p66Shc KO females fed with SD or HFD (n = 4 mice per group; statistics by unpaired Student’s t test). Source data are
provided as a Source Datafile. b Preference index of mice born from SD-fed or HFD-fed p66Shc KO (F1SDp66Shc KO and F1HFDp66Shc KO, respectively)
(n = 7 mice derived from 5 litters per group; statistics by unpaired Student’s t test). c Latency to reach the platform (left) and time spent in the four
quadrants during the probe test (right) in the MWM test for F1SDp66Shc KO and F1HFDp66Shc KO mice (n = 7 mice derived from 5 litters for each group;
statistics by unpaired Student’s t test). d BDNF levels in the hippocampus of F1SDand F1HFDp66Shc KO mice. ELISA assay was performed in duplicate (n =
8 mice derived from 5 litters per group; statistics by unpaired Student’s t test). e ChIP assays of H3K9ac and H3K4me3 on the promoters I, IV, and IX of
Bdnf gene in the hippocampus and f germline of F1SDp66Shc KO and F1HFDp66Shc KO mice. Data represent mean values obtained from six mice derived
rescue of epigenetic activation markers on the Bdnf regulatory
sequences in the germline of mice exposed to NEE (i.e., F1HFD
NEE; Supplementary Fig. 5a). NEE may affect germ cell
epigen-ome of F1HFD
mice by multiple mechanisms, including changes
in circulating neuroendocrine hormones and neurotrophins (e.g.,
BDNF), action of non-coding RNAs, or paternally induced
alterations in maternal behavior
50. The discrepancy between our
data and those from previous works investigating the
inter-generational effects of NEE in SD condition may be due to the
type of parental exposure (maternal vs. paternal), the critical
phase of exposure (pre or post weaning), and/or the studied brain
area
51–53.
Our
findings suggest that the multigenerational opposite effects
of HFD and NEE on learning and memory may be mediated by
epigenetic changes targeting the same molecular machinery
(Supplementary Fig. 5a). However, how nutrient-related signals
can trigger the intergenerational transmission of HFD effects
remains largely unexplored.
An intriguing hypothesis is that both systemic HFD-dependent
insulin resistance and BDNF deficit are involved in the mother to
offspring transmission of HFD-dependent cognitive impairment
by changing the chromatin remodelers’ recruitment on Bdnf
regulatory sequences. In F0 HFD mothers, we found lower
plasma levels of BDNF (Fig.
6
b) and hypophosphorylation of
ovarian TrkB receptor (Fig.
6
c), which can account for the
reduced CREB activation. Moreover, F0 HFD mother’s gonads
constitutively showed higher inhibition of IRS1 (Fig.
6
c), a
molecular marker of insulin resistance, which leads to increased
nuclear translocation of FOXO3a. Both CREB and FOXO3a are
able to bind HAT/HDAC enzymes and regulate their recruitment
on chromatin. Accordingly, FOXO3a was more bound to both
HDAC2 and SIRT2 in the ovaries of F0 HFD mothers (Fig.
6
d).
More importantly, in HFD gonads the binding of both HDAC
enzymes was increased, whereas the recruitment of CBP was
inhibited on the Bdnf gene loci showing reduced H3K9
acetyla-tion in the offspring of HFD mothers (Fig.
6
e). We hypothesize
that BDNF intergenerationally auto-regulates its expression
through a positive feedback mechanism aimed to prime next
generation to the environmental conditions (i.e., parental
imprinting)
54. Accordingly, BDNF administration to HFD-fed
mothers counteracted the intergenerational transmission of both
cognitive impairment and Bdnf downregulation (Fig.
7
e–h). It is
worth mentioning that BDNF administration exerted anorectic
effects on HFD-fed mice (Fig.
7
b) but without significantly
interfering with peripheral insulin resistance (Fig.
7
c and
Sup-plementary Fig. 6a) nor counteracting IRS1 inhibition in the
ovaries (Fig.
7
d). However, the critical role of insulin resistance as
trigger of HFD-dependent intergenerational effects on
hippo-campal plasticity was highlighted by the results we obtained in
p66Shc KO mouse model. F1HFD
p66Shc mice did not show any
significant changes in learning, memory, and BDNF levels
com-pared to SD mice (Fig.
8
b–d).
It is still debated whether the mouse embryo can retain histone
modifications acquired during oocyte maturation or they are
completely erased during embryo development
55–58. In addition
to BDNF and insulin signaling, alteration of other metabolic
signaling pathways affecting chromatin structure, such as
phos-phorylation of histone H3 by the nutrient sensor AMPK,
mod-ulation
of
flavin adenine dinucleotide-dependent histone
demethylase LSD1
59, or HFD-dependent change of
micro-RNAs
60, might be involved in the intergenerational modifications
of epigenetic marks. Finally, epigenetic changes identified on the
Bdnf promoters might primarily occur in the developing F1
embryos and lead to multi-organ inhibition of Bdnf expression.
Our
findings demonstrate a multigenerational effect of
maternal high-fat feeding on the cognitive function and reveal
epigenetic markers of early-life environmental exposure. More
genes critically involved in synaptic plasticity regulation and
other epigenetic mechanisms (including DNA methylation or
microRNA expression) may play a role in the HFD-dependent
multigenerational effects on cognitive function. However,
altera-tion of both BDNF and insulin signaling during the embryo
development appear to be primarily responsible for the
trans-mission of brain vulnerability to the next generations (Fig.
9
).
Importantly, these modifications are transmittable across the
generations and represent a sort of molecular switch for the
vul-nerability to the lifestyle-related diseases
61,62. Identifying the genes
most susceptible to disease-related epigenetic changes and the
molecular mechanisms that ensures locus-specific targeting are
great challenges for personalized medicine in the near future.
Methods
Animals. Female C57BL/6 mice (30 days old), derived from the Animal Facility of Catholic University, were used and randomly assigned to two feeding regimens: (i) SD (control) and (ii) HFD until they were ready for mating and they were weighed weekly. Female mice (F0) were paired for breeding at the end of the fourth week of dietary regimen. Male mice are removed from the female’s cage after 1–2 days of mating and are exposed to HFD only during this time lapse. The same male mouse was paired, at different times, with both a F0 SD female and a F0 HFD female
Cryptic maternal effects Ovary F1 fetus
F2
F1
F0
Methyl group M Ac H3 Acetyl group Histone H3F3
HFDFig. 9 Flow chart offindings. Maternal (F0) HFD causes molecular and
behavior changes in the offspring (F1) via gametic mechanisms involving epigenetic inhibition of Bdnf expression. Both low BDNF plasma levels and insulin resistance in mothers lead to alterations of BDNF and insulin signaling in the ovaries and change the recruitment of histone acetyl-transferases (HAT) and histone deacetylases (HDAC) on the Bdnf
promoters. These epigenetic modifications may be transferred from
oocytes to embryo. Additional mechanisms including maternal microbiota transfer, microRNA, and cryptic maternal effects may be involved in the
HFD-related intergenerational modification of Bdnf epigenetic marks. The
outcome is a multi-organ inhibition of Bdnf expression leading to LTP and
memory deficits. The propagation of the same epigenetic changes via male
sperm is responsible for the transmission of HFD-dependent brain damage to the next generations (F2 and F3)