ALMA MATER STUDIORUM - UNIVERSITÀ DI BOLOGNA
SCHOOL OF ENGINEERING AND ARCHITECTURE
DICAM
Second Cycle Degree in Civil Engineering
Master Thesis in
New technology for road safety
December 3, 2020
Supervisor :
ACKNOWLEDGEMENTS
I would like to offer my sincerest gratitude to the people who helped me develop the research content of this thesis. I deeply thank my Advisor and professor Dr. Andrea Simone , for all what he delivered to me in weekly assessment and my progress during my stay in the university on the dissertation work; and also want to appreciate his valuable comment that makes me to think out of the box, which contributes so much in the quality of my work.
Also I would like to thank the staff of the University of Bologna especially the staff of the Civil Engineering Faculty who made everyday of my master study experience fruitful and valuable ones.
Lastly a big thanks goes to my family and friends, for whom I am so grateful for all the attention and encouragement they bring everyday into my life .
ABSTRACT
Public transport contributes greatly to people’s mobility. One of the most significant costs associated with automobile travel is the number of road accidents and fatalities that this type of transportation incurs. Road fatalities in almost all developed countries have decreased over the last four decades.
The aim of the study presented in this thesis was to facilitate improved road safety through increased understanding of methods used to measure driving behaviour, and through increased knowledge about driving behaviour in sub-groups of drivers.
To achieve a more consistent understanding of all potential determinants of road safety , I examined a conceptual framework based on an extensive review of the literature on the social, economic and environmental factors that have been demonstrated to affect traffic fatality , resulting in an analysis of the intelligent transport system technologies.
Index
Acknowledgments ………..1 Abstract ……….. ……2 List of figures………..6 Chapter 1: Introduction ………6 1.1 Background………6 1.2 Motivation ………..91.3 Significance of the project ………..……….9
Chapter 2: Literature Review ………..………...11
2.1 General ………..………...11
2.2 Global Road Safety ………..………...13
2.3 World Health Organization (WHO) on Road Safety ………..………….15
2.4 Type of accidents, position and consequences ………..……….………..18
2.6 Human behaviour impact ………..……….…...21
2.7 New technologies ………..………...21
Chapter 3: Transportation Network Management and Operations……….………22
3.1 General ………..………..……….22
3.2 Importance of connecting transportation data to the public ………...….………24
3.3 Maas as a mobility service ………..……….………...26
3.4 First example of Maas ………..………..………..…...26
Chapter 4 : New technologies on road safety : ITS………28
4.1 Introduction………..………...28
4.2 Urban settings and development challenges……….………29
4.3 Vehicle based systems………..………...32
4.4 Infrastructure based systems ………..………...33
4.5 Cooperative systems ………..………...34
4.6 Advanced Traffic Management Systems (ATMS) ………..………..35
4.7 Smart traffic signal control system ………..……….36
4.8 Ramp metering ………..………...38
4.10 Electronic toll collection system (ETCS) ………..………40
4.11 Electronic road pricing ………..……….42
4.12 Advanced traveller information system ………..……...………45
4.13 Intelligent speed adaptation………46
4.14 Adaptive front lightning systems (AFS)………...….46
4.15 Forward collsion mitigation ………...47
4.16 Lane changing support………48
Chapter 5 : Adoption of ITS for sustainable transportation………49
5.1 Sustainable development ………..………...………49
5.2 The importance of developing a sustainable transportation system in urban areas……….52
5.3 Interconnection between sustainable transport and smart cities ………...53
5.4 ITS and Environment Protection ………..………....………...55
Chapter 6 : Autonomous cars- the next revolution in mobility………....56
6.1 General ………..……… ………..………56
6.1.1 Definition of autonomous vehicle ………..………...……….…...57
6.1.2 Benefits of autonomous vehicle ………..……….……...57
6.1.3 System-level impacts of automated vehicles ………..……...…….……58
6.2 History and background of autonomous vehicles ……….……….…..61
6.3 Autonomous vehicles: solution of transportation ……….……….………...63
6.3.1 Navigation ………..………..……….……….63
6.3.2 Motion Planning ………..………..…….65
6.3.3 Situation Analysis ………..………...…..67
6.3.4 Trajectory control ………..………..…...67
6.3.5 Adaptive Cruise Control ………..………..….…68
6.4 External sensors ………..………..………....70
6.5 Different Levels of Automation ………..……….……….73
6.6 Automated vehicle Platooning as part of vehicle to vehicle communication ……….………..75
Chapter 7: Data collection and privacy………79 7.1 Privacy ………..………..…………...…………79 7.2 Privacy threats……….…....83 7.3 Information……….84 7.4 Future perspective………..…85 Chapter 8: Conclusion 8.1 Conclusion ………....87
LIST OF FIGURES
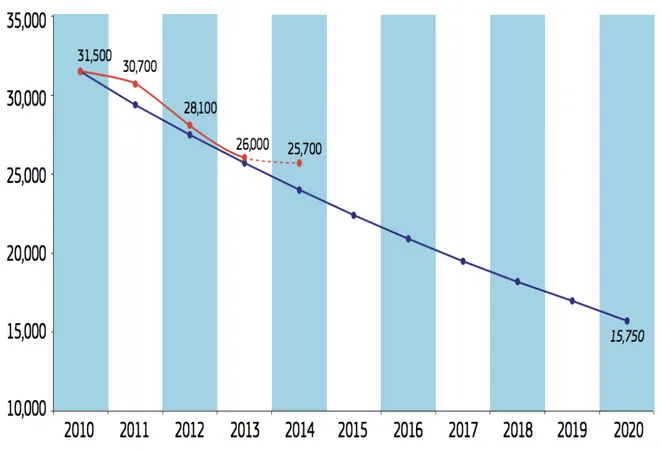
Figure 1. Development over time since 2010
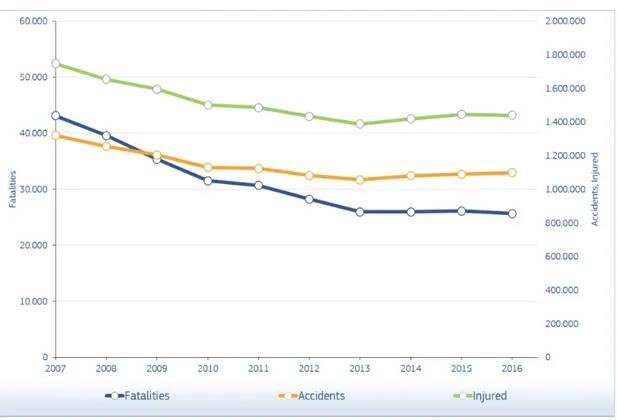
Figure 2. Annual number of fatalities, injury accidents and injured people in the EU
Figure 3. Distribuition of global injury mortality by cause
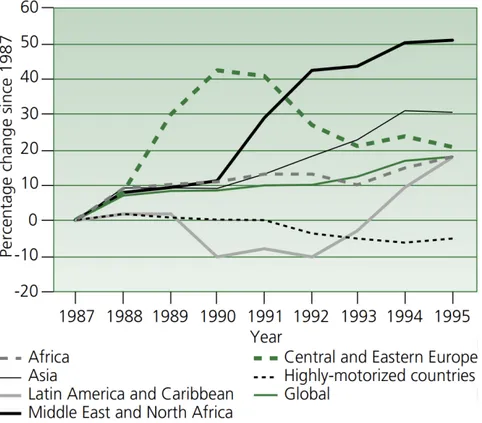
Figure 4. Global and Regional Fatality trends, 1987-1995
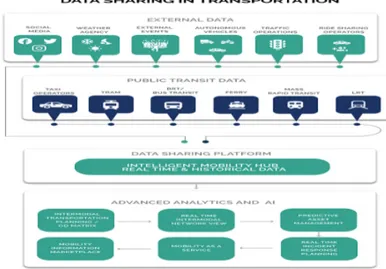
Figure 5. Data sharing in transportation
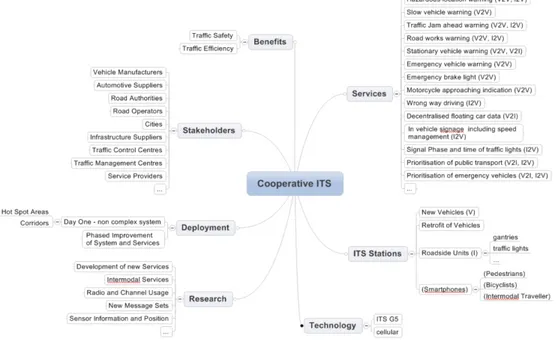
Fig. 6 Most important facts on transport cooperative systems
Figure 7. Advanced traffic management system
Figure 8. Ramp metering configuration
Figure 9. National incident management system
Figure 10. Example of a ETCS
Figure 11. Incident management scheme
Figure 12. Scheme of Sustainable Development
Figure 13. The size of the world population over the last 12000 years
Figure 14. Inter-connection between sustainable transport and smart cities
Figure 15 . Trajectory planning and tracking for autonomous vehicles
Figure 16. Advanced Cruise Control Concept
Chapter 1
Introduction
1.1 Background
A well-functioning transportation system is vital on all social levels, from moving goods and enabling trade to facilitating daily mobility and promoting health and social inclusion. Many people sustain serious injuries in road traffic crashes every year, with lifelong consequences both for the victims and their families. Apart from the human suffering, these injuries have a big impact on society as a whole, and the economic cost is also high.
The European Commission has put a new focus on reducing serious injuries. To highlight the importance of reducing the risk of serious injuries, we estimate that for every person who dies on the roads, about five more are seriously injured. Furthermore, the majority of people seriously injured on Europe’s roads are vulnerable road users. Their proportion is even higher in towns and cities and protecting them is a priority.In 2014, almost 25700 road fatalities were reported in the EU. This is a decrease by around 1% compared to 2013. For the complete strategy period 2010-2014, the annual number of road deaths decreased by 18%. This means 5700 fewer deaths in 2014 than in 2010. The EU road fatality rate in 2014 was 51 dead per million
inhabitants. Sweden, the Netherlands, the UK and Malta have the lowest reported road fatality rate, below 30 dead per million inhabitants. The highest road fatality rates are reported from Latvia, Romania, Bulgaria, Lithuania and Poland with more than 80 dead per million inhabitants.
figure 1. Development over time since 2010
In 2014, the provisional figure for the EU in March 2015 is 25 700 reported road deaths. This is around 1 % fewer deaths than reported in 2013 and 18 % fewer than in 2010. This means that the decrease rate has slowed down in 2014, compared to previous years.
While achievements to date are good – cutting the number of annual deaths by almost one fifth since the start of the strategy period 2010-2020 – they are not quite in line with the ambitious target. In order to halve the number of road deaths by 2020, the road fatality numbers must go down at a higher
The overall long-term trend is that the number of road fatalities decreases. However, the year to-year developments differ widely between Member States. Some Member States had an increasing number of road fatalities between 2013 and 2014, for example Slovakia, Latvia and Bulgaria. Other Member States had a significant decrease, for example Finland, Slovenia and Croatia with around 15 % fewer road deaths in 2014 than in the year before.
The development of efficient transport services went through an evolutionary process of adopting environmental and safety considerations in the policy design.
The technology innovation hubs worked on developing devices that could help collect information from the vehicles to identify the impact of growth in the transport industry on the environment. With the creation of computer and information technology, it allowed the innovative inventions to integrate immensely by making the vehicles information-aware, allowing the vehicles to share this information with external systems. Intelligent Transportation Systems (ITS), or the advanced use of Information and Communication Technology (ICT) in the transportation context, offers new tools in the continual effort to develop an accessible, safe, and sustainable transportation system. ITS, which can broadly be defined as the advanced use of Information and Communication Technology (ICT) in the transportation context, is built upon data collection, storage, and processing.
1.3 Project significance
This thesis makes contributions to the road safety literature and methodological techniques, designed to improve understanding of driver behaviour. ITS systems and services have great potential to generally enhance individuals’ daily, personal mobility and transportation experiences. For example, advancements in positioning and mobile systems allow for increasingly precise and continual measurements of the locations and movements of individuals and objects over time. These tracking and monitoring capabilities facilitate the collection of position, movement and activity data, which enables further development of services and devices, for instance, to provide information for pre- and on-trip planning. As road accidents have been and are still a major concern that lead to death and fatality, our aim should be to focus our attention not only on drivers behaviour ,but also on the driving environment as well as other factors that influence as well. Based on this the aim of this project is to present new technologies regarding road safety and intelligent transport system.
Chapter 2
Literature Review
2.1 General
Currently estimated to be the ninth leading cause of death across all age groups globally, road traffic crashes lead to the loss of over 1.2 million lives and cause nonfatal injuries to as many as 50 million people around the world each year. Nearly half (49%) of the people who die on the world’s roads are pedestrians, cyclists and motorcyclists. Road traffic crashes are the main cause of death among people aged between 15 and 29 years. With the emergence of disruptive technologies , public sector organizations are looking for ways to gain visibility into driver and vehicle performance through timely alerts of incidents so that they can take immediate action. The 2030 Agenda for Sustainable Development includes an ambitious target to reduce road traffic deaths and injuries by 50% by 2020. While much progress has been made by governments during the Decade of Action to adopt and enforce new road safety laws on risks such as speeding, to redesign roads with protective infrastructure such as sidewalks, and to ensure that vehicles are equipped with life-saving
technologies, governments must rapidly accelerate their efforts to achieve Sustainable Development Goal target. To do so will mean that governments fulfil the commitments they have repeatedly made through various policy instruments and overcome the challenges they have faced, particularly fatalism, the misconstrued notion that road traffic crashes are accidental and nothing can be done to prevent them. It will also mean surmounting a lack of prioritization for road safety generally and a focus on interventions that are not always the most effective.
Modern Intelligent Transportation Systems (ITSs) employ communication technologies in order to ameliorate the passenger's commuting experience. Vehicular Networking lies at the core of inaugurating an efficient transportation system and aims at transforming vehicles into smart mobile entities that are able to sense their surroundings, collect information about the
environment and communicate with each other as well as with Roadside Units (RSUs) deployed alongside roadways. As such, the novel communication paradigm of vehicular networking gave birth to an ITS that embraces a wide variety of applications including but not limited to: traffic management, passenger and road safety, environment monitoring and road surveillance, hot-spot guidance, Drive Thru Internet access, remote region connectivity, and so forth.
Furthermore, with the rapid development of computation and communication technologies, the Internet of Vehicles (IoV) promises huge commercial interest and research value, thereby attracting a significant industrial and academic attention.Unlike existing wireless mobile networks, vehicular networks possess unique characteristics, including high node mobility and a rapidly-changing topology, which should be carefully accounted for.
2. 2 Global Road Safety
Road safety pertains to the measures taken to reduce the risk of road traffic injuries and death. Through intersectional coordination and collaboration, countries in all regions can work improve their road safety legislation, creating a safer, more accessible, and sustainable environment for transport systems. It is essential that countries implement measures to make roads safer not only for car occupants, but also for vulnerable road users such as pedestrians, cyclists, and motorcyclists.
The Region of the Americas accounts for 11% of global road traffic deaths with nearly 155 000 deaths. It accounts for 13% of the total world population and 25% of the total number of registered vehicles. It has the second lowest road traffic fatality rate among regions with a rate of 15.6 per 100 000 population. In Europe the European Commission has adopted an ambitious Road Safety Programme which aims to cut road deaths in Europe between 2011 and 2020. The programme sets out a mix of initiatives, at European and national level, focussing on improving vehicle safety, the safety of infrastructure and road users' behaviour
Road Safety is a major societal issue. In 2011, more than 30,000 people died on the roads of the European Union, i.e. the equivalent of a medium town. For every death on Europe's roads there are an estimated 4 permanently disabling injuries such as damage to the brain or spinal cord, 8 serious injuries and 50 minor injuries.
In 2016, according to the World Health Organisation, road accidents were the eighth-biggest cause of death in the world; deadlier than both diarrhoeal diseases and tuberculosis. Not only is it
important to consider road fatalities, but for every fatality on Europe's roads, it is projected that 4 people will become permanently disabled, that 10 shall suffer brain or spinal cord damage, 10 people will be seriously injured and 40 will have sustained minor injuries.On top of this, road accidents incur a large economic impact. In Europe alone, it is estimated that road accidents are a cost to society by a measure of €130 billion annually.
On the other side although only a small proportion of the world’s total motor vehicle fleet and total network is in the Asian and Pacific region, 235,000 road deaths occur annually, which is almost half of the 500,000 road deaths that occur annually worldwide.
The number of people injured or crippled through road accidents in the region is difficult to quantify because of underreporting, but it is certainly of the order of 3 million to 4 million each year. Road accident deaths are commonly the second largest cause of deaths for the core age. Vulnerable road users (VRUs) (pedestrians,motorcyclists and non motorized vehicles are particularly at risk and in many countries of the region they constitute the highest proportion of those killed or injured .They require particular attention in the developing of countermeasures and improvements.
While talking about Africa , it has an annual death toll that’s significantly higher than the world average. It’s also higher than the African average.
According to the Road Traffic Management Corporation’s most recent annual report, there were 12,921 deaths on South Africa’s roads in a single year. Over the holidays, in particular, serious road accidents are a daily occurrence. The main causes analyzed are : distractions: Not focusing on the road while driving is one of the leading causes of road accidents. Distractions include common behaviours like using a cell phone, eating food or applying make-up. Texting while driving makes you 23% more likely to be involved in an accident, : drunk driving : According to arrive alive, 50% of those who die in road accidents have a blood alcohol concentration above 0.05 gram per 100 millilitres.
Currently, the limit for driving while under the influence is a blood alcohol content of 0.05% or less. Drunk driving carries heavy penalties and frequently results in fatal accidents.
From June 2020, a new law in South Africa will set the legal blood-alcohol limit for drivers to 0%. This means that a single drink could put a driver over the legal limit.
This zero-tolerance limit forms part of the Administrative Adjudication of Road Traffic Offences (Aarto) Act, which was signed into law in 2019.
2.3 World Health Organization (WHO) on road safety
The road traffic injury problem began before the introduction of the car. However, it was with the car – and subsequently buses, trucks and other vehicles – that the problem escalated rapidly. By various accounts, the first injury crash was supposedly suffered by a cyclist in New York City on 30 May 1896, followed a few months later by the first fatality, a pedestrian in London .
Despite the early concerns expressed over serious injury and loss of life, road traffic crashes have continued to this day to exact their toll. Though the exact number will never be known, the number of fatalities was conservatively estimated to have reached a cumulative total of 25 million by 1997 . WHO data show that in 2002 nearly 1.2 million people worldwide died as a result of road traffic injuries. This represents an average of 3242 persons dying each day around the world from road traffic injuries. In addition to these deaths, between 20 million and 50 million people globally are estimated to be injured or disabled each year .There were 1.25 million road traffic deaths globally in 2013, with millions more sustaining serious injuries and living with long-term adverse health consequences. Globally, road traffic crashes are a leading cause of death among young people, and the main cause of death among those aged 15–29 years.
Road traffic injuries are currently estimated to be the ninth leading cause of death across all age groups globally, and are predicted to become the seventh leading cause of death by 2030.
According to WHO data, road traffic deaths have risen from approximately 999 000 in 1990 to just over 1.1 million in 2002 , an increase of around 10%. Low income and middle-income countries account for the majority of this increase. Although the number of road traffic injuries has continued to rise in the world as a whole, time series analysis reveals that road traffic fatalities and mortality rates show clear differences in the pattern of growth between high-income countries, on the one hand, and low-income and middle-income countries on the other . In general, since the 1960s and 1970s, there has been a decrease in the numbers and rates of fatalities in high-income countries such as Australia, Canada, Germany, the Netherlands, Sweden, the United Kingdom and the United States of America. At the same time, there has been a pronounced rise in numbers and rates in many low-income and middle-income countries.
The percentage change in road traffic fatalities in different regions of the world for the period 1987– 1995 is shown in Figure 3 . The trends are based on a limited number of countries for which data were available throughout the period and they are therefore influenced by the largest countries in the regional samples. Such regional trends could mask national trends and the data should not be
extrapolated to the national level. The regional classifications employed are similar to, but not exactly the same as those defined by WHO. It is clear from the figure that there has been an overall downward trend in road traffic deaths in high-income countries, whereas many of the low-income and middle-income countries have shown an increase since the late 1980s. There are, however, some marked regional differences; Central and Eastern Europe witnessed a rapid increase in road traffic deaths during the late 1980s, the rate of increase of which has since declined. The onset of rapid increases in road traffic fatalities occurred later in Latin America and the Caribbean, from 1992 onwards.
2.4 Type of accidents ,position and consequences
There are a variety of road accidents that a driver needs to be concerned about. The reasons for these accidents not only consist of poor driving skills, bad judgment but as well the make, condition and even type of the vehicle in question that caused the accident.
Along with injuries caused by car accidents, motorcycle accident injury is also very common. One can even say that casualties related to motorcycle accident are even more deadly than other injuries caused by automobile accidents on the road. However irrespective of the kind of accident, they are all a cause of concern in regards of physical damage to people and property as well as financial loss.
The most common types of road accidents are :
• Rear End collisions : One of the most common types of road accidents is rear end collisions. A typical rear end collision occurs when a car at the back hits or collides into the car at its
immediate front. They are more common on heavy traffic roads or roads with stop and go traffic. Rear end collision can cause a significant amount of damage to vehicles, as well as the
passengers and drivers. Furthermore, since mostly cars are jam packed on a heavy traffic road, rear end collisions can cause sort of a domino effect and cause damage to cars at the front as well.
• Individual Vehicle Collisions: Individual vehicle collisions occur when an individual vehicles gets sidetracked and hits a non-mobile object on the road such as a tree, street light or a road divider etc. These kinds of accidents usually occur due to poor weather conditions such as rain or snow which can cause the roads to be slippery or even occur because of poor judgment or carelessness on the driver’s behalf.
Since vehicles reeling out of control happen at high speeds
• Collisions due to over speeding: WHO research has shown that an increase in average speed is directly proportional to the chances of an accident occurring, as well as the increased chances of the severity of the accident and the damage it causes. In case of a severe collision risk there is also the risk of pedestrians being hit. While in the chances of the accident being a car to car side impact, the chances of car occupants being injured increases.
• Accidents due to DUI: Accidents that occur due to the driver being under the influence of alcohol or other drugs which can lower the inhibitions of drivers and cause them to make poor judgments and careless driving.
These are quite common and drinking under influence is against the law. So if you had had a night out and feel like you might not be up to driving, then let another person drive you or take a taxi or take other means of transport.
• Distracted Driving: Although driving while being can seem like a small thing but even losing your focus for a tiny moment can cause a lot of damage. Nowadays technology is the main distraction such as changing the music channel etc. Drivers are constantly checking their mobile phones, GPS other devices for directions. Even passengers in the car or eating, drinking coffee or any other drink can be a reason for the driver to get distracted as well. • Ignoring Traffic rules: Ignoring traffic rules such as jumping red signals, driving over the
speed limit, driving in the wrong lane. Ignoring traffic rules not only jeopardizes the life of the driver but also others around them. If you jump a red light because you are late, doesn’t necessarily mean you reach your destination in time. In fact ignoring traffic rules will only result in further issues consequently which will make you even more lately for your appointment.
• Accidents at Intersections: One of the most common reasons for accidents at intersections occurs when a driver trying to make through a yellow light collides into the active traffic on the other side. These kinds of accidents are also known as T-Bone collisions. These accidents can prove to be fatal if upon collision a car doesn’t have functioning air bags or the car occupants aren’t strapped with their seat belts.
It is reasonable to mention also the effects and consequences of road accidents . It is obvious that Car accidents can be traumatizing.
You’re never truly prepared for the emotional and physical car accident after effects. The effects of it can be long lasting which is why compensation must take into account future expenses and suffering. The mental and emotional injuries after a car accident can include mental anguish, emotional distress, fear, anger, humiliation, anxiety, shock, embarrassment, random episodes of crying, loss of appetite, weight fluctuations, lack of energy, sexual dysfunction, mood swings, and sleep disturbances. Studies indicate that one-third of those individuals involved in a nonfatal accident continue to have the above-mentioned symptoms of emotional trauma a year after the accident including post-traumatic stress disorder,
depression, and phobias. Physical injuries that are associated with long-term effects are usually permanent disabilities such as amputations, paralysis, or TBI’s which create a diminished mental capacity, but soft tissue injuries that affect the tissue surrounding and connecting tendons, muscles, and ligaments are also usually long term.
2.5 The impact of human behavior on road safety
Car occupant fatalities were found to have occurred predominantly among the young; the passenger fatalities tend to be even younger than the driver fatalities. Contributing significantly to these totals were weekend peaks in fatalities of both car drivers and passengers occurring between 9 p.m. and midnight. Such accidents show a high level of alcohol involvement. Previous research at Nottingham University (Clarke et al., 2002) has shown similar increases in alcohol-related accidents at such times. Alcohol-related accidents, however, may not be the exclusive preserve of drivers under 25.There is also evidence that young male drivers take more risks when driving with passengers, particularly other male
passengers. Preusser et al. (1998) found that the presence of passengers was associated with more at-fault fatal crashes for drivers aged under 25 years. This effect was particularly marked where teenaged drivers were carrying two or more teenage passengers.
Chapter 3
Transportation Network Management and Operations
3.1 General
It is a fact that at the beginning of this century the amount of data then available in the entire Internet equals to what is now created in a single second. Mobile phones, social networks, surveys, bank card payments, Global Navigation Satellite Systems (GNSS), online activities, public transport ticketing, location-based services, etc. all produce torrents of data as a by-product of their operations. Comparing the amount of data generated in 2011 with its growth and global population size , it is estimated that on average each person produces 1 GB of content daily. This huge data stream initiated revolution is being referred to as big data. A modern society can be viewed, in part as a system of networks for
transportation, communication and distribution of energy, goods, and services. The complex structure and cost of these sub systems demand that existing facilities be rationally designed. Network analysis
techniques can be of great value in the design, improvement, and rationalization of complex large scale systems. Transportation network is deemed to represent the supply side of the transportation system to satisfy the movement needs of trip makers i.e. road users in the study area. The transportation network management process includes variety of activities which includes planning, design, construction, operation, maintenance and related research and development. The activities needs frequent decision making to overcome various types of problems. The problems are not well defined and non-structured. The complexity of managing the network is further increased due to multiplicity of modes road, rail, water, air and multiplicity of organization involved at the national, state and local levels.
The road network management problem faced by country is becoming complex. In the total road network of nation, the problems are of inadequate capacity, immediate repairs, operation, management and addition of new links at crucial locations. The services and performance levels of existing road in the country lag far behind the advancement in motor vehicle technology. The maintenance cost of existing road structure is rising, which is serious concern for the authorities responsible for their upkeep under tight budgetary constraints. Transportation systems are commonly represented using networks as an analogy for their structure and flows. The road users’ movement and safety on these roads is complex problem. To understand this, the network database created in GIS environment, makes integrated highway information system for various network management purpose including safety and efficiency of passenger and fright/goods movement. GIS database brings information related to networks spatial spread, capacity, inventories, quality and traffic attributes like traffic volume, speed and crash events history.
It is known that the transport environment consists of big data and this is due to the innovation process and also due to the increasing need of the costumers .Both of these are possible thanks to the
technologies adapted in order to make people’s life easier.
In the transport sector, such tools could improve the use of existing resources and the daily life of citizens. Digitalisation, new technologies and big data have the potential to change the way cargo and traffic flows are organised and managed, they generate business opportunities and pave the way for innovation, new services and business models. It enables cooperation between supply chain actors, better supply chain visibility, real-time management of traffic and cargo flows, simplification and the reduction of administrative burden, and allows for a better use of infrastructures and resources, thereby increases efficiency and lowers costs
Big data is becoming a research focus in intelligent transportation systems (ITS), which can be seen in many projects around the world. Intelligent transportation systems will produce a large amount of data. The produced big data will have profound impacts on the design and application of intelligent transportation systems, which makes ITS safer, more efficient, and profitable. Studying big data analytics in ITS is a flourishing field. This paper first reviews the history and characteristics of big data and intelligent transportation systems.The term big data is used as a general term for referring to data sets so large and complex that traditional data processing applications are no longer adequate. This fundamental change of going from a data-scarce to a data-rich environment seems to infer a shift from relatively “small data” studies aimed to answer specific questions based on sampled data to “big data” studies that aim at probing for
relationships and correlations between a wide series of variables and contexts . Big data is often typified by the so-called 3Vs definition. The three Vs define big data as the increase of volume (data scale becomes increasingly big), variety (data come as structured, semi-structured and unstructured data) and velocity (data collection-processing chain needs to be promptly and timely conducted to maximally utilize the potential value of big data).
3.2 Importance of connecting transportation data to the public
Imagine a city where the buses, rapid transit systems, coaches, trams and taxis all work together to provide reliable, predictable and accessible information that helps commuters move from point A to B safely, quickly and efficiently. Unfortunately, the reality is that today’s crowded cities face frequent traffic congestion, growing concerns around reliability, environmental impacts and energy
To achieve faster and better ways to get commuters to their final destinations, the ability to share data across all modes is essential. Currently, the majority of cities share data between the different modes of transportation on a quarterly or yearly basis, mainly for the long-term planning of transportation services and infrastructure. Today, the advent of artificial intelligence (AI), big data technologies and hyper computing platforms have given multimodal data-sharing a shot in the arm to go real-time.
Figure 5. Data sharing in transportation
Moreover, smartphones also enable travelers to actively share information, for instance, about their intended travel plans . Access to this type of information has the potential to improve the decisions and actions taken by public transport actors . Particularly during unplanned disturbances, there is an increased need for more real-time information about travelers . In recent years, unplanned disturbances caused by, for instance, train breakdowns, electrical failures, incidents and people running across train tracks have become a major concern for public transport operators. Parts of these problems derive from aging infrastructures, in combination with increasing demand and limited capacity. If the public
transport actors are provided access to real-time information about the affected travelers, they may base their decisions during unplanned disturbances on the needs of the travelers as well as on the resources available.
3.3 Maas as a mobility service
Mobility as a Service or MaaS entails one mobility service platform or application which makes it possible to provide various modes of transport services to the user on demand. Today we experience all kinds of applications for one or two modes of transport. However, MaaS could offer added value facilitating an interaction of MaaS providers into one application offering real-time and on demand ride-, car-, or bike-sharing, public transport, and taxi or car-rental options to the user. Including payment and buying tickets. MaaS therefore covers all mobility segments: from public transport and infrastructure to traffic management and parking, all coming together in urban mobility. Putting the user first. This customised smart mobility service pairs the diverse needs of the user for the changing daily lifestyle. Nowadays, millennials value physical car ownership less than in the past. In London, Brussels, Cologne and Amsterdam drivers used to spend more than 100 extra hours a year in traffic during rush hours. People care more about the environment. Data from Mobility as a Service platforms could help authorities manage and improve traffic flows. It is now that MaaS and the collection of data can flourish and really add value to both user and the road. According to IBM 90% of the data in the world in 2017 was generated within the last 2 years. This could speed up the transition from solely supplying transport to the user, to an integrated user centric smart mobility system by the use of big data. What Maas offers is an alternative to owning a car in the form of an app that works out the best option for every journey. The service gives customers access to public transport, taxis and car rentals depending on which is most convenient. The aim is to have all modes of transport included in the future.
3.4 First examples of Maas
Amsterdam is leading the way for Mobility as a Service in the Netherlands with successful pilots already completed in the growing Zuidas district of the city and a new app planned for 2020.
As well as being the host city of the largest of all the Intertraffic shows, Amsterdam is increasingly establishing itself as a leader in smart mobility for residents and visitors alike. Over the past few years, it has been the test bed for the experimentation of several Mobility as a Service (MaaS) projects. One of the most recent examples is a pilot known as The Zuidas Mobility Experience. In the Netherlands , six different projects are being trialed:
1. From January 2020, an app providing MaaS services will be available for a trial period of two years with the goal of improving access to the burgeoning Zuidas district in Amsterdam.
2. A similar app intending to stimulate use of alternative modes of transport to cars will also be introduced in the Dutch region of Utrecht.
3. In Eindhoven, in conjunction with a number of employers based in the city, a project is already underway that aims to ensure all business travel there is done sustainably by 2025.
4. The only province in the country with borders to two other nations, Limburg is addressing
multimodal possibilities in a cross-border context with the intention of simplifying public transport travel and reducing car use in the process.
5. Accessible travel for less able-bodied individuals is limited in Twente so special attention is being given to increasing MaaS options for customized transport.
6. Traveling to Rotterdam from The Hague Airport is currently only easily done by car. A new project is seeking to develop multimodal options.
Chapter 4
Intelligent Transport Systems in context
4.1 Introduction
Intelligent transport systems (ITS) is a global phenomenon, attracting worldwide interest from transportation professionals, the automotive industry, and political decision makers. ITS is defined as technologies ,systems and services that provide safer and better transport services with the benefits of improving productivity ,safety and service satisfaction.
Early work in ITS was carried out by the Japanese in the 1980s. At that time, the Japanese had not coined a specific name for ITS as it was considered part of traffic control. They later referred to this work as the Japanese Intelligent Vehicle System (IVS) programme. Siemens was doing some pioneering work on route guidance systems in Berlin in the 1980s, with the Europeans referring to the subject as road transport informatics.
The United States picked up on the theme in the late 1980s, referring to the subject as Intelligent Vehicle Highway Systems (IVHS). The Europeans referred to the work they were doing in application of information and communication technology to transport as Advanced Transport Telematics (ATT), only for the United States to . come up with another term, ITS, giving recognition to the wider application of technology to public transport systems as well as private cars and highways. This name seems to have stuck, with many international organizations adopting it.
4.2 The urban setting and its development challenges
The world is industrializing and urbanizing on a global scale that follows consistent patterns. Some 54 per cent of the world’s population live in urban areas, creating many challenges related to urban living . The United Nations has projected that two thirds of the world’s population will be urban by 2050 – or an increase of 2.5 billion to current urban communities . One in eight people currently lives in one of the 28 so-called mega-cities that hold over 10 million inhabitants .
Many high-growth urban areas can be found in the developing countries of Asia and the Pacific, with the region itself accounting for more than 53 per cent of the world population. According to UN Habitat (2014), in the Asia-Pacific region, India and China alone are projected to add 404 and 292 million urban dwellers respectively to the world’s urban population. Most Asian countries are confronted with complex issues in planning to meet a range of challenges in providing adequate infrastructure for water supply, sanitation, energy, transportation, as well as public services for their emerging mega-cities. These future mega-cities will be confronted with a host of challenges linked to housing, safety, employment, and the delivery of public services including urban mobility.
Urban mobility is expected to worsen during the 21st century in developing countries with increased car ownership, and also due to the projected rapid expansion of urban perimeters in under-planned agglomerations. This will cause additional traffic congestion which can be expected to result in additional costs to motorists, as well as increased air and noise pollution, stress and losses to traffic accidents.
Moreover, insufficient mobility between places of residence and of economic activity could further penalise and marginalise the poorer segment of population, limiting their development prospect4 . Inadequate public transport systems compound the problem of urban sprawl and traffic congestion by further encouraging private vehicle ownership and usage. In this context, ICT can play a key role in improving the delivery and efficiency of infrastructure for sustainable development in urban areas. ICT can support the implementation of smart power grids, better water management, effective early warning systems in case of natural disasters and better transport infrastructure, also called intelligent transport systems. This is owed to important innovations and their commercialisation in a number of areas including sensing, detection and transmission equipment, innovations in data storage and processing that allow the rapid and continuous exploitation of “big data”” in urban contexts, improvements and declining costs in geo-positioning systems and of course the advent of mobile telephony (including mobile broadband).
These new technologies and their applications to infrastructure can greatly enhance the efficiency and sustainability of infrastructure services, not least in the field of transport.
The intelligence provided in context-aware systems like public transport system is implemented through channelling the contextual data being collected from the transport infrastructure into prediction systems so that behaviour of the transport system can be forecasted. The predictions, projections and surveys envisage a highly efficient information management architecture that can handle that unprecedented volume of data. Significant efforts have been made in last few years to contribute in context-aware applications regarding collaborative workspaces , context-aware computing [and context-aware social computing .
The ITSs are not only context-aware systems, but they need the collected data to be processed in real-time because the vehicles are moving objects and so information from sensors are continuously changing. This adds an element of complexity since the information is to be processed in real time to reach its end audience, the commuters . In the public transportation domain, the connotation of ITS is synonymous to the advanced public transportation system (APTS), which is defined as a “collection of technologies that increase the efficiency and safety of public transportation systems and offer users greater access to information on system
operations.
Lately, in the literature and at various forums, ITS is often used to refer to Integrated Transport Services, thus with more of an emphasis on the user. Intelligent Transportation System (ITS) enhances the performance of modern transportation systems through improved reliability in travel times and in the reduction of the risk of collisions and injuries. Overall there are 3 different used as safety technologies:
• Vehicle based systems • Infrastructure based systems • Cooperative systems
4.3 Vehicle based systems
In these types of systems, safety technologies are used inside the vehicle .
Vehicle safety equipment majorly include 2 groups of instruments, on-board sensors, that collect data and on-board units (OBUs) that use that data to compute chances of accident and may generate an alarm or may even take partial control of some features of the vehicle. These systems provide advantage of early warnings to the driver of potential dangers or override in some cases to some degree to prevent the expected collision through the driver’s control of the vehicle in attempt to avoid collisions .However, these benefits are only applicable to vehicles equipped with such equipment . When talking about safety features we refer to two types of safety features : active and passive safety features.
Active safety indicates the technology which is used in assisting the preclusion of a crash while on the other hand passive safety refers to components of the vehicle itself like airbags, seatbelts and the chassis of the vehicle that helps to protect occupants in the event of a crash. Active safety features include but are not limited to ABS, traction control and EBD, are meant to avoid an accident.
Overall there are six active safety technologies on which is being worked on for the future :
• Lane departure warning: is used when the vehicle is unintentionally sliding out of the designed lane so the driver is warned by an alert system.
• ESC (electronic stability control): one of the biggest game changing technology in auto safety in years. ESC is built on top of ABS. The sensors determine when the vehicle is moving in a wrong or dissimilar direction from its pointed destination, and uses the ABS to brake the appropriate wheels to get it back on course.
• Blind-zone warning: It senses when another vehicle is approaching your vehicle's flanks, this system
alerts the driver with a warning light and/or audible alarm. One factor that might reduce its
effectiveness is that when the warning light is on the outboard mirror, some drivers simply don't use. • Collision warning with automatic braking: By making use of a radar similar in working to that of
cruise control, this system tries to sense when the traffic ahead is slowing or stopped and generates an alert for the driver with an audible warning and will bring the car to a stop if he fails to react in time.
• Emergency brake assist: This system determines when the driver is applying the brakes in a panic
situation and applies more brake quicker. Not only might it prevent some crashes but it may reduce the severity of a crash.
• Adaptive headlights: These headlamps pivot in response to where the front wheels are pointed,
helping illuminate around curves on dark roads.
4.4 Infrastructure based systems
Infrastructure based systems are systems that are made of sensors which are located on the side of the road . Generally they are used to gather all the necessary information that are needed to warn the drivers in order to keep them safe. The difference of infrastructure based systems and vehicle based is that the first one is more advantageous because it can detect factors that the sensors on the board of the vehicles cannot detect. These factors include for example : different obstacles , various road shapes and weather conditions as well. .
4.5 Cooperative systems
Modern vehicles equipped with driver assistance systems can “feel” (e.g. by sensors), can “see” (e.g. by cameras) and in future can “speak” (e.g. by communication systems). The new technology of Cooperative Intelligent Transport Systems and Services (C-ITS) enables these communication processes of vehicles among each other (V2V) and with traffic infrastructure (V2I). It is based on the principle that all
cooperative parties (ITS stations, e.g. in vehicles, road side units) (locally) exchange information in an ad hoc network using ITS G5 wireless communication.
Fig. 6 Most important facts on transport cooperative systems
Every receiver evaluates the data received and considers the information for its data analysis, resulting in strategic warning, tactical advices and information provided to the driver. While vehicles provide data for example about their position, speed and driving direction or event-driven information, such as a defect, road side units deliver data about for example current speed limits, the signal phases and timing of traffic
The analysing receivers integrate those data to a complete picture of the local traffic situation and generate information and warnings directly relevant for the individual driver. Via a Human Machine Interface (HMI), he receives for example information about road works blocking his route or is warned in case of a potential situation, for instance if a vehicle in front of him brakes hard suddenly.
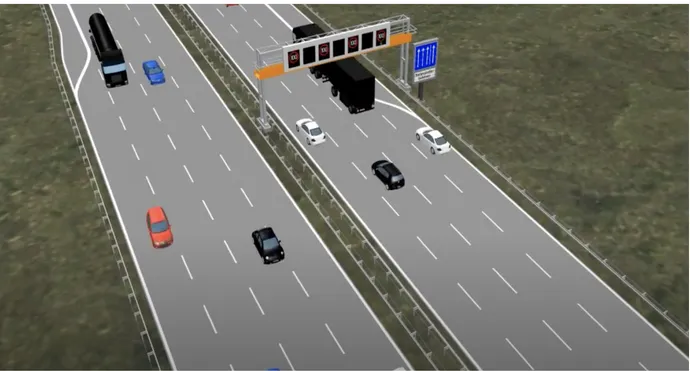
4.6 Advanced traffic management systems (ATMS)
Advanced traffic management systems is generally use in controlling the traffic. It is an integrated solution to manage highway traffic through real time information collection, processing, analysis and finally
dissemination to the users, concerned agencies and stake holders. Advanced Traffic Management Systems can be installed in both motorway and urban environments to increase and maintain transportation capacity through the more efficient use of existing infrastructure.
• Further applications of ATMS:
i. Variable speed control is used to harmonise individual vehicle speeds and control overtaking activity to keep traffic flow fluent at times with high traffic volumes.
ii. Variable Message Signs (VMS) to warn drivers from possibly hazardous conditions (incidents, congestion, heavy rain, fog etc.) and advise of route choices due to incidents can also be simulated. Both traffic-actuated and pre-timed variable message signs with varying degrees of compliance can be simulated at motorway junctions.
iii. Simulate temporary hard shoulder running to provide additional capacity during peak traffic demand.
4.7 Smart traffic signal control system
As the population in the world continuos to grow , that also causes an increase in the number of vehicles and a lack of effective traffic management would lead to huge economic lost such as energy consumption, greenhouse gas emissions, and time lost. With the continuous population growth, traffic congestion has become one of the biggest obstacles restricting the city economic development, it results in high consumptions of fuel, increases the cost of commutes, and also pollutes the environment.
A traffic signal controller, as the most important part of infrastructure in smart city transportation, is the main coordinator for the urban traffic flows. How smart traffic signal control system works is by
responding to the traffic conditions changes . This is done by controlling the signal’s length by algorithms. The purpose of smart traffic signal control is to increase throughput by minimizing delays and number of stops. In turn, pollution and travel times are reduced as well.
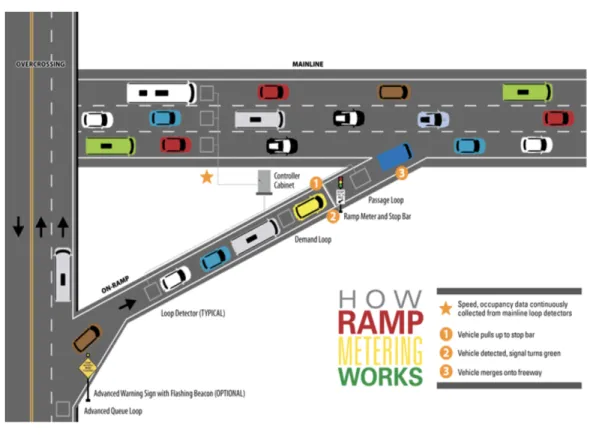
4.8. Ramp metering
Ramp metering reduces overall freeway congestion by managing the amount of traffic entering the freeway and by breaking up platoons that make it difficult to merge onto the freeway. As seen in Figure 7 vehicles traveling from an adjacent arterial onto the ramp form a queue behind the stop line. The vehicles are then individually released onto the mainline, often at a rate that is dependent on the mainline traffic volume and speed at that time.
Figure 8. Ramp metering configuration
An agency’s goals and objectives for ramp metering should be consistent with regional transportation goals and objectives, which will vary from region to region. Often these goals and objectives are driven by the needs and areas of opportunity for a region. For instance, one region may want to improve safety and another may prioritize increasing mainline speed.
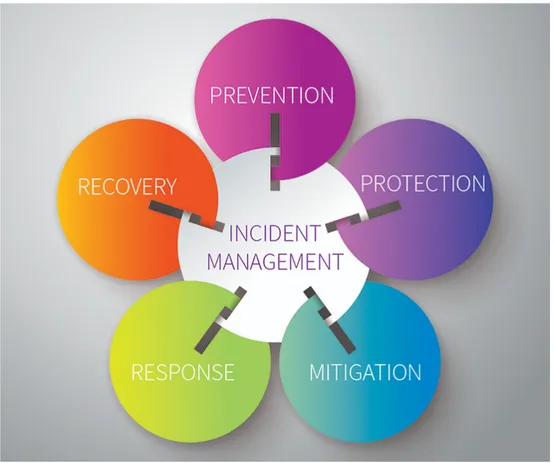
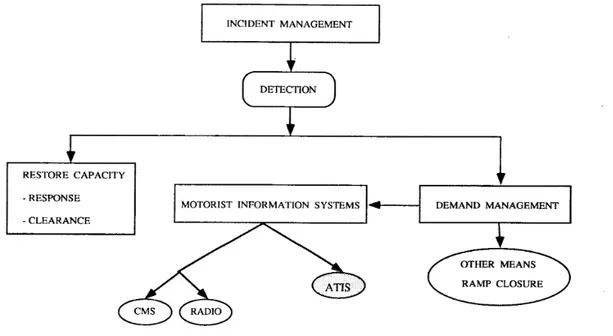
4.9 Incident Management
An incident management system is a combination of equipment, personnel, procedures and
communications that work together in an emergency to react, understand and respond. Each of the four factors is necessary in order for an incident management system to be effective.
To maximize the effectiveness of an incident management system, it is important those whose
responsibility it is to react, understand and respond, have access as much relevant data as possible about the incident in the shortest possible time. Saving time saves lives.
This is where Rave Mobile Safety’s powerful data and communication tools can be invaluable. Each can be used as an element of an incident management system, or the components combined to prepare better, respond faster and communicate more effectively during emergencies.
The objective of incident management system is :
• Increasing the visibility and communication of incidents to business and IT support staff. • Enhancing the business perception of IT through the use of a professional approach in quickly
resolving and communicating incidents when they occur
• Aligning incident management activities and priorities with those of the business. • Maintaining user satisfaction with the quality of IT services.
It might sound complicated but it does really just boil down to the earlier ITIL incident management objective of “To restore normal service operation as quickly as possible with minimum disruption to the business.
The benefits of incident management include, but are not restricted to:
•Shortening the “incident lifecycle” and decreasing downtime, thus maximizing business productivity. •Resolving incidents before they can adversely impact business operations.
•Making better use of potentially scarce IT resources. Having defined roles and responsibilities and a single, consistent process not only speeds things up but also reduces duplication of effort and wastage. •Facilitating better collaboration between different IT teams and preventing dropped issues or issues “ping-ponging” between teams.
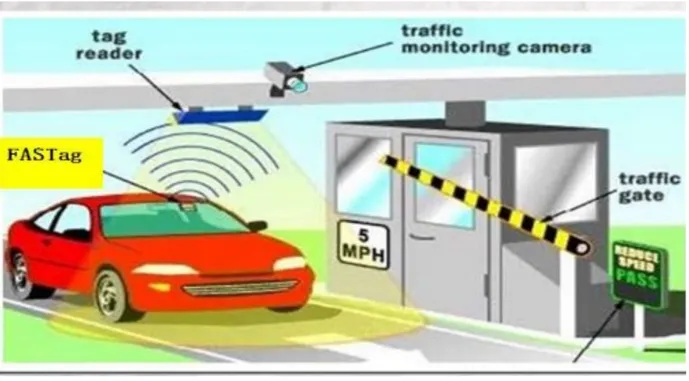
4.10 Electronic toll collection system(ETCS)
Electronic toll collection system is a system by which drivers can pay tolls without having to stop at a toll booth. is a wireless system to automatically collect the usage fee or toll charged to vehicles using toll roads, HOV lanes, toll bridges, and toll tunnels. The collection of the fees is performed electronically by way of equipment installed in the vehicles and sensors at toll location. collection as well as continuous monitoring of traffic. Electronic toll system utilizes vehicles equipped with electronic tags, wireless communication, inroad/ roadside sensors and a computerized system to uniquely identify each vehicle which electronically collect the toll and provide traffic monitoring and data collection. Functioning of electronic toll collection allow more efficient electronic monetary transaction to take place between a vehicle and toll agency The fact that drivers need not to carry any cash is one of the main reasons why electronic tolling system is becoming popular
Figure 10. Example of a ETCS
ETC also helps in controlling the level of congestion with more accuracy, by allowing the road users to use dynamic pricing instead of fixed-step toll schedule. Most importantly, the system allows non–stop service to the road users without bothering about toll rates or money change, same tag is read at toll plaza on all the Highways across the country and we save paper as well as fuel. Electronic toll collection utilizes radio frequency identification (RFID) technology. It contains RFID tag and transceiver, tag can be either active or passive and each tag has a unique identity number. Active tag has their own internal power supply allow a large range, while passive tag use incoming signal from reader thus have a shorter range. Reader contain antenna to transmit and receive signal from each tag. The tag which is sticked at the front glass of the vehicle is detected by the RFID reader and data is matched with the database provided at every toll booth, toll amount is deducted from his account, immediate gate is opened and message will be send to registered mobile number. User can recharge his account at any time. There is another facility of detection of stolen vehicle, database contain stolen directory in which stolen vehicle tag number is stored by the authority, when incoming vehicle data is matched then transaction will proceed and immediately message will send to registered police station, it is another advantage of this system.
A joint study24 conducted by the Indian Institute of Management (IIM) Calcutta and the Transport Corporation of India (TCI) showed that operational inefficiencies encountered by freight transportation vehicles at toll stations in India amounted to a total cost of nearly USD 5.4 billion; with USD 600 million for time wasted in waiting at toll stations across the country, and USD 4.8 billion for extra fuel costs incurred by the slowing down and stoppage of vehicles at toll stations. The findings of this IIM-TIC study were based upon operational efficiency surveys covering 10 major transportation routes of India. In September 2014, the Indian Government launched the first-ever national ETC programme under the name “FASTag”.
4.11 Electronic road pricing
Electronic road pricing an electronic toll collection scheme first proposed in hong kong as early as in the 1980s to manage traffic by congestion pricing. Singapore was the first to introduce congestion pricing as a tool to control traffic volume. It started by imposing a flat rate under the manually enforced Area Licensing Scheme (ALS) in 1975. The scheme was improved over the years and then upgraded to the current Electronic Road Pricing (ERP) system, which automatically charges motorists each time they pass through heavily used roads during peak hours
The FASTag system utilizes RFID devices that are affixed to the windshield of vehicles to be read by the devices installed in dedicated FASTag lanes at toll stations. The appropriate amount of toll tax, determined by the class of the vehicle, is then automatically deducted from the registered user’s account. Under the FASTag programme, ETC systems are operational at an estimated 473 toll stations across India. The first ETC system was opened on the Delhi-Mumbai highway in October last year. After the full deployment of ETC systems nationally, it is anticipated that the estimated stoppage delay at toll stations, ranging between 5% to 25% of the total journey time, will be significantly reduced.
• Advantages of Electronic Road Pricing
1. Raises Revenue for the Government. If the governments gets more tax revenue it can mean either: a. other taxes can fall,
b. the government can spend more on public transport c. or the budget deficit can reduce.
Nobody likes new taxes, but whether money is collected from new or old taxes makes no difference to the disposable income of the tax payer.
2. Increase social efficiency. In a free market the consumption of cars are overconsumed. When driving people ignore the negative externalities of congestion and pollution. The social cost is much greater than the private cost. Therefore it makes sense for the government to charge a much higher price of driving in congested areas.
3. Congestion is Inefficient Congestion costs the UK economy over £20 billion a year in lost output and wasted time. This should be tackled.
4. Reduce pollution and global warming. Pollution from cars is a significant contributor to CO2 emissions in the UK. Road charging should encourage people to look for other forms of transport which don’t pollute as much.
5. Save Journey Time - If you earn £15 an hour, why would you not like the idea of paying £7 to get home an hour earlier? Who enjoys sitting in a traffic jam?
Disadvantages of Electronic Road Pricing
1. It is an intrusion on liberty. To drive you need countless documents. When you use electricity the electric companies measure exactly how much electricity you use. When you make a telephone call the telecom company know exactly whom you ring and charge accordingly. Why should driving be any different.
2. Govt is just using it to raise money. Is that not a purpose of income tax, VAT and every other type of tax? Raising money from a new tax enables other taxes to be lowered or spending to be increased. 3. Economic output is more important than Global warming. We shouldn’t worry about the future, the most important thing is keeping taxes low for the current motorist.
4. Increases Inequality. This is true to an extent. A road pricing charge is a higher % of tax for those on low incomes. But so is the cost of buying a car and petrol. If concern about equality of distribution is an issue the govt can alter other taxes and benefits. A tax which increases efficiency need not be stopped on equality grounds. It is always possible to compensate the effects to others.
4.12 Advanced traveler information System
Advanced traveller information systems (ATIS) have gained worldwide interest as a promising technology for improving the efficiency of urban networks and reducing congestion. It is generally anticipated that the provision of route guidance to travellers will help them avoid congested links in the network, thereby reducing congestion by spreading traffic over space, and possibly time. This proposition has been so well received that technology for ATIS is being developed and tested in numerous locations around the world. The concept of ATIS is to collect and analyze data on the current performance of the highway system, and to derive information that can be disseminated to travellers on a real time basis .Information may be delivered to travellers before they start a trip or while en route. Real time traffic information can be delivered to travellers en route via two means: 1)outside the vehicle, or 2) inside the vehicle. Information delivered outside the vehicle is visual, as in the case of changeable message signs (CMS). Information delivered inside the vehicle may be visual, or it may be audio, or both, e.g Highway Advisory Radio (HAR)and in-vehicle ATE.
4.13 Intelligent speed adaption
Intelligent Speed Adaptation (ISA) is an in-vehicle system that uses information on the position of the vehicle in a network in relation to the speed limit in force at that particular location.
ISA can support drivers in helping them to comply with the speed limit everywhere in the network. This is an important advantage in comparison to the speed limiters for heavy good vehicles and coaches, which only limit the maximum speed. ISA is a collective term for various systems:
The open ISA warns the driver (visibly and/or audibly) that the speed limit is being exceeded. The driver him/herself decides whether or not to slow down. This is an informative or advisory system.
The half-open ISA increases the pressure on the accelerator pedal when the speed limit is exceeded (the 'active accelerator'). Maintaining the same speed is possible, but less comfortable because of the counter pressure.
The closed ISA limits the speed automatically if the speed limit is exceeded. It is possible to make this system mandatory or voluntary. In the latter case, drivers may choose to switch the system on or off. The currently available ISA systems are based on fixed speed limits. They may also include location-dependant (advisory) speed limits. It will become increasingly possible to include dynamic speed limits that take account of the actual circumstances at a particular moment in time.
4.14 Adaptive front lightning systems (AFS)
Adaptive front lighting systems (AFS) attempt to dynamically adjust the headlights of the vehicle so that the driver has optimum nighttime vision without compromising the safety of other road users.
The AFS uses stepper motors to control the headlight angle when the vehicle steers or the road is not even. Besides, the adaptive system tries to avoid a direct glare to oncoming vehicles. It uses headlights that consist of an array of LEDs.
Depending on the position of the oncoming car, some of these LEDs are automatically dimmed. In this way, while around the oncoming car is illuminated, the driver side is dimmed.
The AFS uses image sensors to detect the position of the oncoming vehicle. The AFS consists of several different building blocks, such as LED drivers, LED matrix managers, stepper motors, imaging sensors, MCUs, etc. To efficiently control the light intensity and direction, these blocks should be fast, efficient and accurate.
4.15 Forward collision mitigation
Forward collision warning (FCW) systems provide visual, audible, and/or tactile alerts to warn a driver of an impending collision with a car or object directly in its forward path. The Insurance Institute for
Highway Safety (IIHS) data show that FCW reduces rear-end accidents by 27 percent.
Some systems let drivers adjust the timing of this warning to early, standard, or late. This radar-based system automatically applies the brakes when there is a sudden reduction in the distance with the vehicle in front and helps to avoid a collision or reduce impact damage in the event of a collision.
4.16 Lane changing support
When activated, Lane Changing Support uses radar technology to scan the blind spot on your passenger side for other road users. If it’s not safe to change lanes, you’re alerted with a buzzer and a flashing icon next to the passenger mirror. Changing lanes always poses a risk, especially if a vehicle in the neighboring lane is going faster. Then there is the blind spot to consider – an area behind the car that is not visible in the external rearview mirrors. Valeo’s Lane Change Assist system alerts the driver if there are vehicles in this area or vehicles approaching rapidly from the rear. This information is extremely valuable, especially if the driver suddenly decides to change lane.
Vehicles passing in the opposite direction, or overtaken, are detected but not signaled. The driver receives the information in the form of a signal intelligently integrated into the exterior rearview mirror. The information is indicated immediately and intuitively.The lane change assistance system uses radar sensors that scan the surrounding area using a number of different radar beams. The fully electronic radar does not have any moving parts and operates in nearly all weather conditions.
CHAPTER 5
Adoption of ITS for Sustainable Transportation
5.1 Sustainable Development
According to Bruntland (1985), sustainability is defined as economic development that meets today’s generation needs without compromising the opportunity and ability for future generations. There are so many definitions of sustainability, and the experts have been developing the term of sustainable
development and sustainable transportation, but the experts increasingly agree that these should refer to a balance of economic, social, and environmental health. Then it can be concluded that sustainable public transport should be in accordance with sustainable development and sustainable transportation . Sustainable development within a business can create value for customer, investors, and the
environment. A sustainable business must meet customer needs while at the same time treating the environment well. To many, sustainable business is a synonymous with green business. In fact, the environment is only one aspect of sustainability. It takes much more than environmentally friendly practices for business to be truly sustainable.
An issue that has raised concerns relates to the capacity of the global economy to accommodate enduring demographic, economic, and resource consumption growth. Population growth and an increase in living standards allow individuals access to an extensive array of goods and services. Since the 1970s, many statements have been made asserting that the world would be unable to sustain such growth without a possible socioeconomic and environmental breakdown. While these perspectives have been demonstrated to be inaccurate, since resource availability and the quality of life increased, there are concerns that a threshold could be reached at some point, particularly regarding climate change. Under such conditions, sustainable development has been advocated as a priority for future social and economic development.
However, sustainable development is a complex concept that is subject to numerous interpretations since it involves several disciplines and possible interconnections. It is not surprising that the subject is prone to confusion regarding its nature, consequences, and appropriate response. It is agreed that sustainability favors conditions that benefit the environment, the economy, and the society without compromising the welfare of future generations. Still, as history clearly demonstrates, the conditions of future societies will largely depend upon the legacy of current societies on resources and the environment. All forms of assets (capital, real estate, infrastructures, resources) passed on to the next generation should be at least of equal value (utility) per capita. The basic definition of sustainability has been expanded to include three major pillars , or also known as the three Es:
1. Social equity