Open Access
Research article
Computational identification of transcription factor binding sites by
functional analysis of sets of genes sharing overrep-resented
upstream motifs
Davide Corà
1, Ferdinando Di Cunto
2, Paolo Provero
3, Lorenzo Silengo
2and
Michele Caselle*
1Address: 1Dipartimento di Fisica Teorica, Università di Torino, and INFN, sezione di Torino, Italy, 2Dipartimento di Genetica, Biologia e
Biochimica, Università di Torino, Torino, Italy and 3Fondazione per le Biotecnologie, Torino, Italy
Email: Davide Corà - [email protected]; Ferdinando Di Cunto - [email protected]; Paolo Provero - [email protected]; Lorenzo Silengo - [email protected]; Michele Caselle* - [email protected]
* Corresponding author
Abstract
Background: Transcriptional regulation is a key mechanism in the functioning of the cell, and is
mostly effected through transcription factors binding to specific recognition motifs located upstream of the coding region of the regulated gene. The computational identification of such motifs is made easier by the fact that they often appear several times in the upstream region of the regulated genes, so that the number of occurrences of relevant motifs is often significantly larger than expected by pure chance.
Results: To exploit this fact, we construct sets of genes characterized by the statistical
overrepresentation of a certain motif in their upstream regions. Then we study the functional characterization of these sets by analyzing their annotation to Gene Ontology terms. For the sets showing a statistically significant specific functional characterization, we conjecture that the upstream motif characterizing the set is a binding site for a transcription factor involved in the regulation of the genes in the set.
Conclusions: The method we propose is able to identify many known binding sites in S. cerevisiae
and new candidate targets of regulation by known transcritpion factors. Its application to less well studied organisms is likely to be valuable in the exploration of their regulatory interaction network.
Background
The regulation of gene expression in the eukaryotic cell happens at several different levels, the transcriptional one being among the most important. The general mechanism is fairly well understood, and involves the interaction between a trans-acting element, usually a protein, and a cis-acting element, a recognition site located upstream of the coding region of the regulated gene and consisting in a rather short DNA sequence to which the transcription
factor is able to bind. When bound to the cis-acting ele-ments, the trans-acting ones interfere with the transcrip-tion machinery, and can either enhance or suppress the synthesis of mRNA.
While many instances of this mechanism have been known in great detail for some time, it is only recently, thanks to the availability of several fully sequenced genomes and other experimental data on the scale of the Published: 11 May 2004
BMC Bioinformatics 2004, 5:57 doi:10.1186/1471-2105-5-57
Received: 11 November 2003 Accepted: 11 May 2004
This article is available from: http://www.biomedcentral.com/1471-2105/5/57
© 2004 Corà et al; licensee BioMed Central Ltd. This is an Open Access article: verbatim copying and redistribution of this article are permitted in all media for any purpose, provided this notice is preserved along with the article's original URL.
entire genome, that a study of transcriptional regulation on a global scale has become possible. Given the sheer size of the data, the computational aspects of this analysis are highly non-trivial, and many algorithms have been proposed to select the most relevant information and exploit it towards a better understanding of the phenomenon.
One of the most interesting problems is to identify, by purely computational means, candidate cis-acting ele-ments, so as to choose promising targets for the experi-mental investigation and thus greatly enhance its effectiveness. At first sight this task might seem prohibi-tive, since the relevant upstream motifs are rather short sequences (in the range of 5 to 20 base pairs) to be found within hundreds or thousands of base pairs upstream of the coding region. However, often the relevant motifs must be repeated many times, possibly with small varia-tions, in the upstream region for the regulatory action to be effective. This fact can be exploited to separate the sig-nal from the noise by searching the upstream region for overrepresented motifs, that is motifs appearing many more times than expected by chance on the basis of suita-bly chosen background frequencies.
This strategy was first suggested in [1] where the following method was devised to identify regulatory sites: consider a set of genes experimentally known or presumed to be coregulated (for example because they are involved in the same biological process or because they show similar expression profiles in microarray experiments). Then determine which short motifs are overrepresented in their upstream region, compared to suitably defined back-ground motif frequencies that take into account the basic features of non-coding DNA of the organism under study. These motifs are likely to be involved in the coregulation of the genes in the set.
Recently, a different method was proposed by some of us [2] which, while also based on the statistical overrepresen-tation of regulatory motifs, reverses the procedure com-pared to [1] and to most other computational methods: first, the genes are grouped based on the motifs that are overrepresented in their upstream region; then the sets of genes thus obtained are analysed from the point of view of the coregulation of the genes they contain, by studying their expression patterns in microarray experiments. The overrepresented motifs labelling the sets which do show evidence of coregulation are considered as candidate binding sites for the regulation of the genes in the set. The method was tested on yeast (S. cerevisiae) and gave satis-factory results, correctly identifying many previously known regulatory elements and proposing a few new candidates.
In this work we examine the sets of genes constructed by the same recipe from a different point of view, namely their functional characterization based on their annota-tion to Gene Ontology [3] terms, the raannota-tionale being that if a significant fraction of the genes included in the set cor-responding to a given motif share the same functional characterization, then it is likely that the motif is involved in their coregulation. This procedure for validating the sets is likely to be able to recognize different motifs com-pared to the validation through microarray data, which is limited by at least two factors: first, the specific biological processes and environmental conditions probed by each microarray experiment, and second, the fact that only rather large sets of coregulated genes are likely to produce a statistically significant signal. Therefore it can be hoped that this analysis of the sets will be able to complement and improve the one based on expression data.
Results
For all possible motifs 5 to 8 nucleotides long we gener-ated the set of genes in whose upstream region the motif is overrepresented compared to its prevalence in the upstream region of all genes. A motif occurring n times in the upstream region of a gene is considered overrepre-sented if the probability of having n or more occurrences by pure chance, computed as described in the Methods section, is less than 0.01.
Given the leniency of the cutoff used to construct the sets, essentially all possible motifs turned out to be overrepre-sented in some genes. It is important to keep in mind that no biological significance is attached to the sets of genes thus constructed before they are tested for common func-tional characterization as described below. The average number of genes in each set varied between 11.9 for 7-let-ter motifs and 41.8 for 5-let7-let-ter motifs.
The actual number of repetitions of each motif in the upstream sequence needed for a gene to be included in the set greatly varies depending on the length of the motif and of the upstream sequence and the background fre-quency of the motif. For example, 9 repetitions of the motif AAATT are needed for a 500 bp upstream sequence, but just one instance of the motif AACCGCGT is enough to make it overrepresented. The minimum number of rep-etitions for the motifs that passed the functional charac-terization test is reported in the supplementary material, together with the number of occurrences of a sample motif (ACGCG) in the upstream regions of all the genes included in its set.
We then analyzed the functional characterization of all the sets by studying the prevalence of genes annotated to each Gene Ontology term. The statistical significance of such prevalence was evaluated using the hypergeometric
distribution and the false discovery rate was estimated by comparing the results with the ones obtained for ran-domly generated gene sets. With the false discovery rate set at 0.01, a total of 107 association were established between 79 different motifs and 41 Gene Ontology terms. These results are shown in Tables 1,2,3,4,5,6.
Determination of consensus sequences
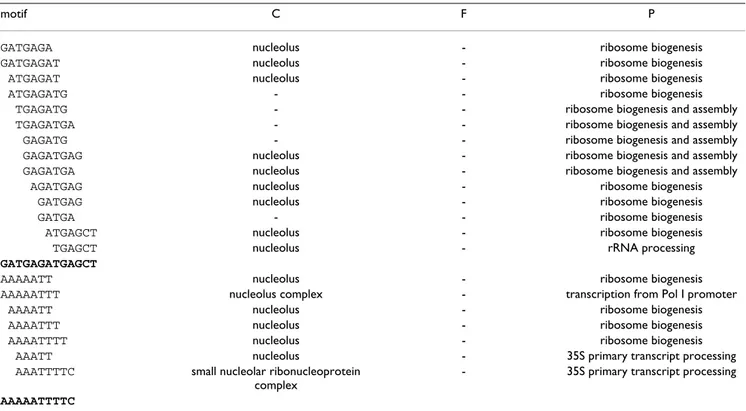
The motifs identified by the algorithm clearly form several groups: within each group the motifs are very similar to each other and are associated to the same or to very simi-lar Gene Ontology terms. For each group of motifs we report a consensus sequence obtained by aligning (by hand) the motifs corresponding to related Gene Ontology Table 1: Significant motifs associated to nucleolar proteins implicated in ribosome biogenesis. The columns titled "C", "F" and "P" correspond to the three branches of the Gene Ontology: cellular component, molecular function and biological process respectively.
motif C F P
GATGAGA nucleolus - ribosome biogenesis
GATGAGAT nucleolus - ribosome biogenesis
ATGAGAT nucleolus - ribosome biogenesis
ATGAGATG - - ribosome biogenesis
TGAGATG - - ribosome biogenesis and assembly
TGAGATGA - - ribosome biogenesis and assembly
GAGATG - - ribosome biogenesis and assembly
GAGATGAG nucleolus - ribosome biogenesis and assembly
GAGATGA nucleolus - ribosome biogenesis and assembly
AGATGAG nucleolus - ribosome biogenesis
GATGAG nucleolus - ribosome biogenesis
GATGA - - ribosome biogenesis
ATGAGCT nucleolus - ribosome biogenesis
TGAGCT nucleolus - rRNA processing
GATGAGATGAGCT
AAAAATT nucleolus - ribosome biogenesis
AAAAATTT nucleolus complex - transcription from Pol I promoter
AAAATT nucleolus - ribosome biogenesis
AAAATTT nucleolus - ribosome biogenesis
AAAATTTT nucleolus - ribosome biogenesis
AAATT nucleolus - 35S primary transcript processing
AAATTTTC small nucleolar ribonucleoprotein complex
- 35S primary transcript processing
AAAAATTTTC
Table 2: Significant motifs associated to ribosomal proteins. Here and in the following tables the column "TF" reports the transcription factors studied in Ref. [5] for which the intersection between the experimentally found targets of regulation and our sets is statistically significant.
motif C F P TF
ACCCATA cytosolic ribosome (sensu Eukarya) structural constituent of ribosome - FHL1 RAP1
ACCCATGC cytosolic ribosome (sensu Eukarya) - - FHL1 RAP1
ACCCGTAC cytosolic ribosome (sensu Eukarya) - - FHL1 RAP1
CCGCCTAC cytosolic ribosome (sensu Eukarya) - - FHL1 RAP1
CCGCCT large ribosomal subunit - - FHL1
CCCGTACA cytosolic ribosome (sensu Eukarya) - - FHL1 RAP1
CCATACAT cytosolic ribosome (sensu Eukarya) structural constituent of ribosome - FHL1
CCATACA cytosolic ribosome (sensu Eukarya) structural constituent of ribosome protein biosynthesis FHL1 RAP1
GCCTAG cytosolic ribosome (sensu Eukarya) - - FHL1
GCCTAGAC cytosolic ribosome (sensu Eukarya) - - FHL1 RAP1
GCCCA cytosol - - FHL1 RAP1
CATACAT cytosolic ribosome (sensu Eukarya) - - FHL1
terms. These consensus sequences are written in terms of the IUPAC code with the rules applied in the TRANSFAC database [4]. Note that the intrinsic variability of regula-tory binding sites, that is apparently neglected by our method since we construct the sets using fixed motifs, reappears naturally in the results when the significant motifs are grouped together.
To verify whether the consensus sequences thus obtained are of biological relevance, we considered for each of
them how many genes actually contain the consensus sequence in their upstream region, and what fraction of these are annotated to the GO terms from which the con-sensus was obtained. The results confirm the correctness of the consensus sequence thus obtained: for example 17 genes contain the sequence GATGAGATGAGCT in the upstream region, and 8 of them are annotated "nucleo-lus", while the sequence MCSMTACAY appears in the upstream region of 78 genes, 20 of which being annotated "cytosolic ribosome". The complete results are shown in Table 3: Significant motifs associated to DNA replication and nucleosome.
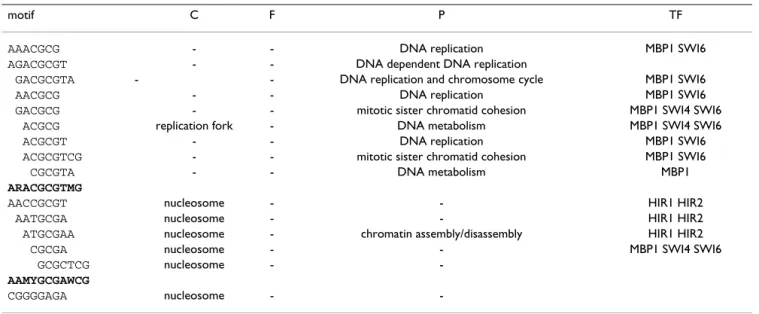
motif C F P TF
AAACGCG - - DNA replication MBP1 SWI6
AGACGCGT - - DNA dependent DNA replication
GACGCGTA - - DNA replication and chromosome cycle MBP1 SWI6
AACGCG - - DNA replication MBP1 SWI6
GACGCG - - mitotic sister chromatid cohesion MBP1 SWI4 SWI6
ACGCG replication fork - DNA metabolism MBP1 SWI4 SWI6
ACGCGT - - DNA replication MBP1 SWI6
ACGCGTCG - - mitotic sister chromatid cohesion MBP1 SWI6
CGCGTA - - DNA metabolism MBP1
ARACGCGTMG
AACCGCGT nucleosome - - HIR1 HIR2
AATGCGA nucleosome - - HIR1 HIR2
ATGCGAA nucleosome - chromatin assembly/disassembly HIR1 HIR2
CGCGA nucleosome - - MBP1 SWI4 SWI6
GCGCTCG nucleosome -
-AAMYGCGAWCG
CGGGGAGA nucleosome -
-Table 4: Other motifs with significant intersection with ChIP data.
motif C F P TF
GATGAGTC - - amino acid metabolism GCN4
ATGACT - - non-protein amino acid metabolism GCN4
GTGAGTCA - - amino acid metabolism GCN4
ATGAGTCA - - amino acid metabolism GCN4
TGAGTCAC - - amino acid biosynthesis GCN4
AGAGTCAT - - amino acid metabolism
GAGTCA - - amino acid biosynthesis BAS1 GCN4
GATGAGTCAY
TGAAAC - - sexual reproduction DIG1 STE12
TGAAACA - - sexual reproduction DIG1 STE12
TGAAACA
ACTGTG - - sulfur amino acid transport MET4
TGTGGC - - sulfur metabolism MET4 MET31
ACTGTGGC TCTAGAA - heat shoc k prot ein protein folding HSF1
Tab. 7. The only case in which the alignment does not work is the sequence AAMYGCGAWCG, which appears in 6 genes, none of which is annotated "nucleosome". In all cases except the latter one the genes annotated to the GO term are overrepresented among the ones containing the consensus sequence in their upstream region, the most significant P-value being 1.13·10-15 for genes annotated
"ctytosolic ribosome" and containing the consensus sequence MCSCMTACAY.
Tables 1,2,3,4,5,6 show also the transcription factors sig-nificantly associated to each of the motifs found: such association is determined, as described in the Materials and Methods section, as a statistically significant intersec-tion between the set of genes characterized by overrepresentation of the relevant motif and the set of genes identified in Ref. [5] as able to interact with the tran-scription factor. The large fraction of motifs identified by our method which do have a significant intersection with the sets of genes identified in Ref. [5] is proof of the effec-tiveness of our algorithm, given the completely
independ-ent approaches used to define our sets of genes and the ones of Ref. [5]. Moreover this analysis allows us to asso-ciate known transcription factors to our candidate motifs, and helps in constructing longer upstream binding sequences from the motifs we have identified.
The candidate binding sites: detailed discussion
The two largest groups of motifs (Tab. 1) are associated to nucleolar proteins implicated in ribosome biogenesis, and can be easily recognized as the known RRPE [6] and PAC [7] motifs, whose combinatorial effect in regulating the genes involved in ribosome biogenesis has been recently described in [8]. Ribosomal proteins are associ-ated to a different group of motifs (Tab. 2). The sets asso-ciated to these motifs have significant intersection with the targets of regulation by the transcription factors FHL1 and RAP1, and the motifs align well with the binding sites for these transcription factors as reported in the TRANS-FAC database and in Ref. [5].
Table 5: Motifs associated to siderophore transport and tricarboxylic acid cycle.
motif C F P
AGGGTGC - - siderophore transport
AGGGTGCA - - siderophore transport
TGGGTGCA - - siderophore transport
GGGTGCA - - siderophore transport
GGGTGC - - siderophore transport
GGTGCA - heavy metal ion porter siderophore transport
GGTGC cell wall (sensu Fungi) -
-AGGGTGCACA
CGGCGCC - - tricarboxylic acid cycle
CGGCGCCG - - tricarboxylic acid cycle
GGCGCCGA - - tricarboxylic acid cycle
GCGCCGAG - - tricarboxylic acid cycle
CGGCGCCGAG
Table 6: Other significant motifs associated to transcription factors not studied in Ref. [5].
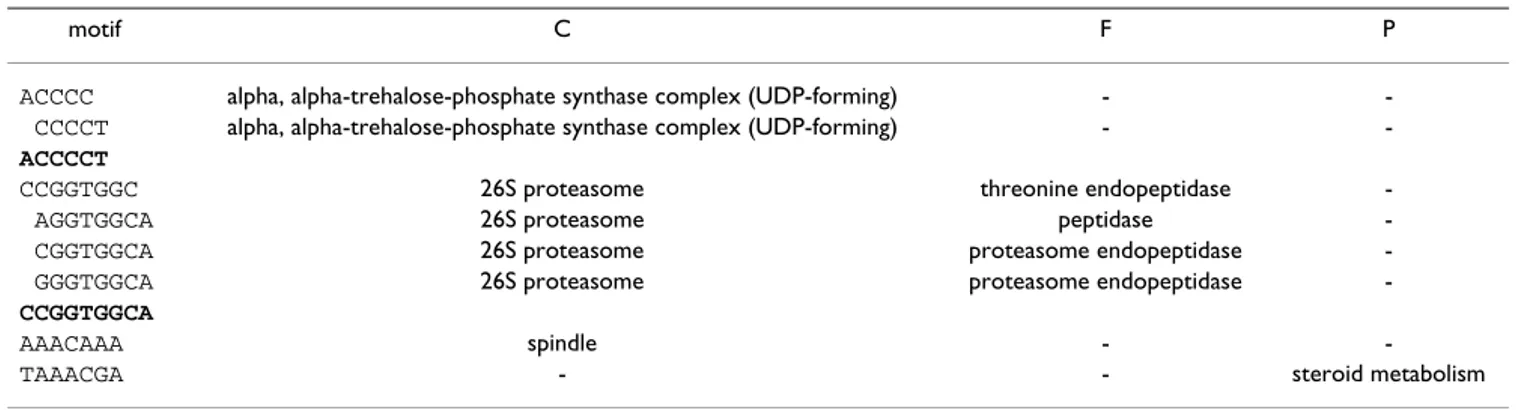
motif C F P
ACCCC alpha, alpha-trehalose-phosphate synthase complex (UDP-forming) -
-CCCCT alpha, alpha-trehalose-phosphate synthase complex (UDP-forming) -
-ACCCCT
CCGGTGGC 26S proteasome threonine endopeptidase
-AGGTGGCA 26S proteasome peptidase
-CGGTGGCA 26S proteasome proteasome endopeptidase
-GGGTGGCA 26S proteasome proteasome endopeptidase
-CCGGTGGCA
AAACAAA spindle -
A third large group of motifs displayed a strong overrepre-sentation of terms related to DNA replication. For this group, the consensus sequence perfectly overlaps with one of the putative Mbp1 binding sites proposed in Ref. [5]. Interestingly, together with the regulatory subunit Swi6, this protein forms the MluI Binding Factor (MBF), a cru-cial regulator of the G1/S transition [9]. A few slightly var-iant motifs and a completely different one (CGGGGAGA) are associated with the annotation "nucleosome". Besides these large groups, in other four cases the consen-sus sequence obtained by merging motifs with similar annotation perfectly overlapped with the transcription factor binding sites predicted on the basis of the chromatin IP experiments, as well as with the experimen-tally determined sequences as reported in the TRANSFAC database. In particular, perfect consensus sequences for GCN4, Ste12, Hsf1 and MET4 were obtained from motifs annotated amino acid biosynthesis, sexual reproduction, heat shock protein and sulfur amino acid biosynthesis, respectively (Tab. 4).
Interestingly, in some instances a perfect match of the sur-viving motifs with a known binding site could be obtained by analysis of the literature, even though it was not reported in Chromatin IP experiments, as shown by the results reported in Tabs. 5 and 6. In particular, the sets characterized by the annotation 'siderophore transport' perfectly match the binding site for the Aft1p/2p transcription factors, recently identified as critical regula-tors of iron uptake [10]. The sets characterized by the annotation 'tricarboxylic acid cycle' match the known binding site of the UME6, a pleiotropic regulator impli-cated in glucose repression [11].
The sets characterized by the annotation alpha-trealose phosphate synthase complex match the Stress Response Element (STRE) [12], a result consistent with the described accumulation of trehalose under stress condi-tions [13].
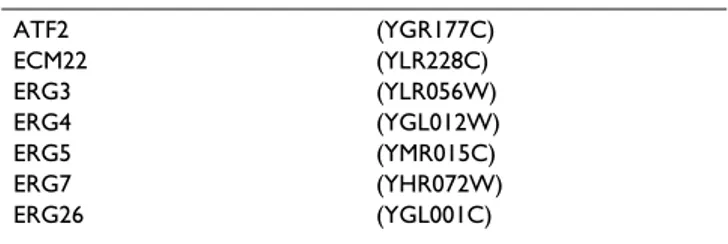
The motif TCGTTTA, associated with the keyword 'steroid metabolism' corresponds fairly well to the TCGTATA Sterol Response Element (SRE), recently identified by pro-moter comparison of the ERG2 and ERG3 genes [14]. Therefore the genes that are in the corresponding set and are annotated to "steroid metabolism" (listed in Tab. 8) can be considered as candidate targets of regulation by UPC2p and ECM22p, that is the transcription factors identified in Ref. [14] as binding to the SRE site. Interest-ingly, ECM22 itself belongs to the set corresponding to the motif TCGTTTA, hinting to a feedback mechanism in the regulation of steroid metabolism.
A particularly interesting result is given by the word AAACAAA, associated with the annotation 'spindle', and in particular with spindle pole bodies structure and/or function. In this case, no transcription factors binding to the respective promoters were identified in Ref. [5]. How-ever the motif perfectly matches the Hcm1p binding site, experimentally determined in the promoter of the spindle pole component SPC110 (WAAYAAACAAW, Ref. [15]). Accordingly, Hcm1p has been implicated, by a different ChIP analysis [16], as one of the potential regulators of spindle pole body genes, even though 8 of the 9 genes (the exception is CIN8) identified by our approach and listed in Tab. 9 are not included in the list of the 262 potential Hcm1p targets. More precisely Tab. 9 lists the genes that are included in the set corresponding to the motif Table 7: Genome prevalence of the consensus sequences constructed by aligning the motifs found significant by the algorithm, and functional characterization of the corresponding genes. The second column contains the total number of genes in the yeast genome in which the consensus sequence is found at least once in the upstream region. The third column reports one of the annotation terms to which the consensus sequence is associated, and the number of genes annotated to the term among the ones containing the consensus sequence.
Consensus sequence Total genes
Annotated genes
GATGAGATAGCT 17 nucleolus (8) AAAAATTTTC 233 nucleolus (37) MCSCMTACAY 78 cytosolic ribosome (20)
ARACGCGTMG 15 DNA replication and chromosome cycle (2) AAMYGCGAWCG 6 nucleosome (0)
GATGAGTCAY 5 amino-acid metabolism (3) TGAAACA 560 sexual reproduction (26) AGGGTGCA 40 siderophore transport (5) CGGCGCCGAG 5 tricarboxylic acid cycle (3)
ACCCCT 434 alpha, alpha-trehalose phosphate synthase complex (UDP-forming) (2) CCGGTGGC 17 26S proteasome (6)
AAACAAA and are annotated to the term "spindle". Our results strongly suggest that these genes are potential tar-gets of the Hcm1 transcription factor.
Finally the consensus sequence derived from motifs with a significant overrepresentation of 'proteasome' perfectly corresponds to the proteasomal element identified in Ref. [17] through a different computational approach, to which no transcription factors have been experimentally associated.
Functional characterization of the sets corresponding to candidate binding sites
The statistical significance of the associations we made between motifs and Gene Ontology terms is based on the overrepresentation of genes annotated to the term in the set of genes defined by the motif: clearly not all genes in the various sets are annotated to the term itself. It is therefore interesting to examine the annotation of the genes in the set that are not annotated to the relevant term. To perform this analysis in a systematic way, we defined, for each Gene Ontology term, three categories of genes:
• Genes annotated to the term, i.e. directly annotated to the term itself or to any of its descendants in the Gene Ontol-ogy graph
• Genes whose annotation is compatible with the term, defined as genes that are either directly annotated to an ancestor of the term, or to "cellular component
unknown", etc. or finally genes which do not have any annotation in the relevant branch of the Gene Ontology • All other genes are considered incompatible with the Gene Ontology term
For example if the term at hand is "nucleolus", a gene annotated "nucleus" is considered compatible, while a gene annotated "cytoplasm" is incompatible.
A few examples of the results of this analysis: the set defined by the CCATACA motif includes a total of 19 genes: 10 of them are annotated "ribosome biogenesis", 2 are compatible with such annotation and the remaining 7 are incompatible. The AAACAAA set includes 55 genes: 9 of them are annotated "spindle", 31 are compatible with such annotation and 15 are incompatible. The complete results are available in the supplementary material.
Localization of the candidate binding sites with respect to the Transcription Start Site
It is interesting to investigate possible correlations between the location of the (candidate) binding sites that we find and the Transcription Starting Site (TSS in the fol-lowing) of the genes. Ideally one would expect these bind-ing sites to be preferentially located upstream with respect to the TSS and clustered in the first 100–200 bases upstream the TSS. This test however is rather non trivial due to the lack of systematic knowledge of TSS's. Among the possible sources of information on the TSS's we decided to use UTRDB [18] which contains 5' UTR sequences for 330 yeast genes. We looked at the intersec-tion between these 330 gene and our sets for the candidate binding sites listed in Tab. 1,2,3,4,5,6. We selected for a deeper analysis the intesection corresponding to the con-sensus sequence GATGAGATGAGCT. The intersection contains 6 genes which are shown in Fig. 1 and a total of 18 instances of the candidate binding sites. As it can be seen from the figure the majority (66%) of the binding sites are located upstream of the TSS and half of them are within 200 bases from the TSS. However this a slightly misleading indicator since some of the UTR's are very short in length. If we look instead at the density of binding sites, i.e. at the ratio between the number of instances and the length of the observed sequence, we find a slightly higher density in the UTR regions (about 1 instance every 100 bases) with respect to the truly upstream regions (1 instance every 150 bases). We plan to address this subject in a more complete way in a future work.
Control analyses
Recently a major revision of the list of yeast ORFs, and in particular the elimination of many putative ORFs, was suggested in Ref. [19] through comparison with closely related organisms. To verify whether such changes in the Table 8: Candidate targets of regulation by the UPC2p and
ECM22p transcription factors.
ATF2 (YGR177C) ECM22 (YLR228C) ERG3 (YLR056W) ERG4 (YGL012W) ERG5 (YMR015C) ERG7 (YHR072W) ERG26 (YGL001C)
Table 9: Candidate targets of regulation by the Hcm1p transcription factor. MPS1 (YDL028C) CIN8 (YEL061C) PDS1 (YDR113C) SPC98 (YNL126W) VIK1 (YPL253C) SPC25 (YER018C) ESP1 (YGR098C) STU2 (YLR045C) SLI15 (YBR156C)
annotation of the genome had an important effect on our results, we repeated our analysis without the ~500 ORFs that Ref [19] suggests to eliminate; the results however did not change in any significant way (data not shown), clearly because most of the ORFs to be eliminated are not annotated to Gene Ontology terms.
Finally, as a general check of the soundness of this proce-dure, we repeated the whole analysis on sequences which are not assumed to be as relevant to transcriptional regulation as the upstream sequences we have studied in depth. More precisely, we selected all yeast intergenic regions that are not upstream of any gene and we associ-ated each region to the genes with respect to which the sequence is located downstream. Then we repeated the whole analysis in precisely the same way as for the upstream regions: no significant results were found with a false discovery rate of 0.01.
Discussion
The technique we have proposed in this paper is able to identify many binding sites related to functional groups of different size. The binding sites we identified were all previously known from different methods (in some cases from computational analyses only). This is explained partly by the fact that yeast is among the best-known organisms for what concerns transcriptional regulation,
and partly by our very restrictive choice of false discovery rate (1%). Indeed the main goal of our analysis was to show that the method, and in particular the statistical analysis used to establish the significance of the results, is reliable, and can therefore be used on less well known organisms where it is likely to produce new candidate binding sites.
Besides identifying new binding sites, our method could be extremely valuable in identifying new potential targets of known transcription factors. Indeed, in the case of Hcm1p we were able to identify 8 new potential target genes that were not identified in chromatin immunopre-cipitation experiments.
An important aspect of our technique is that the gene sets are based exclusively on the upstream sequence. Therefore the same sets can be validated from the biological point of view in many different ways, of which the use of microar-ray results, as in Ref. [2], of Gene Ontology annotations and of the results of chromatin immunoprecipitation experiments (as in the present paper) are just the most natural examples. These different validation methods can reveal different binding sites and should be combined whenever possible: for example of all the binding sites revealed in the present analysis, only the ones pertaining to the regulation of ribosome biogenesis and the stress Location of the motifs belonging to the consensus GATGAGATGAGCT with respect to the translation and transcription start sites for 6 genes for which the latter is known
Figure 1
Location of the motifs belonging to the consensus GATGAGATGAGCT with respect to the translation and transcription start sites for 6 genes for which the latter is known. The binding sites are denoted by rectangles above or below the line depending on whether the consensus sequence is read on the Crick or Watson strand respectively. The vertical bar is the transcription start site, as given in Ref. [20].
ANP1 TRK2 VMA10 RNT1 PMI40 RPA190
response element CCCCT had been previously identified by the microarray validation of Ref. [2]. Conversely, the AGCCGCGC binding site of the UME6 transcription fac-tor, correctly identified in Ref. [2], was not found in the present one.
Another possible development of this line of research is the construction of sets of genes labeled by spaced dyads instead of simple sequences [20]. These sets could then be validated either based on the overrepresentation of Gene Ontology annotations, as in the present work, or based on their coexpression as determined in microarray experi-ments as in Ref. [2].
Conclusions
We have presented a new algorithm for the identification by computational means of transcription factor binding sites. The algorithm proceeds by first defining sets of genes having in common the overrepresentation of a certain short DNA sequence in their upstream region, and then selecting among all these sets the ones showing a statisti-cally significant overrepresentation of genes annotated to specific Gene Ontology terms.
When applied to yeast the algorithm is able to independ-ently find many known transcription factor binding sites. It is therefore likely that our algorithm could be profitably used in the study of transcripional regulation in higher eukaryotes and in humans in particular. Here the method needs to be modified, to take into account the increased complexity of the problem: the strategy we are currently following is to limit the analysis to those upstream regions that are highly conserved in mouse and human. These conserved regions are likely to contain many bind-ing sites, and are short enough to provide a suitable signal to noise ratio. The results will be presented in a forthcom-ing publication.
While most regulatory binding sites are found upstream of the coding sequence, regulatory regions can often be found, for example, in the 3' region or within the first intron: the method we have presented can in principle be applied, with suitable modifications, to the investigation of such regions. Moreover, similar methods could be devised for the computational identification of other functionally relevant DNA sites.
Methods
Upstream sequences
For all yeast open reading frames (ORFs) we considered up to 500 bp upstream of the translation start, cutting the sequence shorter when necessary to prevent overlapping with the coding region of neighboring ORFs. The sequences were obtained from the Regulatory Sequence Analysis Tool [21].
Purging repeated upstream sequences
Genes with highly similar upstream regions are a likely source of false positives, especially when similarly anno-tated. Consider for example the ASP3 gene, which appears in four copies in the genome, with nearly identical upstream regions, and identical Gene Ontology annota-tions. Clearly these four upstream regions must be counted as one to avoid introducing a bias that is likely to generate false positives. To avoid these problems, we first used BLAST [22] to list all the pairs of nearly identical upstream sequences (Blast P-value less than 10-90). Then
we used these results to form clusters of nearly identical upstream regions (that is the connected components of the graph constructed by joining with an edge all pairs of nearly identical upstream sequences). Finally, we retained for further analysis only one gene per group, chosen at random. After this procedure we were left with 6,037 upstream sequences which we retained for further analysis.
Motifs analyzed
We considered all possible DNA sequences 5 to 8 base pairs long. Occurrences of each motif were counted on both strands: therefore, for example, the motifs CCCCT and AGGGG are considered as the same motif, and the number of occurrences of this motif is the sum of the number of occurrences of CCCCT and AGGGG on one strand. For palindrome motifs (such as AGGCCT) the number of occurrences is simply the number of occur-rences on one strand.
Background frequencies
The determination of which motifs are overrepresented in each upstream region needs the definition of a back-ground frequency to which the number of actual occur-rences is compared. We chose to use the frequency of each motif in the set of all the upstream sequences considered in the study, taken as a single sample. Denote by U(g) the length of the upstream region considered for a gene g (500 bp or less in this study, see above), and by n(m, g) the number of occurrences of the motif m in such region. If b(m) is the length of m, the background frequency f(m) of m is defined as
where both sums are taken over all the yeast ORFs. In the denominator
u(g, m) ≡ U(g) - b(m) + 1
is the number of words of length b(m) that can be read in the upstream region of g.
f m n m g u g m g g
( )
=(
)
(
)
( )
∑
∑
, , 1Overrepresented motifs
The null hypothesis we use to determine whether a motif is overrepresented in the upstream region of a gene is the same as in Refs. [1] and [2]: motifs are distributed ran-domly, each with its own background frequency, in the upstream regions. The probability of having n(m, g) or more occurrences of m in the upstream region of g depends on the background frequency of m and the length U(g) of the upstream region of g, and is given by the right tail of the binomial distribution:
Notice that the binomial distribution is based on the assumption that the motifs read successively in the upstream sequence are independent of each other; while this is obviously not the case, the motifs we study (5 base pairs or longer) are sufficiently rare that this aspect can be safely neglected.
The motif m is considered overrepresented in the upstream region of g if the probability
P(n(m, g), f(m), U(g))
is lower than a certain cutoff. In this study we fixed the cutoff at 0.01. It is important to keep in mind that no bio-logical significance is attributed to this overrepresentation by itself: only the motifs that pass the functional characterization test described below will be retained in the final results. Therefore the choice of this cutoff can be arbitrarily lenient. While it would seem natural to make the cutoff more strict as the word length is increased, to take into account the larger number of words analysed, our experience, also gained with the microarray analysis of reference [2] shows that many significant results would be lost in this way. The result of this analysis is, for each motif m, a set S(m) of genes in whose upstream region m is overrepresented.
Functional characterization of the sets S(m)
The final step is the analysis of the annotation of the genes included in each set S(m), to select the sets characterized by a strong functional characterization and hence the can-didate binding sites. For each set S(m) we computed the prevalence of all Gene Ontology (GO) terms among the annotated genes in the set, and the probability that such prevalence would occur in a randomly chosen set of genes of the same size. We always consider a gene annotated to a GO term if it is directly annotated to it or to any of its descendants in the GO graph. For a given GO term t let K(t) be the total number of ORFs annotated to it in the genome, and k(m, t) the number of ORFs annotated to it in the set S(m). If J and j(m) denote the number of ORFs
in the genome and in S(m) respectively, such probability is given by the right tail of the appropriate hypergeometric distribution:
where
In this way a P-value can be associated to each pair made of a motif and a Gene Ontology term. A low P-value indi-cates that the overrepresentation of the motif is correlated to the functional characterization described by the GO term, and hence suggests the motif as a candidate binding site for the genes with such functional characterization.
Determining the cutoff on P-values
Given the huge number of P-values that we compute (in principle equal to the number of GO terms multiplied by the number of motifs analysed) it is clear that very low P-values could appear simply by chance. Therefore a careful analysis is required to keep under control the number of false positives. The usual way of dealing with this issue, that is the Bonferroni correction, is not appropriate, because due to the hierarchical nature of the Gene Ontol-ogy annotation scheme, the P-values we compute are very far from being independent from each other (for example, for a given motif, the P-values associated to terms such as 'cell cycle and DNA replication' and 'chromosome cycle' are obviously strongly correlated to each other). We decided therefore to adopt an empirical approach allow-ing us to fix the false discovery rate without any prior assumption regarding the distribution of the P-values. First, we randomly generated a large number NR of sets of genes comparable in size to the typical size of the sets associated to the motifs. For each of these sets we com-puted the P-values associated to all the GO terms with the same formula used for the "true" sets. For each random set we considered only the best P-value obtained for each of the three branches of the Gene Ontology, and we ranked the random sets based on this best P-value. In this way we can determine a false discovery probability pf (C) as a function of the cutoff on P-values C, defined as
P n m g f m U g u g m k f m f m k u g m , , , , , ( ) ( ) ( ) ( )= ( ) ( ) 1− ( )( )−− =( ) ( ) ∑ k ( ) k n m g u g m , , 2 P J K t j m k m t F J K t j m h h k m t j m K t , , , , , , , , min , ( ) ( ) ( )
(
)
=(
( ) ( ))
=( ) ( ) ( ) (( ) ∑ ( )3 F M m N n m n M m N n M N , , ,(
)
= −− ( )
4 p C n C N f f R( )
=( )
( )
5where nf (C) is the number of random sets whose best P-value is less than C.
Equipped with the function pf (C), we can estimate the ratio of false discoveries among our true sets, as a function of C: if N is the total number of true sets examined, the expected number of false discoveries with cutoff C is Npf (C). Therefore if n(C) is the number of true sets with best P-value less than C we can estimate the false discovery rate (FDR) to be
In this way we can choose C based on the desired false dis-covery rate. Clearly the lower is the FDR required, the higher is the precision required in determining the func-tion pf (C) for low values of C, and hence the number NR of sets to be generated randomly. In our case we set the false discovery rate at 0.01: a reliable estimate of the cor-responding cutoffs in P-value required the generation of 3.5 million randomly chosen sets of 20 genes (which is the typical size for the true sets corresponding to overrepresented motifs 5 to 8 bp long). Simulations per-formed with other choices of the set size did not differ enough to change significantly our estimate of the false discovery rate.
Comparison with experimentaly determined associations between transcription factors and regulated genes
We performed a systematic comparison between the sets of genes identified as significantly associated to one or more GO terms and the sets of genes that were determined in Ref. [5] to be capable of interacting with each of 106 known transcription factors. For each of these transcrip-tion factors we defined a set of regulated genes (called "TF set" in the following) by considering all the genes with P-value less than 0.001 for interaction with the TF according to the supplementary material of Ref. [5]. Then for each of the sets identified as significant by our method we consid-ered its intersection with all the TF sets, and computed a related P-value: the probability that a randomly chosen set of genes has an intersection equal to or greater (in number of elements) than the one actually found (given by the same hypergeometric distribution used to deter-mine the overrepresentation of GO annotations). We con-sidered the result statistically significant when this intersection P-value was less than 10-5.
Authors' contributions
DC implemented most of the algorithms and also parteci-pated in the project design. FDC performed the literature mining for the assignement of the identified putative binding sites to known transcription factors. PP contrib-uted to the algorithm implementation and wrote the
manuscript. LS supervised the analysis concerning the biological significance of the putative binding sites. MC coordinated the whole project. All the authors have read and approved the final manuscript.
Additional material
Acknowledgements
We thank Manuela Helmer-Citterich, Carl Herrmann and Maurizio Pel-legrino for inspiring discussions. We are also grateful to the anonymous ref-erees whose comments and suggestions allowed a significant improvement of the work.
References
1. van Helden J, André B, Collado-Vides J: Extracting Regulatory Sites from the Upstream Region of Yeast Genes by Compu-tational Analysis of Oligonucleotide Frequencies. J Mol Biol 1998, 281:827-842.
2. Caselle M, Di Cunto F, Provero P: Correlating overrepresented upstream motifs to gene expression: a computational approach to regulatory element discovery in eukaryotes.
BMC Bioinformatics 2002, 3:7.
3. The Gene Ontology Consortium: Gene Ontology: tool for the unification of biology. Nature Genetics 2000, 25:25-9.
4. Matys V, et al.: TRANSFAC: transcriptional regulation from patterns to profiles. Nucleic Acids Research 2003, 31:374-8. 5. Lee TI, et al.: Transcriptional regulatory networks in
Saccha-romyces cerevisiae. Science 2002, 298:799-804.
6. Hughes JD, Estep PW, Tavazoie S, Church GM: Computational identification of cis-regulatory elements associated with groups of functionally related genes in Saccharomyces cerevisiae. J Mol Biol 2000, 296:1205-14.
7. Dequard-Chablat M, Riva M, Carles C, Sentenac A: RPC19, the gene for a subunit common to yeast RNA polymerase A (I) and C (III). J Biol Chem 1991, 266:15300.
8. Sudarsanam P, Pilpel Y, Church GM: Genome-wide co-occur-rence of promoter elements reveals a cis-regulatory
cas-NP C n C
f
( )
( )
.Additional File 1
For all sets found significant by the algorithm this table shows the back-ground frequency of the motif, and the number of instances required for the motif to be overrepresented in a 500 bp long upstream sequence. For shorter upstream sequences less repetitions are needed in general.
Click here for file
[http://www.biomedcentral.com/content/supplementary/1471-2105-5-57-S1.txt]
Additional File 2
For all sets found significant by the algorithm the table reports the corre-sponding Gene Ontology term and the number of genes annotated to the term, compatible and incompatible with the term (see text for the defini-tion of "compatible" and "incompatible").
Click here for file
[http://www.biomedcentral.com/content/supplementary/1471-2105-5-57-S2.txt]
Additional File 3
The number of occurrences of the motif ACGCG (associated to "replica-tion fork" and "DNA metabolism") in all the genes belonging to its set, and the length of the corresponding upstream region.
Click here for file
[http://www.biomedcentral.com/content/supplementary/1471-2105-5-57-S3.txt]
Publish with BioMed Central and every scientist can read your work free of charge "BioMed Central will be the most significant development for disseminating the results of biomedical researc h in our lifetime."
Sir Paul Nurse, Cancer Research UK
Your research papers will be:
available free of charge to the entire biomedical community peer reviewed and published immediately upon acceptance cited in PubMed and archived on PubMed Central yours — you keep the copyright
Submit your manuscript here:
http://www.biomedcentral.com/info/publishing_adv.asp
BioMedcentral
sette of rRNA transcription motifs in S. cerevisiae. Genome
Research 2002, 12:1723.
9. Primig M, Sockanathan S, Auer H, Nasmyth K: Anatomy of a tran-scription factor important for the start of the cell cycle in Saccharomyces cerevisiae. Nature 1992, 358:593.
10. Rutherford JC, Jaron S, Winge DR: Aft1p and Aft2p mediate iron-responsive gene expression in yeast through related pro-moter elements. J Biol Chem 2003, 278:27636.
11. Kratzer S, Schuller HJ: Transcriptional control of the yeast acetyl-CoA synthetase gene, ACS1, by the positive regula-tors CAT8 and ADR1 and the pleiotropic repressor UME6.
Mol Microbiol 1997, 26:631.
12. Martinez-Pastor MT, Marchler G, Schuller C, Marchler-Bauer A, Ruis H, Estruch F: The Saccharomyces cerevisiae zinc finger pro-teins Msn2p and Msn4p are required for transcriptional induction through the stress response element (STRE).
EMBO J 1996, 15:2227-35.
13. Winderickx J, de Winde JH, Crauwels M, Hino A, Hohmann S, Van Dijck P, Thevelein JM: Regulation of genes encoding subunits of the trehalose synthase complex in Saccharomyces cerevi-siae: novel variations of STRE-mediated transcription control. Mol Gen Genet 1996, 252:470-82.
14. Vik A, Rine J: Upc2p and Ecm22p, dual regulators of sterol bio-synthesis in Saccharomyces cerevisiae. Mol Cell Biol 2001, 21:6395.
15. Zhu G, Davis TN: The fork head transcription factor Hcm1p participates in the regulation of SPC110, which encodes the calmodulin-binding protein in the yeast spindle pole body.
Biochim Biophys Acta 1998, 1448:236.
16. Horak CE, Luscombe NM, Qian J, Bertone P, Piccirrillo S, Gerstein M, Snyder M: Complex transcriptional circuitry at the G1/S tran-sition in Saccharomyces cerevisiae. Genes Dev 2002, 16:3017. 17. Jensen LJ, Knudsen S: Automatic discovery of regulatory
pat-terns in promoter regions based on whole cell expression data and functional annotation. Bioinformatics 2000, 16:326. 18. Pesole G, Liuni S, Grillo G, Ippedico M, Larizza A, Makalowski W,
Sac-cone C: UTRDB: a specialized database of 5' and 3' untrans-lated regions of eukaryotic mRNAs. Nucleic Acids Research 1999, 27:188.
19. Kellis M, Patterson N, Endrizzi M, Birren B, Lander ES: Sequencing and comparison of yeast species to identify genes and regu-latory elements. Nature 2003, 423:241.
20. van Helden J, Rios AF, Collado-Vides J: Sequencing and compari-son of yeast species to identify genes and regulatory elements. Nucleic Acids Res 2000, 28:1808.
21. van Helden J: Regulatory Sequence Analysis Tools. Nucleic Acids
Research 2003, 31:3593-6 [http://rsat.scmbb.ulb.ac.be/rsat/].
22. Altschul SF, Gish W, Miller W, Myers EW, Lipman DJ: Basic local alignment search tool. J Mol Bol 1990, 215:403-10.