Aromatic and proteomic analyses
corroborate the distinction
between Mediterranean landraces
and modern varieties of durum
wheat
Federico Vita
1, Cosimo Taiti
2, Antonio Pompeiano
3, Zuguang Gu
4,5, Emilio Lo Presti
6,
Larisa Whitney
7, Michele Monti
6, Giuseppe Di Miceli
8,9, Dario Giambalvo
8, Paolo Ruisi
8,
Lorenzo Guglielminetti
1& Stefano Mancuso
2In this paper volatile organic compounds (VOCs) from durum wheat cultivars and landraces were analyzed using PTR-TOF-MS. The aim was to characterize the VOC’s profile of the wholemeal flour and of the kernel to find out if any VOCs were specific to varieties and sample matrices. The VOC data is accompanied by SDS-PAGE analyses of the storage proteins (gliadins and glutenins). Statistical analyses was carried out both on the signals obtained by MS and on the protein profiles. The difference between the VOC profile of two cultivars or two preparations of the same sample - matrices, in this case kernel vs wholemeal flour - can be very subtle; the high resolution of PTR-TOF-MS - down to levels as low as pptv - made it possible to recognize these differences. The effects of grinding on the VOC profiles were analyzed using SIMPER and Tanglegram statistical methods. Our results show that it is possible describe samples using VOC profiles and protein data.
Wheat is the most cultivated crop in temperate regions, and is widely used for human food and livestock feed1. The global production of wheat (2015) was 733 MT (http://www.fao.org/worldfoodsituation/csdb/en/). The two most popular species are “bread” or spring wheat (Triticum aestivum L.) and “pasta” or durum wheat (Triticum
durum Desf.) that occur as natural intergeneric hybrids2. About 95% of the wheat currently grown worldwide is hexaploid spring wheat; it is sown in almost every agricultural region of the globe1. The remaining 5% of the world production is the tetraploid durum wheat, though within the Mediterranean basin it is one of the leading food crops where it is the primary cereal grain used in the production of pasta and certain bread3,4 products. Italy is the world’s top producer of pasta and has the highest pro capita consumption rate (http://www.international-pasta.org). In Italy, given its economic importance, durum wheat has long been a focus of breeding programs, from which numerous cultivars have derived. Many of these cultivars are currently grown both inside and outside the country. Historically in Italy, we can distinguish three main periods in breeding trends in the 20th and 21th century. Landraces and genealogical selections (‘old’ cultivars) characterized the pre-1950 era. Starting around 1Department of Agriculture, Food and Environment, University of Pisa, Via Mariscoglio 34, 56124, Pisa, Italy. 2LINV-Department of Plant Soil and Environmental Science, University of Florence, Viale delle idee 30, I-50019 Sesto-Fiorentino (FI), Florence, Italy. 3Laboratory of Ecological Plant Physiology, Global Change Research Institute CAS, Bělidla 986/4a, CZ-603 00 Brno, Czech Republic. 4Division of Theoretical Bioinformatics (B080), German Cancer Research Center (DKFZ), Im Neuenheimer Feld 280, 69120 Heidelberg, Germany. 5Heidelberg Center for Personalized Oncology (DKFZ-HIPO), German Cancer Research Center (DKFZ), Im Neuenheimer Feld 280, 69120 Heidelberg, Germany. 6Department of Agricultural Sciences, Mediterranean University of Reggio Calabria, Salita Melissari, 89124 Reggio Calabria, Italy. 7DISVA, Department of Life and Environmental Science, Marche Polytechnic University, Via Brecce Bianche, 60131, Ancona, Italy. 8Department of Agricultural and Forest Sciences, University of Palermo, Viale delle Scienze, Ed. 4, 90128 Palermo, Italy. 9Fondazione A. e S. Lima Mancuso, Piazza Marina, 61-90133 Palermo, Italy. Correspondence and requests for materials should be addressed to A.P. (email: [email protected])
received: 30 April 2016 accepted: 11 August 2016 Published: 06 October 2016
OPEN
1950 and for the next quarter century or so, new mutagenesis5 and crossing techniques were added to the effort to obtain cultivars with improved yield (‘intermediate’ cultivars). Cultivars developed post-1974 (‘modern’ culti-vars) contain Rht genes which created shorter plants and thus reduced lodging, but also modified the properties of the gluten in a way that was favorable for the texture of bread and pasta products6. These modern cultures have consequently displaced the older cultivars and landraces7,8.
In modern cultivars, improvements in yield and is most often measured in terms of the response to different nitrogen availabilities and varying thermo-photoperiodicity before and after anthesis5. Genetic erosion resulting from the displacement of landraces is a significant problem in current breeding programs7. It is likely that the old cultivars are the most valuable source of genetic diversity and consequently these may hold the potential intro-ducing many desirable traits into the modern cultivars. Indeed, this is the case for some Mediterranean durum landraces9. Therefore, the local landraces could potentially provide a source of new alleles for the improvement of commercial value7. The introgression of these alleles that allow for growth in suboptimal environments is currently of particular interest10. Traits of interest could include resilience of plants faced with adverse conditions such as pests attacks, diseases, adaptability to low-input farming, and abiotic stressors11,12. Although the way quality is defined does to an extend depend on the intermediary user and the intended end-use13, at least two studies have shown how increased genetic variability may correlate with traits often associated with quality14,15. Gluten strength is a key factor used to define durum wheat quality16. The genotype of a cultivar can influence gluten strengh by determining the quantity of gluten proteins which accumulate in the grain, and also quality - as defined by the specific alleles present. Gluten proteins are classified into gliadins and glutenins based on their different solubility in aqueous alcohols17,18. Monomeric gluten proteins show viscous behavior, whereas polymeric gluten proteins (glutenins) are elastic19. There are four types of gliadins:, α -, β -, γ -, and ω -. The glutenin subunits are grouped into high molecular weight (HMW-GS) and low molecular weight (LMW-GS)20. The amount of high and low weight subunits determines gluten strength21,22.
Qualitative and quantitative differences in gliadin and glutenin composition are typically used for discrimi-nating wheat cultivars. A variety of techniques have been used to characterize these proteins including gel electro-phoresis23, capillary electrophoresis (CE)24, Reverse Phase HPLC (RP-HPLC)25, two-dimensional electrophoresis (2DE) coupled with nano-liquid chromatography/electrospray ionization ion trap-mass spectrometry/mass spec-trometry (nano-HPLC− ESI-IT-MS/MS)26 and matrix-assisted laser desorption/ionization time-of-flight mass spectrometry (MALDI-TOF-MS) mass spectrometer27. While these methodologies have certainly made a notable contribution to the characterization of varieties, additional methods that examine specific features may also be used.
The analysis of aromatic profiles constitutes a newer approach to characterizing wheat varieties and landraces. Volatile organic compound (VOC) emissions have been used to identify varieties and landraces in cooked grains of wheat28 and to describe the volatile composition of durum wheat semolina and pasta29. Although these prod-ucts aren’t usually renowned for their aromatic properties29, new evidence suggests that the VOC profile of a flour may to some degree predict the aroma of the processed end products30,31. Also, VOCs from the grain can be used to differentiate cereal species32 and VOCs have successfully been used to differentiate among wheat varieties (analysis done on cooked grain)33. Wholemeal flour exhibits concentrations of VOC components that are different from milled white flour34. This implies that wheat flour constitutes an important source of odorants can influence the aroma of finished bread products. It is common that compounds that contribute to aroma be present in trace or ultra-trace amounts, and that the final aroma be comprised of numerous classes of chemical compounds35. VOC analysis in wheat can be done - for example - via gas chromatography-mass spectrometry (GC-MS) coupled with suitable techniques to concentrate volatiles such as dynamic headspace extraction33 or via the headspace solid-phase microextraction29 (HS-SPME). The benefits of using GC-MS based methods rather than other analyt-ical systems have been investigated. One such other system is the “Proton Transfer Reaction-Mass Spectrometer (PTR-MS)”, a soft chemical ionization procedure that allows real time visualization of the flow of VOCs contem-porary to the moment their signal is picked up by the detector present in the instrument. This allows for the elim-ination of the inconvenient delay associated with mass spectrometry/gas chromatography dependent methods, thus allowing for a massive increase in through-put potentiality. This is undoubtedly a powerful new instrument considering that it also has a limit of detection that allows reliable identification of compounds present in concen-trations as low as a few pptv (parts per trillion by volume)36. Further improvements have been made to PTR-MS technology by coupling it with time-of-flight (TOF-MS). PTR-TOF-MS instruments can generate entire mass spectra (snapshots) of complex gas mixtures in short response times with high mass resolution and with virtually no upper mass limit37.
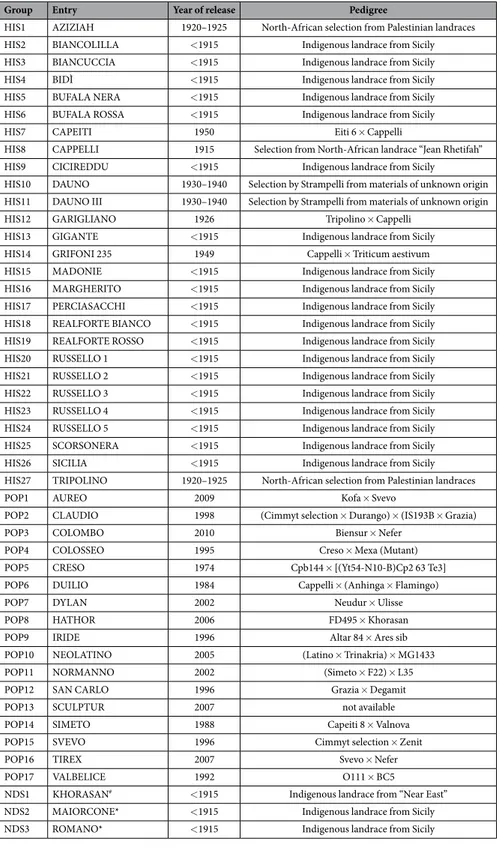
Taking full advantage of the latest improvements in the analytical technology, this study aims to describe the VOC profile of 47 wheat varieties and landraces (44 of durum wheat) by analyzing the kernels and the resulting wholemeal flour and to confirm the presence of specific volatiles profiles through statistical analyses. The effect of the mechanical grinding was then evaluated by comparing kernel data with data from wholemeal flour. Finally, the kernel storage proteins (gliadins, glutenins) were analyzed by SDS-PAGE in order to complete the description of the samples.
Results
VOC analysis by PTR-TOF-MS.
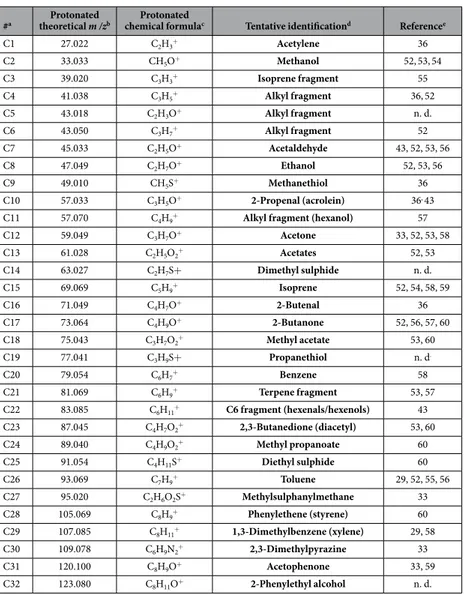
PTR-TOF-MS analysis of the kernel and wholemeal flour of 47 wheat varieties (Table 1) led to the identification of a total of 32 compounds (Table 2). The majority of these (26 out of 32) were observed in the range of 30-100 m/z.The quantitative data are depicted in the form of a circular heat map (Fig. 1). For each compound (wedges), the amount present in the 47 samples (lines) is compared to how much the other compounds are present. The figure can be read as follows: Firstly, the absolute concentration of a specific compound - the “average” for all samples - is depicted by the overall colour of the wedge. A second important aspect described by the figure is how
the concentration of that compound varies within the samples. This is visible by how homogeneous the colour of the wedge is. The analysis of these two aspects combined is referred to as the analysis of “compound trends”. A dendrogram was constructed based these compound trends using the correlation distance and Ward’s method38 and it is positioned in the internal part of the circle.
Group Entry Year of release Pedigree
HIS1 AZIZIAH 1920–1925 North-African selection from Palestinian landraces HIS2 BIANCOLILLA < 1915 Indigenous landrace from Sicily HIS3 BIANCUCCIA < 1915 Indigenous landrace from Sicily HIS4 BIDÌ < 1915 Indigenous landrace from Sicily HIS5 BUFALA NERA < 1915 Indigenous landrace from Sicily HIS6 BUFALA ROSSA < 1915 Indigenous landrace from Sicily HIS7 CAPEITI 1950 Eiti 6 × Cappelli
HIS8 CAPPELLI 1915 Selection from North-African landrace “Jean Rhetifah” HIS9 CICIREDDU < 1915 Indigenous landrace from Sicily
HIS10 DAUNO 1930–1940 Selection by Strampelli from materials of unknown origin HIS11 DAUNO III 1930–1940 Selection by Strampelli from materials of unknown origin HIS12 GARIGLIANO 1926 Tripolino × Cappelli
HIS13 GIGANTE < 1915 Indigenous landrace from Sicily HIS14 GRIFONI 235 1949 Cappelli × Triticum aestivum HIS15 MADONIE < 1915 Indigenous landrace from Sicily HIS16 MARGHERITO < 1915 Indigenous landrace from Sicily HIS17 PERCIASACCHI < 1915 Indigenous landrace from Sicily HIS18 REALFORTE BIANCO < 1915 Indigenous landrace from Sicily HIS19 REALFORTE ROSSO < 1915 Indigenous landrace from Sicily HIS20 RUSSELLO 1 < 1915 Indigenous landrace from Sicily HIS21 RUSSELLO 2 < 1915 Indigenous landrace from Sicily HIS22 RUSSELLO 3 < 1915 Indigenous landrace from Sicily HIS23 RUSSELLO 4 < 1915 Indigenous landrace from Sicily HIS24 RUSSELLO 5 < 1915 Indigenous landrace from Sicily HIS25 SCORSONERA < 1915 Indigenous landrace from Sicily HIS26 SICILIA < 1915 Indigenous landrace from Sicily HIS27 TRIPOLINO 1920–1925 North-African selection from Palestinian landraces
POP1 AUREO 2009 Kofa × Svevo
POP2 CLAUDIO 1998 (Cimmyt selection × Durango) × (IS193B × Grazia) POP3 COLOMBO 2010 Biensur × Nefer
POP4 COLOSSEO 1995 Creso × Mexa (Mutant) POP5 CRESO 1974 Cpb144 × [(Yt54-N10-B)Cp2 63 Te3] POP6 DUILIO 1984 Cappelli × (Anhinga × Flamingo)
POP7 DYLAN 2002 Neudur × Ulisse
POP8 HATHOR 2006 FD495 × Khorasan POP9 IRIDE 1996 Altar 84 × Ares sib POP10 NEOLATINO 2005 (Latino × Trinakria) × MG1433 POP11 NORMANNO 2002 (Simeto × F22) × L35 POP12 SAN CARLO 1996 Grazia × Degamit POP13 SCULPTUR 2007 not available POP14 SIMETO 1988 Capeiti 8 × Valnova POP15 SVEVO 1996 Cimmyt selection × Zenit
POP16 TIREX 2007 Svevo × Nefer
POP17 VALBELICE 1992 O111 × BC5
NDS1 KHORASAN# < 1915 Indigenous landrace from “Near East”
NDS2 MAIORCONE* < 1915 Indigenous landrace from Sicily NDS3 ROMANO* < 1915 Indigenous landrace from Sicily
Table 1. List of wheat varieties and landraces selected for VOC and protein analyses. Varieties have been
classified in three groups (HIS, POP, NDS). All entries are Triticum durum Desf., except: #Triticum turanicum Jakubz, *Triticum aestivum L. THe majority of pedigree information was provided from Genetic Resources Information System for Wheat and Triticale (GRIS) (last update: 2016-03-24).
VOC analysis of kernels.
It is clear that the overall amount of VOC varies greatly from compound to com-pound (Fig. 1, lower half). Also, a single comcom-pound may be present in large amounts in some species but very small amounts in others. This is the case for example for dimethyl sulphide (C14, C2H6S) and diethyl sulphide (C25, C4H10S), which contain within their respective wedges both bright red and blue lines - colours which are on the opposite end of the scale. Nonetheless, in most cases, there is at least some degree of homogeneity, meaning that if a single compound is present in relatively low amounts in one sample, it is usually is present in the others on the lower end of the scale as well.We can observe how the dendogram splits the samples into two major branches (Fig. 1, lower half). One branch goes to the compounds which are present in the largest quantities and are prevalently those with low molecular weight. The top two compounds in terms of quantity are methanol (C2, CH4O) and acetaldehyde (C7, C2H4O). For the most part, the high molecular weight molecules are present in lower quantities and usually are found under the other main branch of the heat map dendrogram. Within this second branch, three com-pounds stand out, as their overall quantity is greater than the other comcom-pounds present in that branch and tend-ing towards concentrations more typical of the first branch: 2-propenal (C10, C3H4O), 2-butanone (C17, C4H8O) and benzene (C20, C6H6).
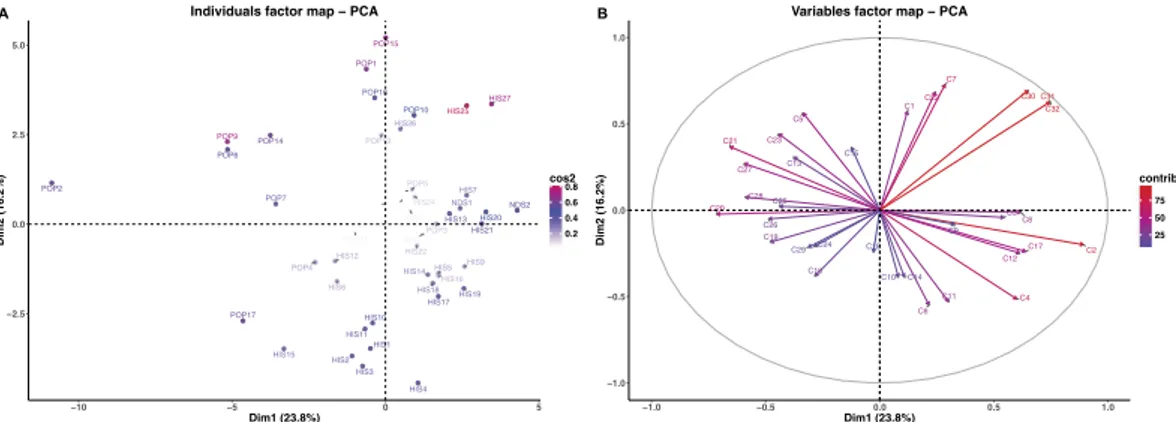
The PCA (Fig. 2A) performed on kernel data showed that the first two dimensions (PC1 and PC2) account for 40.0% of the total variance (total inertia). The first axis (PC1) explains 23.8% of the total variance and the second axis (PC2) 16.2%. From the spatial distribution of samples we observe that Claudio (POP2) distinguishes itself the most. Other modern varieties like Duilio (POP6), Dylan (POP7), Iride (POP 9) and Simeto (POP14) form a group separate from other accessions, all (including POP2) in the upper left quadrant of the PCA.
The correlation circle (Fig. 2B) of the samples was constructed based on specific compounds that associated with the first axis of the PCA (Table 3). The compounds that positively correlate with the first axis of the PCA
#a theoretical m /zProtonated b chemical formulaProtonated c Tentative identificationd Referencee
C1 27.022 C2H3+ Acetylene 36 C2 33.033 CH5O+ Methanol 52,53,54 C3 39.020 C3H3+ Isoprene fragment 55 C4 41.038 C3H5+ Alkyl fragment 36,52 C5 43.018 C2H3O+ Alkyl fragment n. d. C6 43.050 C3H7+ Alkyl fragment 52 C7 45.033 C2H5O+ Acetaldehyde 43, 52, 53, 56 C8 47.049 C2H7O+ Ethanol 52, 53, 56 C9 49.010 CH5S+ Methanethiol 36 C10 57.033 C3H5O+ 2-Propenal (acrolein) 36, 43
C11 57.070 C4H9+ Alkyl fragment (hexanol) 57
C12 59.049 C3H7O+ Acetone 33, 52, 53, 58 C13 61.028 C2H5O2+ Acetates 52, 53 C14 63.027 C2H7S+ Dimethyl sulphide n. d. C15 69.069 C5H9+ Isoprene 52, 54, 58, 59 C16 71.049 C4H7O+ 2-Butenal 36 C17 73.064 C4H9O+ 2-Butanone 52, 56, 57, 60 C18 75.043 C3H7O2+ Methyl acetate 53, 60 C19 77.041 C3H9S+ Propanethiol n. d. C20 79.054 C6H7+ Benzene 58 C21 81.069 C6H9+ Terpene fragment 53, 57 C22 83.085 C6H11+ C6 fragment (hexenals/hexenols) 43 C23 87.045 C4H7O2+ 2,3-Butanedione (diacetyl) 53, 60 C24 89.040 C4H9O2+ Methyl propanoate 60 C25 91.054 C4H11S+ Diethyl sulphide 60 C26 93.069 C7H9+ Toluene 29, 52, 55, 56 C27 95.020 C2H6O2S+ Methylsulphanylmethane 33 C28 105.069 C8H9+ Phenylethene (styrene) 60 C29 107.085 C8H11+ 1,3-Dimethylbenzene (xylene) 29, 58 C30 109.078 C6H9N2+ 2,3-Dimethylpyrazine 33 C31 120.100 C8H9O+ Acetophenone 33, 59 C32 123.080 C8H11O+ 2-Phenylethyl alcohol n. d.
Table 2. Compounds tentatively identified through PTR-Analysis. aUnique code assigned to each compound. bTheoretical mass to charge ratio (m/z) found in literature or in PTR-TOF-MS manual. cCompound’s protonated chemical formula. dTentative identification based on spectral properties.
(PC1) are mainly methanol (C2, CH4O), 2-phenylethyl alcohol (C32, C8H10O), acetophenone (C31, C8H8O) and 2,3-dimethylpyrazine (C30, C6H8N2) whereas benzene (C20, C6H6), the terpene fragment (C21, C6H8), methylsulphanylmethane (C27, C2H5O2S) and phenylethene (C28, C8H8) correlate negatively.
C11 C22 C30 C31 C32 C26 C1 6 C2 4 C2 7 C9 C1 5 C10 C1 7 C1 4 C2 1 C23 92 C C19 C2 8 C20 C18 C25 C6 C3 C8 C2 C7 C4 C13 C1 C5 C12 C27 C21 C23 C22 C24 C16 C30 C3 1 C3 2 C9 C1 8 C26 C2 9 C1 9 C2 8 C8 01C C17 C14 C11 C15 C20 C25 C13 C3 C6 C2 C7 C4 C12 C1 C5 0 0.7 1.4 2.1 2.8
Figure 1. (Lower panel) Circular heat map representation of unsupervised hierarchical clustering of the data coming from analysis of 47 kernel samples (rows) grouped by compound type (columns); (Upper panel) Circular heat map representation of unsupervised hierarchical clustering of the data coming from analysis of 47 wholemeal flour samples (rows) grouped by compound type (columns). Shades of red and blue represent
increase and decrease of a compound relative to the median compound levels (see color scale).
Figure 2. (A) Principal component analysis (PCA) results of PTR-TOF-MS data obtained from 47
durum wheat kernel samples. Dim1 = first dimension (PC1), Dim2 = second dimension (PC2); (B) Vector representation of the contribution of each compound to the distinction of kernel samples. The length of the vectors is directly correlated to their significance within each population. Between vectors and between a vector and an axis, there is positive correlation if the angle is less than 90 degrees whereas the correlation is negative if the angle reaches 180 degrees. There is no linear dependence if the angle is 90 degrees.
The following compounds positively correlate with the second dimension of the PCA: acetaldehyde (C7, C2H4O), and C6 fragment (C22, C6H10). Two alkyl fragment compounds (C6, C3H6; C11, C4H8) negatively correlate with PC2. In this dataset, most of the landraces grouped according to PC2 in the third and fourth quad-rants: Aziziah (HIS1), Biancolilla (HIS2), Biancuccia (HIS3), Bidì (HIS4), Dauno (HIS10) and Dauno III (HIS11). The contribution of individual compounds to sample differentiation was displayed as a correlation circle (Fig. 2B) where normalized vectors graphically represent the quantitative variables. The length and the direction of the vectors directly correlate with their significance within each population. A positive correlation between compounds is greater when the angle between their directions is smaller (close to 0 degree), whereas the corre-lation is negative if the angle reaches 180 degrees. No linear dependence exists if the angle is exactly 90 degrees. In the kernel matrix, a clear positive correlation was identified among 2,3-dimethylpyrazine (C30, C6H8N2), acetophenone (C31, C8H8O) and 2-phenylethyl alcohol (C32, C8H10O).
VOC analysis on wholemeal flour.
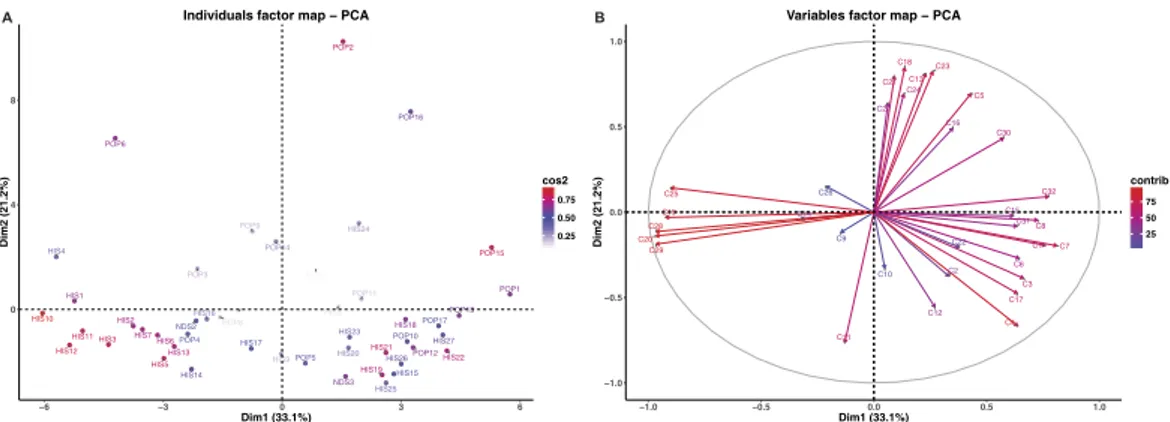
The volatiles from wholemeal flour are depicted as a circular heat map (Fig. 1, upper half). Some of the compounds such as benzene (C20, C6H6) and diethyl sulphide (C25, C4H10S) seem to go hand in hand with each other in that they occur in very similar concentrations, just they did in the kernel matrix described above, and they increase by the same amount following grinding of the kernel into wholemeal flour. The heat map also displays some quantitative compound trends that do not correspond to those previously reported for kernel data. For example as phenylethene (C28, C8H8) and 1,3-dimethylbenzene (C29, C8H10). These two aforementioned compounds clustered in the first branch of the dendrogram, whereas the sec-ond branch contains only low molecular weight compounds like methanol (C2, CH4O) and acetaldehyde (C7, C2H4O).From the PCA analysis done on wholemeal flour data (Fig. 3A) we can see that the total variance along the two axes (PC1 and PC2) accounted for 54%, a considerable increase from the 40% it was in the PCA done on kernel data. PC1 accounted for 33.1% of the total variance whereas PC2 accounted for 21.2%. In this multi-dimensional space, modern varieties like Claudio (POP2), Duilio (POP6) and Iride (POP9) Tirex (POP16) separated. As to the distribution of the local landraces, Aziziah (HIS1) and Bidì (HIS4) are the only ones found in the upper left hand quadrant. Indeed, all other HIS varieties (with the exception of HIS24 in the upper right quadrant) are located in the lower part of the PCA.
In the correlation circle (Fig. 3B, Table 3), we notice that acetaldehyde (C7, C2H4O), 2-phenylethyl alcohol (C32, C8H10O), and acetylene (C1, C2H2) positively correlate with PC1, while diethyl sulphide (C25, C4H10S), 1,3-dimethylbenzene (C29, C8H10), phenylethene (C28, C8H8), propanethiol (C19, C3H8S) and benzene (C20,
Kernel Wholemeal flour
First dimension (PC1) Second dimension (PC2) First dimension (PC1) Second dimension (PC2)
Codea rb Codea rb Codea rb Codea rb
C2 0,893 C7 0,728 C7 0,811 C18 0,846 C32 0,746 C30 0,694 C32 0,775 C23 0,824 C31 0,746 C22 0,685 C1 0,760 C13 0,813 C30 0,650 C31 0,628 C8 0,726 C21 0,797 C17 0,640 C32 0,627 C3 0,663 C5 0,694 C8 0,619 C1 0,573 C6 0,644 C24 0,692 C12 0,613 C5 0,563 C4 0,638 C27 0,640 C4 0,601 C23 0,442 C17 0,636 C16 0,492 C3 0,544 C21 0,368 C31 0,634 C30 0,434 C9 0,328 C15 0,365 C15 0,618 C10 −0,328 C11 0,302 C13 0,308 C30 0,575 C2 −0,375 C24 −0,288 C16 −0,380 C5 0,430 C3 −0,387 C29 −0,313 C14 −0,386 C22 0,378 C17 −0,476 C5 −0,336 C10 −0,386 C16 0,350 C12 −0,557 C13 −0,376 C4 −0,515 C2 0,333 C4 −0,667 C25 −0,439 C11 −0,529 C14 −0,324 C11 −0,765 C23 −0,442 C6 −0,549 C25 −0,900 C19 −0,479 C19 −0,923 C26 −0,487 C28 −0,966 C28 −0,590 C29 −0,966 C27 −0,594 C20 −0,967 C21 −0,657 C20 −0,715
Table 3. Compounds significantly correlated to first and second dimensions of the principal component analysis (PCA) for kernel and wholemeal flour data. The selection of significant compounds was done based
on their correlation coefficients. (α = 0.05) and sorted by Pearson correlation coefficient. aUnique code assigned to each compound. bPearson’s correlation coefficient.
C6H6) negatively correlate. Compounds that positively correlate with PC2 include methyl acetate (C18, C3H6O2) and 2,3-butanedione (C23, C4H6O2) and two compounds related to alkyl fragments (C11, C4H8; C4, C3H4) neg-atively correlate.
In the correlation circle for wholemeal flour (Fig. 3B) 2-phenylethyl alcohol (C32, C8H10O) positively corre-lates with acetophenone (C31, C8H8O) and 2,3-dimethylpyrazine (C30, C6H8N2), although especially for the latter two compounds, this was not as nearly as strong as it was in the kernel results. In wholemeal flour, it was benzene (C20, C6H6), phenylethene (C28, C8H8) and 1,3-dimethylbenzene (C29, C8H10) which proved the most significant based on vector length. These latter three compounds positively correlated with each other, but they negatively correlated with the aforementioned C32 compound.
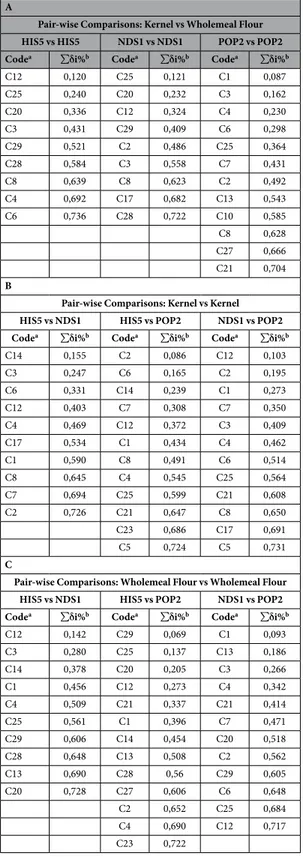
Simper analyses.
The PTR-TOF data was used in a further analysis known as SIMPER (Table 4). The objec-tive of this analysis was to find key compounds that allow for differentiation of one sample from another when confronted in a pair-wise analysis. The results display the contribution of each compound to the average overall dissimilarity of the two confronted samples. A cut-off is imposed when ∑ δ i% reaches 70%.The first analysis (Table 4A) confronted kernel and wholemeal flour data within the same species, and in this table the results from one species from each category (historical “HIS5”, not durum species “NDS1”, and modern “POP2”) are displayed. In this analysis, three compounds were statistically significant in each of the three catego-ries: the isoprene fragment (C3, C3H2), ethanol (C8, C2H6O) and diethyl sulphide (C25, C4H10S).
SIMPER analysis was also used to confront kernel vs kernel and wholemeal flour vs wholemeal flour (Table 4B and 4C respectively) in the following comparisons: HIS5 vs NDS1, HIS5 vs POP2 and NDS1 vs POP2; in other words in the same matrix was used to confront different genotypes.
In the kernel vs kernel analysis, the compounds that were consistently present in all the three comparisons are represented by low molecular weight compounds like acetylene (C1, C2H2), methanol (C2, CH4O), alkyl frag-ments (C4, C3H4; C6, C3H6), acetaldehyde (C7, C2H4O), ethanol (C8, C2H6O), acetone (C12, C3H6O).
A key feature that distinguishes the wholemeal flour vs wholemeal flour analysis from the kernel vs kernel analysis discussed above, is the presence of high molecular weight compounds which, in the case of wholemeal flour vs wholemeal flour, turn out to be relevant (Table 4C). Such compounds are present in each of the three pair-wise comparisons among the compounds that contributed the most to overall dissimilarity. These com-pounds include benzene (C20, C6H6), diethyl sulphide (C25, C4H10S) and 1,3-dimethylbenzene (C29, C8H10), and they accompany the low molecular weight compounds acetylene (C1, C2H2), alkyl fragment (C4, C3H4), acetone (C12, C3H6O) and acetate (C13, C2H4O2). Acetate (C13, C2H4O2) is the only one out of these four low weigh compounds not reported in kernel results, whereas diethyl sulphide (C25, C4H10S) was the only one previously reported in the pair-wise comparison between matrices (Table 4A).
Considering the overall role of compounds in the discrimination of the selected samples (Bidì, HIS4; Khorasan, NDS1; Claudio POP2) we notice how specific compounds are consistently present in each of the three comparisons. SIMPER results that included Bidì (HIS4), showed that two compounds, the alkyl fragments (C4, C3H4) and acetone (C12, C3H6O), are statistically significant. For Khorasan (NDS1) the results highlighted the presence of acetone (C12, C3H6O) whereas Claudio (POP2) results shown the presence of a large amount of com-pounds. These are represented by small compounds like acetylene (C1, C2H2), methanol (C2, CH4O) and others char-acterized by a higher molecular weight like the terpene fragment (C21, C6H8) and diethyl sulphide (C25, C4H10S).
Tanglegram.
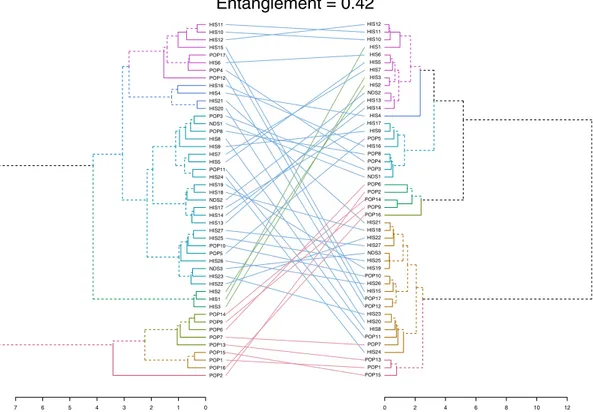
A tanglegram was constructed using quantitative VOC data from the kernel and wholemeal flour, to study the relationships among accessions (Fig. 4). The tanglegram is presented as two rooted phyloge-netic trees that are linked according to quantitative trends within each sample. The entanglement value (0.42) indicates that phylogenetic trees are partially stackable, and from this we conclude that that the mechanical grind-ing strongly affected the VOC profile and thus the relationships among samples. The tree made from kernel dataFigure 3. (A) Principal component analysis (PCA) results of PTR-TOF-MS data obtained from 47 durum
wheat wholemeal flour samples. Dim1 = first dimension (PC1), Dim2 = second dimension (PC2); (B) Vector representation of the contribution of each compound to the distinction of wholemeal flour samples. The length of the vectors is directly correlated to their significance within each population. Between vectors and between a vector and an axis, there is positive correlation if the angle is less than 90 degrees whereas the correlation is negative if the angle reaches 180 degrees. There is no linear dependence if the angle is 90 degrees.
is on the left and the tree made form wholemeal flour data is on the right. Both trees were created according to the Ward method of agglomeration38.
A
Pair-wise Comparisons: Kernel vs Wholemeal Flour
HIS5 vs HIS5 NDS1 vs NDS1 POP2 vs POP2
Codea ∑δi%b Codea ∑δi%b Codea ∑δi%b
C12 0,120 C25 0,121 C1 0,087 C25 0,240 C20 0,232 C3 0,162 C20 0,336 C12 0,324 C4 0,230 C3 0,431 C29 0,409 C6 0,298 C29 0,521 C2 0,486 C25 0,364 C28 0,584 C3 0,558 C7 0,431 C8 0,639 C8 0,623 C2 0,492 C4 0,692 C17 0,682 C13 0,543 C6 0,736 C28 0,722 C10 0,585 C8 0,628 C27 0,666 C21 0,704 B
Pair-wise Comparisons: Kernel vs Kernel
HIS5 vs NDS1 HIS5 vs POP2 NDS1 vs POP2
Codea ∑ δ i%b Codea ∑ δ i%b Codea ∑ δ i%b
C14 0,155 C2 0,086 C12 0,103 C3 0,247 C6 0,165 C2 0,195 C6 0,331 C14 0,239 C1 0,273 C12 0,403 C7 0,308 C7 0,350 C4 0,469 C12 0,372 C3 0,409 C17 0,534 C1 0,434 C4 0,462 C1 0,590 C8 0,491 C6 0,514 C8 0,645 C4 0,545 C25 0,564 C7 0,694 C25 0,599 C21 0,608 C2 0,726 C21 0,647 C8 0,650 C23 0,686 C17 0,691 C5 0,724 C5 0,731 C
Pair-wise Comparisons: Wholemeal Flour vs Wholemeal Flour
HIS5 vs NDS1 HIS5 vs POP2 NDS1 vs POP2
Codea ∑ δ i%b Codea ∑ δ i%b Codea ∑ δ i%b
C12 0,142 C29 0,069 C1 0,093 C3 0,280 C25 0,137 C13 0,186 C14 0,378 C20 0,205 C3 0,266 C1 0,456 C12 0,273 C4 0,342 C4 0,509 C21 0,337 C21 0,414 C25 0,561 C1 0,396 C7 0,471 C29 0,606 C14 0,454 C20 0,518 C28 0,648 C13 0,508 C2 0,562 C13 0,690 C28 0,56 C29 0,605 C20 0,728 C27 0,606 C6 0,648 C2 0,652 C25 0,684 C4 0,690 C12 0,717 C23 0,722
Table 4. SIMPER results of pair-wise comparisons on selected samples. (A) Representation of the
pair-wise comparison wholemeal flour vs kernel (B) Representation of the pair-wise comparison kernel vs kernel (C) Representation of the pair-wise comparison wholemeal flour vs wholemeal flour. HIS5 = Bidì, NDS1 = Khorasan, POP2 = Claudio. aCompound code as reported in Table 2. bCumulative contribution percentage.
Samples in the kernel tree (Fig. 4, left) grouped into two main branches. At a more detailed level though, the accessions grouped into seven clusters, each denoted by a different color. Starting from the top, the first of these such clusters (violet) is made up of samples belonging to both the HIS group and the POP group, with five and three accessions respectively. Moving down the tree, the next cluster, dark blue, is made up of exclusively of HIS samples: Bidì (HIS4), Margherito (HIS16) and two Russello samples. The medium blue cluster was the most populated group (23 accessions), with a prevalence of HIS landraces (15), all the NDSs (Khorasan, Maiorcone, Romano) and 5 modern varieties (Colombo (POP3), Creso (POP5), Hathor (POP8), Neolatino (POP10) and Normanno (POP11)). The dark green cluster grouped only HIS samples like Aziziah (HIS1), Biancolilla (HIS2) and Biancuccia (HIS3). The last three clusters (green, brown, and red) included only modern varieties, with Claudio (POP2) clustering separately from the rest of the samples.
Regarding the wholemeal flour phylogenetic tree (Fig. 4, right), we observe that the violet cluster is made up of HIS samples, including three samples that had clustered separately in kernel tree: Aziziah (HIS1), Biancolilla (HIS2), and Biancuccia (HIS3), as shown by the green connection lines. In this trend, only Maiorcone (NDS2), stands apart. It is a Triticum aestivum L. landrace. Moving down the tree, Bidì (HIS4), in dark blue clusters alone. The next cluster, medium blue, is made up of heterogeneous samples belonging to each of the three groups. The dark green cluster includes only POP samples, as previously observed in the kernel tree. The light green cluster was another single sample cluster, made up only of Tirex (POP16).
In the wholemeal flour tree, the brown cluster is the largest group (18 entries). In it, the majority of samples belong to the HIS group. The last cluster, red, grouped only three modern varieties: Aureo (POP1), Sculptur (POP13) and Svevo (POP15). These three samples didn’t form a separate cluster in the kernel tree, as shown by the tanglegram connections.
SDS-PAGE results.
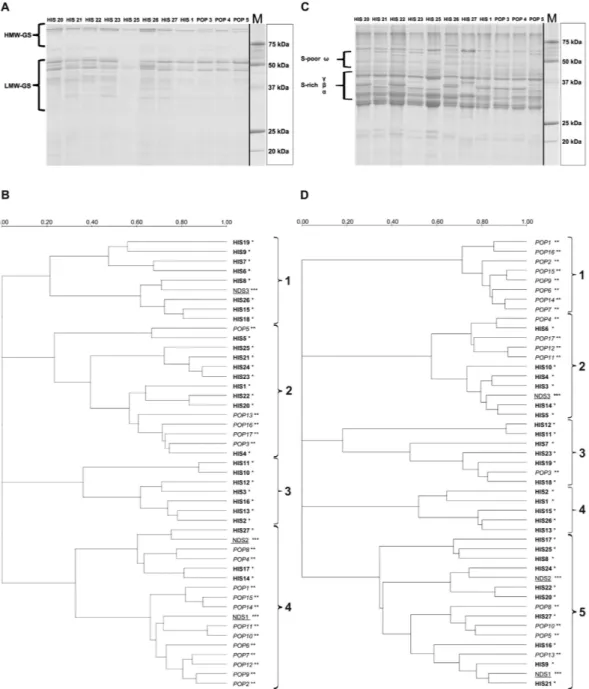
In all 47 wheat varieties and landraces, gliadin and glutenin were analyzed separately. The aim was to verify the presence of specific protein profiles. The wholemeal flour matrix was used for all protein analyses.Glutenins.
SDS-PAGE on glutenin fractions (Fig. 5A) allowed for the identification of specific profiles related to either HMW (high molecular weight) or LMW (low molecular weight) fractions. To graphically display the relationship among the samples, gel images were used to generate phylogenetic trees based on similarity compar-ison (Fig. 5B).The glutenins grouped in 4 main clusters (Fig. 5B). With the exception of Romano (NDS3), the first cluster from the top includes only HIS samples: Bufala rossa (HIS6), Capeiti (HIS7), Cappelli (HIS8), Cicireddu (HIS9), Madonie (HIS15), Realforte bianco (HIS18), Realforte rosso (HIS19) and Sicilia (HIS26).
Figure 4. Tanglegram showing phylogenetic trees for the kernel (left tree) and wholemeal flour (right tree) from wheat samples. The linking lines connect the kernel and wholemeal flour data of the same sample.
Entanglement is measured by giving the left tree’s labels the values of 1 till tree size, and then match these numbers with the right tree. Therefore, entanglement value is a measure between 1 (full entanglement) and 0 (no entanglement). A lower entanglement coefficient corresponds to a better alignment.
The second cluster showed the highest degree of diversity since it includes samples belonging to HIS - includ-ing all the Russello accessions (HIS20, HIS21, HIS22, HIS23 and HIS24) and POP (Colombo, POP3; Creso, POP5; Tirex, POP13; Sculptur, POP16; Valbelice, POP17). Within cluster 2, Aziziah (HIS1) clusters separately from other samples.
The third cluster contains only samples belonging to ancient landraces like Biancolilla (HIS2), Biancuccia (HIS3), Garigliano (HIS12), Gigante (HIS13), Margherito (HIS16). Within cluster 3, Dauno (HIS10) and Dauno III (HIS11), showed the highest degree of similarity to each other (> 0.70 of DICE coefficient), with respect to their glutenin profiles. The last cluster (4) was the largest (17 samples) and could be divided in two sub-groups.
Figure 5. (A) SDS–PAGE analysis of reduced glutenin fractions from 12 samples. Glutenin classes were
displayed on the left. Precision Plus Protein
™
Unstained (Bio-Rad Laboratories, Inc, Hercules CA) was used as molecular marker. HMW: high molecular weight; LMW: low molecular weight; (B) Phylogenetic tree resulting from the analysis of glutenin fractions obtained by SDS-PAGE analysis. Images were processed with Quantity One software (Bio-Rad Laboratories, Inc, Hercules CA) using Ward’s method38 for clustering. For sample references see Table 1. The scale represents the percentage of similarity by the Dice coefficient; (C) SDS–PAGE analysis of reduced gliadin fractions from 12 samples. Gliadin classes were displayed on the left. Precision Plus Protein™
Unstained (Bio-Rad Laboratories, Inc, Hercules CA) was used as molecular marker; (D) Phylogenetic tree resulting from the analysis of gliadin fractions obtained by SDS-PAGE analysis. Image data were processed with Quantity One software (Bio-Rad Laboratories, Inc, Hercules CA) using Ward’s method38 for clustering. For sample references see Table 1. The scale represents the percentage of similarity by the Dice coefficient.The first comprising 6 samples contained a mixed composition with three HIS accessions, (Grifoni 235, HIS14; Perciasacchi, HIS17; Tripolino, HIS27), two POP accessions (Colosseo, POP4; Hathor, POP8) and one NDS (NDS 2, Maiorcone). The second sub-group comprised mainly modern cultivars: (Aureo, POP1; Claudio, POP2; Duilio, POP6; Dylan, POP7; Iride, POP9; Neolatino, POP10; Normanno, POP11; Simeto, POP14; Svevo, POP15) and also one NDS1 (Khorasan), variety that very noticeably stands out as it is not even a durum wheat, but fits to a different Triticum turgidum subspecies (Triticum turanicum Jakubz).
Gliadins.
SDS-PAGE gliadin profiles were also used to further describe the samples in this work. The glia-din profiles may be sub-divided into sulphur-rich (S-rich) α -, β -, γ - sub-fractions and a sulphur-poor (S-poor) ω -gliadin sub-fraction as shown in Fig. 5C. The gel images were analyzed in the same way as for glutenin profil-ing and again a phylogenetic tree was constructed which displayed the presence of 5 clusters (Fig. 5D). The first cluster comprised only POP samples (Aureo, POP1; Claudio, POP2; Duilio, POP6; Dylan, POP7; Iride, POP9; Simeto, POP14; Svevo, POP15; Tirex, POP16), which presented a high degree of similarity among each other (> 0.70 of DICE coefficient).The second cluster included a mix of both HIS and POP entries (7 and 4 entries respectively). These samples could be further divided into two subgroups, the first made up of POP accessions with the exception of Cappelli (HIS8), and the second containing exclusively HIS samples, among which Biancuccia (HIS3) and Bidì (HIS4).
Third and fourth clusters showed the presence of many HIS samples, with Bufala rossa (HIS6) displaying the most differentiated gliadin profile, as per its DICE coefficient. Colombo (POP3) was the only modern variety present in cluster 3 and 4.
The last cluster (5) on the other hand, seems to be the only one comprising samples belonging to all groups, including most of the Russello samples (HIS20, HIS21, HIS22, HIS24), two of the NDS samples (Korasan, Maiorcone) and some highly differentiated samples like Margherito (HIS16), Perciasacchi (HIS17), Tripolino (HIS27) that present the least similarity to other members of the cluster.
Discussion
Beleggia and coworkers29 in 2009 were the first to study the aroma of durum wheat wholemeal flour. They were followed in 2015 by Starr’s group who studied the variations in volatile compound profiles of bread wheat (Triticum aestivum L.) varieties and landraces33. To carry on from these initial works, we present for the first time the combined analyses of storage proteins (gliadin, glutenin) and volatile organic compounds by SDS-PAGE and PTR-TOF analysis respectively, of Triticum wheat kernels and wholemeal flour, obtained from 47 landraces and varieties.
The use of the PTR-MS spectra as fingerprints allowed for the identification of 32 compounds that consistently appeared in both the kernel and the wholemeal flour, which were then used to describe the selected wheat sam-ples. Some of those compounds showed quantitative trends common to the kernel and wholemeal flour.
Our results confirm that a sample may be characterized on the basis of its quantitative VOC profile, and this fact is compatible with the hypothesis that the content of volatile compounds might be under genetic control, which was put forward in a previous report on Triticum aestivum L.33. The results of our experiments show that this could be valid for both modern varieties and local landraces.
As for the modern varieties, Claudio (POP2), Duilio (POP6) and Svevo (POP15) are good examples. They displayed a distinctive VOC profile independent of which matrix was considered. In wholemeal flour, two of the most distinguishing compounds are 2,3-butanedione (C23, C4H6O2) - an important odor-active molecule in fresh rye flour39 - and methylsulphanylmethane (C27, C
2H5O2), which had previously been found to be present in large quantities in the modern varieties of spring wheat33.
Quantitative differences were found in some local landraces which distinguish them from modern varieties. Bidì (HIS4) was used to represent the landraces and it showed a specific VOC profile for both wholemeal flour and kernel: e.g. the presence of high level of dimethyl sulphide (C14, C2H6S). This compound naturally occurs in many living systems such plants, algae, bacteria40 and fungi (truffles)36 and its quantitative level is not affected by grinding conditions. In the spring wheat species Maiorcone (NDS2, Triticum aestivum L.), some features that distinguish it were detected only for kernel data (Fig. 2A) and no differences were detected for the other members of the NDS group (Khorasan, NDS1, Triticum turanicum Jakubz; Romano, NDS3, Triticum aestivum L). As to quantitative differences between the matrices, 2-propenal (C10, C3H4O) and 2-butanone (C17, C4H8O) displayed higher levels in kernel than in wholemeal flour (Fig. 1) contrary to results in previously published29 work in which aldehydes and ketones were reported to increase during kernel grinding as alcohol and ester compounds decrease.
In general, the grinding phase required to obtain wholemeal flour resulted in VOC profiles that showed quantitative differences when compared to kernel profiles. This is true for two classes in particular: aromatic hydrocarbons and sulphur-containing compounds. The first class includes the aromatic hydrocarbons benzene (C20, C6H6), phenylethene (C28, C8H8) and 1,3-dimethylbenzene (C29, C8H10) whereas the second one includes compounds such as diethyl sulphide (C25, C4H10S). It might be that the disruption of the kernel structure which occurs during grinding results in the release of some compounds.
SIMPER results (Table 4) showed that the contribution of a compound to sample discrimination could change with the matrix (kernel vs wholemeal flour). The pair-wise comparisons A and C, which include wholemeal flour data, shows how compounds with relatively high molecular weights contribute to sample discrimination, whereas for comparisons among kernels only, compounds with low m/z are dominant.
The tanglegram (Fig. 4) tells how closely or distantly the varieties are related to each other both when the kernel is used and when the wholemeal flour is used, and also how these relations change when moving from one matrix to the other. By looking at how samples distribute in the phylogenetic trees it is possible to see how similar or different their VOC profiles are, whether or not the modern varieties cluster separately from the local
landraces, and what subgroups form. The entanglement value (0.42) confirmed that the grinding phase modifies the existing relationships compared to what they were in the unprocessed kernels. This evidence further supports the idea that a major release of certain VOC can be imputed to the grinding process.
To complement the VOC profiles, the storage proteins glutenin and gliadin were separated by electrophoresis for further analysis. Cluster analysis of the glutenin fraction (Fig. 5B) shows how the samples grouped into four main branches. Distinctive profiles could be observed within modern cultivars as reported by the DICE coeffi-cient. Some examples are Creso (POP5) and Sculptur (POP13). The same is true for some of the local landraces such as Aziziah (HIS1), Cicireddu (HIS9) and Realforte rosso (HIS19).
The cluster analysis of the gliadin fraction (Fig. 5D) divided the samples into five branches. On the whole, modern cultivars grouped separately from local landraces. A notable exception is Sculptur (POP13), which exhib-its a gliadin profile unlike other modern cultivars, similarly to what was observed for this cultivar’s glutenin data. Local landraces again exhibited high degrees of dissimilarity, which facilitates their characterization. Two good examples are Bufala rossa (HIS6) and Aziziah (HIS1).
In this work, we have presented the electrophoretic characterization of the storage proteins together with VOC data for 47 durum wheat varieties and landraces. Our data further validates the usefulness of the direct injection mass spectrometry method PTR-TOF as a tool to discriminate among food matrices. One of the more notable advantages of this method is that it allows for the analysis of a large number of samples (high-throughput) and that is clearly demonstrated in this work, as well as in a previous pioneering work41. With the help of this tool, we were able to find the 32 compounds listed in this paper, as well as to quantify them precisely enough to be able to individuate significant differences between the two matrices of what substantially was the same material: the kernel (whole) versus the wholemeal flour (the kernel grinded), and as such determine the often subtle dif-ferences caused by the mechanical processing. In our samples, the grinding induced a release of, for example, aromatic hydrocarbons and sulphur compounds. From the data gathered here, emerges a clear picture of how dif-ferent modern cultivars are from local, historical landraces, as proven by the statistical analysis and as previously reported for Triticum aestivum L.33. The storage protein data consolidates this trend.
In conclusion, this combined approach appears to be a promising method for the full and precise characteri-zation of durum wheat varieties and landraces and it appears as a step forward in the selection of appropriate raw materials to correctly predict and achieve the desired end product flavor, protein characteristics, and texture or technological properties.
Methods
PTR-TOF-MS analysis.
VOC analysis was carried out on 47 accessions of wheat (Table 1) collected from Azienda Pietranera, the experimental station of the University of Palermo, located in central-southern Sicily, Italy, (37°30′ N, 13°31′ E). Five accessions from the Russello population were included in the present study, selected from different environmental niches existing in Sicily.The samples were classified into three groups according to plant height, the spread of varieties and release date (Table 1). Out of the 47 accessions, 17 were modern varieties (hereafter named “POP”), released between 1974 (cv. Creso) and 2010 (cv. Colombo); this group comprises the most spread durum wheat varieties grown today in Southern Italy and in other areas of the Mediterranean basin. Twenty-seven were ancient landraces and vari-eties (hereafter named ancient genotypes, “HIS”), widely grown at the end of the XIX and in the first half of the XX century in Southern Italy and particularly in Sicily. Some of these accessions (such as Perciasacchi, Cappelli, Russello, Bidì) are today object of a renewed interest by both farmers and consumers who ascribe to their distinc-tive sensorial and nutritional properties. The remaining three accessions, Khorasan (Triticum turanicum Jakubz) and the two landraces, Maiorcone and Romano (T. aestivum L.), were selected as outlier samples belonging to different Triticum species (hereafter named not durum species, “NDS”).
Analyses were carried out on whole kernels and also on wholemeal flour from mechanical grinding. Briefly, 15 ± 0.50 grams of kernels were collected from each sample, heated to 60 °C for 15 minutes and then used for the first step of the analysis. Next, samples were immediately ground in a lab mill, to a particle size of < 200 μ m. VOCs were then measured in the resulting wholemeal flour after a further heating step.
Volatiles were analyzed with a PTR-TOF 8000 (Ionicon Analytik GmbH, Innsbruck, Austria) using H3O+ as reagent ion for the proton transfer reaction. The H3O+ ions react with all the biogenic VOCs having a proton affinity higher than that of water (165.2 kcal mol−1). The single ion products of this reaction then separate in the reaction chamber (Drift tube) based on their mass to charge (m/z) ratio under controlled conditions: applied voltage set at 600 V, temperature 110 °C, and pressure 2.25 mbar.
Compounds such as 1,4-dichlorobenzene (m/z = 146.976) and 1,2,3-trichlorobenzene (m/z = 180.937) were continuously used, together with other known low mass ions, for a precise conversion of ‘time-of-flight‘ into ‘mass-to-charge‘ ratio (m/z) in order to calibrate the mass scale and the sum formula of the unknown ions42,43. For the analysis, each sample was placed in a glass jar and covered with a special lid that containing a Teflon connection to a zero-air generator (inlet) and to the PTR-TOF-MS system (outlet). Analyses were carried out 5 times on each sample. The headspace was then measured by direct injection into the PTR-TOF-MS drift tube inlet for 180 seconds, after 120 seconds of exposure. Preliminary measurements on empty jars were run before every experiment and used for background subtraction. All mass spectra up to m/z = 250 were simultaneously detected and recorded with 1 s as the integration time. Internal calibration was based on m/z = 21.0202 (H318O+),
m/z = 59.0491 (C3H6O+) and m/z = 181.937 (C6H4Cl3+). Further information was obtained from literature42,43. Raw spectra acquisition and peak quantification were performed as described in reference36.
External calibration was automatically done by the acquisition program and it achieved a mass accuracy of 0.0001 Th (1 Thomson = 1 Da/e) for the selected mass range36. Peak data were extracted and then quantified as pptv (parts per trillion by volume).
Gliadin and Glutenin protein analysis.
Protein Extraction. Protein analyses were carried out onfrac-tions linked to gluten formation. Gliadin and glutenins were extracted using a protocol from Singh et al.44 with modifications as follows: Proteins were extracted from ground kernel samples. About 100 mg of wholemeal flour were used by adding 0.75 ml of 1-propanol 50% solution). Samples were then heated for 30 min at 65 °C in a thermoshaker (1,400 rpm) and centrifuged at 10,000 rpm for 2 minutes. This procedure was done twice and, the resulting pellet was used as starting material from which to extract glutenins (a) whereas the supernatant was used for gliadins (b) extraction:
(a) Glutenins: 1.5% solution (2% DTT, DL-dithiothreitol) for the reduction of disulfide bridges was added to the pellet and the pellet was then transferred to a thermomixer at 65 °C for 30 min (1,400 rpm). After a centrif-ugation step (2 min at 10,000 rpm) in which the pellet was recuperated, 0.1 ml of 1.4% of alkylating solution (4-vinylpyridine) was added to extract followed by a new centrifugation step at 13,000 rpm for 5 minutes. Subsequently, 180 μ l of supernatant were mixed with 180 μ l of extraction solution A (1:1 ratio) (pH 6.8 (2% SDS (w/v), 40% glycerol (w/v), 0.02% (w/v) bromophenol blue)) and the mixture thus obtained was placed in a thermoshaker at 90 °C for 5 min (1,400 rpm). After that, product was centrifuged and 10 μ l of the superna-tant were used for electrophoretic analysis.
(b) Gliadins: the extraction of gliadin fraction was carried out on the supernatant obtained as described above, heated to 65 °C for 5 hours to eliminate the alcoholic fraction, then mixed with 0.3 ml of extraction solu-tion B (pH 8.0, 2% SDS (w/v), 40% glycerol (w/v), 0.02% (w/v) bromophenol blue)). The extract was subse-quently transferred to a thermomixer for 5 minutes of shaking at 90 °C (1,400 rpm) and then centrifuged at 10,000 rpm for 5 min. 10 μ l of the supernatant were used for electrophoretic analysis.
SDS-PAGE and bioinformatics analysis. Proteins were separated using the well-established technique of
SDS-PAGE. In this case, the gels used measured 20cm by 20 cm, had a thickness of 1 mm and consisted in a stack-ing gel (4.8% T, 1.3% C, pH 6.8) and a runnstack-ing gel (15%, 1.3% C, pH 8.5). Each sample was run 4 times (n = 4). Electrophoresis runs were carried out using the Protean XI cells (Bio-Rad Laboratories, Inc, Hercules CA) with the following parameters: 25 mA for each gel, running time 8 hours, temperature 15 °C. Precision Plus unstained (#161-0363, Bio-Rad Laboratories, Inc, Hercules CA) was used as molecular marker.
After electrophoretic separation, the gels were stained using a 12% solution of TCA (trichloroacetic acid) for 5 minutes, followed by a solution of 0.1% Coomassie R in methanol/acetic acid (ratio 4:1) for 4 hours.
Destaining took place in MilliQ water (Millipore Corp., Bedford, MA) for 12 hours at room temperature. The gel images were acquired using a Bio-Rad densitometer GS-800
™
in greyscale, 300 dpi. The images were then analyzed using the “Quantity One 1-D Analysis™
” software (Bio-Rad Laboratories, Inc, Hercules CA).Statistical analysis.
To identify inter-specific and intra-specific relationships related to VOCs and pro-teomic profiles of Triticum spp. accessions, samples were classified into three groups of data (HIS, POP and NDS). Quantitative data were depicted as a heat map to display the complex data in matrix format. A heat map does two things on a data matrix. First, rows and columns could be rearranged so that the rows (or columns) that present similar profiles be grouped, making them easier to visualize. Second, every item in the data array is displayed as a color, making it possible to graphically display the pattern. A dendrogram based on signal quantities was created using correlation-based distances and the Ward’s method of agglomeration38.Data from PTR-TOF-MS were also analyzed using a PCA (principal component analysis) for both wholemeal flour and kernel samples and their results were graphically processed to highlight the contribution of each varia-ble respectively (identified compounds) in the samples differentiation.
A tanglegram was generated to illustrate the similarities and divergences the associations and putative codi-vergence between the two dendrograms, using the Ward’s method for hierarchical cluster analysis38. The rooted phylogenetic trees (wholemeal flour and kernel) are drawn opposite each other, using auxiliary lines to connect samples and establish a network of interactions.
All computations were performed with R 3.2.3 language and environment45 and additional packages circlize46, dendextend47 and FactoMineR48.
Three accessions (both kernel and wholemeal flour) were chosen based on PCA results as representative of each of three groups (HIS, POP, NDS). To further examine the differences between the genotypes and treatment, the percent-age contribution of each compound to the averpercent-age dissimilarity between the aforementioned factors was calculated with similarity percentage analysis (SIMPER49). Compounds that accounted for 70% of the cumulative percent contri-bution (∑δi%) of the total dissimilarity were identified and then ranked in increasing order of contribution.
Protein data from SDS-PAGE were compared through the similarity matrix that contains the similarity values of all the lanes in a gel image. Lane similarity was computed using the DICE coefficient50. The dice similarity coefficient (DSC) is a spatial overlap index and a reproducibility validation metric51. The value of a DSC ranges from 0, indicating no spatial overlap between two sets of binary segmentation results, to 1, indicating complete overlap. Results were then displayed as phylogenetic tree computed using the Ward’s method38 as cluster method.
References
1. Shewry, P. Wheat. Journal of experimental botany 60, 1537–1553 (2009).
2. O’Brien, L. & DePauw, R. Breeding in Encyclopedia of Grain Science (ed Colin Wrigley) 330–336 (Elsevier, 2004). ISBN 9780127654904, http://dx.doi.org/10.1016/B0-12-765490-9/00183-X.
3. Raffo, A. et al. Influence of durum wheat cultivar on the sensory profile and staling rate of Altamura bread. European Food Research and Technology 218, 49–55 (2003).
4. Sissons, M. Role of durum wheat composition on the quality of pasta and bread. Food 2, 75–90 (2008).
5. Giunta, F., Motzo, R. & Pruneddu, G. Trends since 1900 in the yield potential of Italian-bred durum wheat cultivars. European Journal of Agronomy 27, 12–24 (2007).
6. Fois, S. et al. Environmental conditions affect semolina quality in durum wheat (Triticum turgidum ssp. durum L.) cultivars with different gluten strength and gluten protein composition. Journal of the Science of Food and Agriculture 91, 2664–2673 (2011). 7. Nazco, R. et al. Can Mediterranean durum wheat landraces contribute to improved grain quality attributes in modern cultivars?
Euphytica 185, 1–17 (2012).
8. Motzo, R. & Giunta, F. The effect of breeding on the phenology of Italian durum wheats: from landraces to modern cultivars. European journal of agronomy 26, 462–470 (2007).
9. Nachit, M. Durum breeding for Mediterranean drylands of North Africa and West Asia/eds.Rajaram, S., Saari, E. E., Hettel, G. P. Durum Wheats: Challenges and Opportunities. Wheat Special Report (1992).
10. Ceccarelli, S., Acevedo, E. & Grando, S. Breeding for yield stability in unpredictable environments: single traits, interaction between traits, and architecture of genotypes. Euphytica 56, 169–185 (1991).
11. Ruisi, P., Frangipane, B., Amato, G., Frenda, A. S., Plaia, A., Giambalvo, D. & Saia, S. Nitrogen uptake and nitrogen fertilizer recovery in old and modern wheat genotypes grown in the presence or absence of interspecific competition. Frontiers in Plant Science 6, 185, 1–10 (2015).
12. Pecetti, L., Boggini, G. & Gorham, J. Performance of durum wheat landraces in a Mediterranean environment (eastern Sicily). Euphytica 80, 191–199 (1994).
13. Troccoli, A., Borrelli, G., De Vita, P., Fares, C. & Di Fonzo, N. Mini review: durum wheat quality: a multidisciplinary concept. Journal of Cereal Science 32, 99–113 (2000).
14. Aguiriano, E., Ruiz, M., Fité, R. & Carrillo, J. M. Genetic variation for glutenin and gliadins associated with quality in durum wheat (Triticum turgidum L. ssp. turgidum) landraces from Spain. Spanish Journal of Agricultural Research 6, 599–609 (2008).
15. Babay, E. et al. Influence of allelic prolamin variation and localities on durum wheat quality. Journal of Cereal Science 63, 27–34 (2015).
16. Nazco, R. et al. Variability in glutenin subunit composition of Mediterranean durum wheat germplasm and its relationship with gluten strength. The Journal of agricultural science 152, 379–393 (2014).
17. Kumar, A. et al. A major QTL for gluten strength in durum wheat (Triticum turgidum L. var. durum). Journal of Cereal Science 57, 21–29 (2013).
18. Osborne, T. B. The proteins of the wheat kernel. (Carnegie institution of Washington, 1907).
19. Veraverbeke, W. S. & Delcour, J. A. Wheat protein composition and properties of wheat glutenin in relation to breadmaking functionality. Critical Reviews in Food Science and Nutrition 42, 179–208 (2002).
20. Masci, S. et al. Production and characterization of a transgenic bread wheat line over-expressing a low-molecular-weight glutenin subunit gene. Molecular breeding 12, 209–222 (2003).
21. Nazco, R. et al. Durum wheat (Triticum durum Desf.) Mediterranean landraces as sources of variability for allelic combinations at Glu-1/Glu-3 loci affecting gluten strength and pasta cooking quality. Genetic Resources and Crop Evolution 61, 1219–1236 (2014). 22. Pogna, N., Lafiandra, D., Feillet, P. & Autran, J. Evidence for a direct causal effect of low molecular weight subunits of glutenins on
gluten viscoelasticity in durum wheats. Journal of Cereal Science 7, 211–214 (1988).
23. Yahata, E. et al. Wheat cultivar‐specific proteins in grain revealed by 2‐DE and their application to cultivar identification of flour. Proteomics 5, 3942–3953 (2005).
24. Lookhart, G. & Bean, S. A fast method for wheat cultivar differentiation using capillary zone electrophoresis. Cereal chemistry 72, 42–47 (1995).
25. Larroque, O. et al. In Wheat gluten. Proceedings of the 7th International Workshop Gluten 2000, Bristol, UK, (Royal Society of Chemistry) 136–139 (2–6 April 2000).
26. Pompa, M. et al. Comparative analysis of gluten proteins in three durum wheat cultivars by a proteomic approach. Journal of agricultural and food chemistry 61, 2606–2617 (2013).
27. Caruso, G. et al. Analysis of drought responsive proteins in wheat (Triticum durum) by 2D-PAGE and MALDI-TOF mass spectrometry. Plant Science 177, 570–576 (2009).
28. Starr, G., Bredie, W. L. P. & Hansen, Å. S. Sensory profiles of cooked grains from wheat species and varieties. Journal of Cereal Science
57, 295–303 (2013).
29. Beleggia, R., Platani, C., Spano, G., Monteleone, M. & Cattivelli, L. Metabolic profiling and analysis of volatile composition of durum wheat semolina and pasta. Journal of cereal science 49, 301–309 (2009).
30. Bredie, W. L., Mottram, D. S. & Guy, R. C. Effect of temperature and pH on the generation of flavor volatiles in extrusion cooking of wheat flour. Journal of agricultural and food chemistry 50, 1118–1125 (2002).
31. Parker, J. K., Hassell, G. M., Mottram, D. S. & Guy, R. C. Sensory and instrumental analyses of volatiles generated during the extrusion cooking of oat flours. Journal of agricultural and food chemistry 48, 3497–3506 (2000).
32. Buśko, M. et al. Volatile metabolites in various cereal grains. Food Additives and Contaminants 27, 1574–1581 (2010).
33. Starr, G., Petersen, M. A., Jespersen, B. & Hansen, Å. S. Variation of volatile compounds among wheat varieties and landraces. Food chemistry 174, 527–537 (2015).
34. Czerny, M. & Schieberle, P. Important aroma compounds in freshly ground wholemeal and white wheat flour identification and quantitative changes during sourdough fermentation. Journal of Agricultural and Food Chemistry 50, 6835–6840 (2002).
35. Zhou, M., Robards, K., Glennie-Holmes, M. & Helliwell, S. Analysis of volatile compounds and their contribution to flavor in cereals. Journal of agricultural and food chemistry 47, 3941–3953 (1999).
36. Vita, F. et al. Volatile organic compounds in truffle (Tuber magnatum Pico): comparison of samples from different regions of Italy and from different seasons. Scientific reports 5 (2015).
37. Jordan, A. et al. A high resolution and high sensitivity proton-transfer-reaction time-of-flight mass spectrometer (PTR-TOF-MS). International Journal of Mass Spectrometry 286, 122–128 (2009).
38. Ward Jr, J. H. Hierarchical grouping to optimize an objective function. Journal of the American statistical association 58, 236–244 (1963).
39. Kirchhoff, E. & Schieberle, P. Quantitation of odor-active compounds in rye flour and rye sourdough using stable isotope dilution assays. Journal of agricultural and food chemistry 50, 5378–5385 (2002).
40. Bentley, R. & Chasteen, T. G. Environmental VOSCs–formation and degradation of dimethyl sulfide, methanethiol and related materials. Chemosphere 55, 291–317 (2004).
41. Fabris, A. et al. PTR‐TOF‐MS and data‐mining methods for rapid characterisation of agro‐industrial samples: influence of milk storage conditions on the volatile compounds profile of Trentingrana cheese. Journal of mass spectrometry 45, 1065–1074 (2010). 42. Taiti, C. et al. Class‐modeling approach to PTR‐TOFMS data: a peppers case study. Journal of the Science of Food and Agriculture 95,
1757–1763 (2015).
43. Brilli, F. et al. Detection of plant volatiles after leaf wounding and darkening by proton transfer reaction “time-of-flight” mass spectrometry (PTR-TOF). PLoS One 6, e20419 (2011).
44. Singh, N., Shepherd, K. & Cornish, G. A simplified SDS—PAGE procedure for separating LMW subunits of glutenin. Journal of Cereal Science 14, 203–208 (1991).
45. Team, R. C. R: A language and environment for statistical computing. At http://www.R-project.org/ Date of access: 02/01/2016 (2015).
46. Gu, Z., Gu, L., Eils, R., Schlesner, M. & Brors, B. circlize implements and enhances circular visualization in R. Bioinformatics, btu393 (2014).
47. Galili, T. dendextend: an R package for visualizing, adjusting and comparing trees of hierarchical clustering. Bioinformatics, btv428 (2015).
48. Husson, F., Josse, J., Le, S. & Mazet, J. FactoMineR: multivariate exploratory data analysis and data mining with R. R package version
1, 102–123 (2013).
49. Clarke, K. R. Non-parametric multivariate analyses of changes in community structure. Australian journal of ecology 18, 117–117 (1993).
50. Dice, L. R. Measures of the amount of ecologic association between species. Ecology 26, 297–302 (1945).
51. Zou, K. H. et al. Statistical validation of image segmentation quality based on a spatial overlap index 1: Scientific reports. Academic radiology 11, 178–189 (2004).
52. Infantino, A. et al. Potential application of PTR-TOFMS for the detection of deoxynivalenol (DON) in durum wheat. Food Control
57, 96–104 (2015).
53. Taiti, C. et al. Use of volatile organic compounds and physicochemical parameters for monitoring the post-harvest ripening of imported tropical fruits. European Food Research and Technology 1–12 (2015).
54. del Pulgar, J. S. et al. Rapid characterization of dry cured ham produced following different PDOs by proton transfer reaction time of flight mass spectrometry (PTR-ToF-MS). Talanta 85, 386–393 (2011).
55. Maleknia, S. D., Bell, T. L. & Adams, M. A. PTR-MS analysis of reference and plant-emitted volatile organic compounds. International Journal of Mass Spectrometry 262, 203–210 (2007).
56. Masi, E., Romani, A., Pandolfi, C., Heimler, D. & Mancuso, S. PTR‐TOF‐MS analysis of volatile compounds in olive fruits. Journal of the Science of Food and Agriculture 95, 1428–1434 (2015).
57. Aprea, E. et al. Volatile compound changes during shelf life of dried Boletus edulis: comparison between SPME‐GC‐MS and PTR‐ ToF‐MS analysis. Journal of Mass Spectrometry 50, 56–64 (2015).
58. Müller, M. et al. A compact PTR-ToF-MS instrument for airborne measurements of VOCs at high spatio-temporal resolution. Atmospheric Measurement Techniques Discussions 7, 5533–5558 (2014).
59. Taiti, C. et al. Sometimes a Little Mango Goes a Long Way: a Rapid Approach to Assess How Different Shipping Systems Affect Fruit Commercial Quality. Food Analytical Methods, 1–8 (2015).
60. Yener, S. et al. Tracing coffee origin by direct injection headspace analysis with PTR/SRI-MS. Food research international 69, 235–243 (2015).
Acknowledgements
This work was supported by MIUR (Italian Minister of University & Research) project “Sviluppo tecnologico e innovazione per la sostenibilità e competitività della cerealicoltura meridionale MIUR-UE (PON01_01145/1- ISCOCEM)”.
Author Contributions
F.V., A.P. and S.M. designed the research. F.V., A.P., C.T. and E.L.P. performed the experiments and analyzed the data. A.P. and Z.G. performed statistical analysis. F.V., A.P., M.M., G.D.M., L.G. and L.W. organized and drafted the paper F.V., A.P., D.G., P.R., L.G. and L.W. helped revise the manuscript with all authors contributing to the discussion of the data and to the writing.
Additional Information
Competing financial interests: The authors declare no competing financial interests.
How to cite this article: Vita, F. et al. Aromatic and proteomic analyses corroborate the distinction between
Mediterranean landraces and modern varieties of durum wheat. Sci. Rep. 6, 34619; doi: 10.1038/srep34619 (2016).
This work is licensed under a Creative Commons Attribution 4.0 International License. The images or other third party material in this article are included in the article’s Creative Commons license, unless indicated otherwise in the credit line; if the material is not included under the Creative Commons license, users will need to obtain permission from the license holder to reproduce the material. To view a copy of this license, visit http://creativecommons.org/licenses/by/4.0/