© Author(s) 2017. This work is distributed under the Creative Commons Attribution 3.0 License.
When probabilistic seismic hazard climbs volcanoes: the Mt. Etna
case, Italy – Part 1: Model components for sources parameterization
Raffaele Azzaro1, Graziella Barberi1, Salvatore D’Amico1, Bruno Pace2, Laura Peruzza3, and Tiziana Tuvè11Istituto Nazionale di Geofisica e Vulcanologia (INGV), Sezione di Catania – Osservatorio Etneo, 95123 Catania, Italy 2DiSPUTer, University “G. d’Annunzio” Chieti-Pescara Via dei Vestini, Chieti, Italy
3Istituto Nazionale di Oceanografia e di Geofisica Sperimentale – OGS, 34010 Sgonico (TS), Italy
Correspondence to: Raffaele Azzaro ([email protected]) Received: 31 March 2017 – Discussion started: 5 April 2017
Revised: 20 September 2017 – Accepted: 24 September 2017 – Published: 22 November 2017
Abstract. The volcanic region of Mt. Etna (Sicily, Italy) rep-resents a perfect lab for testing innovative approaches to seis-mic hazard assessment. This is largely due to the long record of historical and recent observations of seismic and tectonic phenomena, the high quality of various geophysical monitor-ing and particularly the rapid geodynamics clearly demon-strate some seismotectonic processes. We present here the model components and the procedures adopted for defining seismic sources to be used in a new generation of probabilis-tic seismic hazard assessment (PSHA), the first results and maps of which are presented in a companion paper, Peruzza et al. (2017). The sources include, with increasing complex-ity, seismic zones, individual faults and gridded point sources that are obtained by integrating geological field data with long and short earthquake datasets (the historical macroseis-mic catalogue, which covers about 3 centuries, and a high-quality instrumental location database for the last decades). The analysis of the frequency–magnitude distribution identi-fies two main fault systems within the volcanic complex fea-turing different seismic rates that are controlled essentially by volcano-tectonic processes. We discuss the variability of the mean occurrence times of major earthquakes along the main Etnean faults by using an historical approach and a purely geologic method. We derive a magnitude–size scal-ing relationship specifically for this volcanic area, which has been implemented into a recently developed software tool – FiSH (Pace et al., 2016) – that we use to calculate the char-acteristic magnitudes and the related mean recurrence times expected for each fault. Results suggest that for the Mt. Etna area, the traditional assumptions of uniform and Poissonian seismicity can be relaxed; a time-dependent fault-based
mod-eling, joined with a 3-D imaging of volcano-tectonic sources depicted by the recent instrumental seismicity, can therefore be implemented in PSHA maps. They can be relevant for the retrofitting of the existing building stock and for driving risk reduction interventions. These analyses do not account for regional M > 6 seismogenic sources which dominate the hazard over long return times ( 500 years).
1 Introduction
Mt. Etna, the largest active volcano in Europe, is commonly known for striking volcanic phenomena, featuring nearly constant summit activity and frequent flank eruptions. Less evident but equally impressive are tectonic phenomena oc-curring along the eastern and southern slopes of the volcano, which are crossed by different systems of active faults (Az-zaro et al., 2012a). The most severe effect of this tectonic activity is the intense seismicity shaking the urbanized areas of the volcano, with obvious implications arising in terms of seismic hazard.
For this reason one of the goals the DPC-INGV V3 project on the “multi-disciplinary analysis of the relationships be-tween tectonic structures and volcanic activity” (Azzaro and De Rosa, 2016a, b) was to assess seismic hazard in the east-ern flank of Etna due to local volcano-tectonic earthquakes. Taking advantage of the huge amount of geological, seis-mological and geodetic data, which derive from field ob-servations and multi-parametric monitoring, we had the op-portunity to test innovative methodological approaches and computation codes developed for the whole of Italy in the
framework of previous projects (Azzaro et al., 2012b; Pe-ruzza, 2013), adapting them to consider the features of the volcano-tectonic seismicity. In practice, this meant analyzing large seismological and geological datasets to parameterize the seismicity rates of seismic sources and hence the earth-quake occurrence probability, thus improving the results of previous researches based solely on the use of macroseismic intensity data (Azzaro et al., 2016, and references therein).
In this study, we present the application of the entire proce-dure to characterize seismic sources at Mt. Etna region pro-viding, for the first time on this volcano, a comprehensive view of the seismotectonic features and an analytical estima-tion of seismic hazard input parameters, with related uncer-tainties. The modeling deals not only with the complexities of the source processes in a volcanic environment but also with the very nature of the forces controlling the seismicity, which may be by definition non-Poissonian: we handle them with an increasing degree of detail, in the framework of a logic tree approach. We integrated historical and instrumen-tal earthquake cainstrumen-talogues to define four seismic zones around the main fault systems recognized in the area, identifying the seismogenic layers where most of the seismic energy is re-leased (effective depth) and estimating seismic rates through the frequency–magnitude distribution (FMD). We also used a distributed seismicity model to describe background earth-quakes in the crustal volume beneath Mt. Etna by adopting a high-resolution three-dimensional grid (inter-nodal distance of 2 km). In addition, we performed the characterization of the sources at the scale of the individual faults by applying a purely geological approach (Pace et al., 2016) that considers the geometric–kinematic parameters representing fault activ-ity (dimensions and slip rate). To this end, we first obtained a magnitude–size scaling relationship (MSR), specifically for this volcanic region, and then calculated the seismic rates ex-pressed in terms of mean recurrence time of the maximum magnitude expected on each fault.
The obtained dataset defines the input parameters used in a full probabilistic seismic hazard assessment (PSHA) at a local scale of Mt. Etna, discussed in a companion paper (Pe-ruzza et al., 2017, hereinafter referred as Part 2). Finally, we remark that the amount of multi-disciplinary data used here for source parameterization, as well as the consistency of re-sults, in our opinion represent a unique condition compared to both other volcanic districts and tectonic areas worldwide. In this sense, we hope that this work may be regarded as a pi-lot study for improving methodological approaches and con-ceptual procedures in fault-based, time-dependent hazard es-timations.
2 Linking faults to earthquakes at Mt. Etna: a short overview
Mt. Etna volcano is an ideal lab for observing at a small-scale a full range of faulting processes that are difficult to find
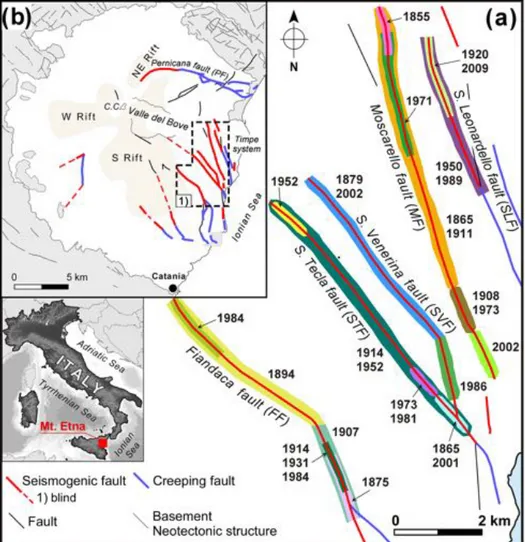
tak-ing place together in other regions. Evidence of active tecton-ics is impressive and widespread, particularly in the eastern flank where morphotectonic features (Azzaro et al., 2012a), recurrent seismicity (examined extensively in Sects. 3 and 4) and ground deformations (Bonforte et al., 2011; Bruno et al., 2012) provide a real measure of the intense volcano-tectonic activity. Furthermore, more than a century of documented history of surface faulting related to coseismic displacements (Azzaro, 1999) and creeping phenomena (Rasà et al., 1996) suggests a clear picture of the relationship between faults and earthquakes; the long list of large and minor events ruptur-ing different segments of the same faults (Fig. 1a) has led to a detailed mapping of active faults and characterization of their behavior in both the long and short term (Azzaro et al., 2013a).
All these features have allowed constraining a seismotec-tonic model (Azzaro, 2004) where faults slip in a strongly heterogeneous mode along strike, with two end-member rup-ture mechanisms addressing fault segments ruled by stick-slip behavior (earthquake-related stick-slip) or by stable-sliding behavior (aseismic creeping) (Fig. 1b). In this framework, the Timpe system and the Pernicana fault (PF) are the most im-portant tectonic elements at Mt. Etna, dissecting the eastern flank between the coast and the volcano-tectonic structures of the NE Rift and Valle del Bove depression (Azzaro et al., 2012a, 2013a, and references therein). They are both very active from a seismotectonic point of view in terms of the number of earthquakes and maximum magnitudes. Whilst the long-term seismic history of the PF is limited to a few decades – the urbanization of the uphill sector crossed by the fault dates back to the late 1970s – the Timpe system is responsible for most of the strongest earthquakes known to have occurred at Mt. Etna since the early 19th century: from a total of 12 largest events – here we consider those having epicentral intensities, I0, larger than VIII on the
Eu-ropean Macroseismic Scale (EMS), i.e., producing at least severe damage according to the EMS (see Grünthal, 1998) – 10 of them are located here, thus making this densely in-habited zone of Mt. Etna the most hazardous of the volcano (Azzaro et al., 2016).
Another debated issue in modeling seismic sources of vol-canic regions for seismic hazard applications is the ques-tion of whether fault behavior is strictly speaking controlled by the volcanic activity. It is true that historical destructive earthquakes in the Timpe area did occur both during flank eruptions and during periods of volcanic quiescence; corre-lation studies of major seismic events and volcanic activity have not produced univocal results (Gasperini et al., 1990; Nercessian et al., 1991; Gresta et al., 1994). The inter-event time (IET) statistical analysis (Sicali et al., 2014) shows that the occurrence of low-magnitude (M < 3) shallow earth-quakes in the central sector of the volcano, beneath the sum-mit craters, depends mainly on the volcanic activity and pro-duces a seismicity clustered in space and time. In fact, seis-mic swarms located here before the 2001, 2002, 2004 and
Figure 1. Fault systems in the study area. (a) Patterns of historical surface faulting along the southeastern flank of Mt. Etna (Timpe tectonic system); colors represent coseismic ruptures related to different earthquakes (modified from Azzaro, 1999).(b) Seismotectonic model of Etna (from Azzaro et al., 2012a). The rift zones, i.e., high frequency of opening of eruptive fissures, are in beige; the sedimentary and metamorphic basement underlying the volcano is in gray.
2008 eruptions are interpreted as a consequence of stress field variations induced by the process of magma rising and dyke emplacement (Bonaccorso et al., 2004; Gambino et al., 2004; Alparone et al., 2012; Sicali et al., 2015). Con-versely, for the flanks of the volcano, especially the east-ern one hosting the seismic sources relevant to seismic haz-ard, the IET distribution shows a prevalence of uncorrelated events, i.e., behavior more similar to a tectonic domain than a volcanic one (see Traversa and Grasso, 2010; Bell and Kil-burn, 2012). The role of a different, wider stress field acting in the Timpe area – a structurally homogeneous domain char-acterized by a general east–west extension (Bousquet and Lanzafame, 2004) – is also proved by the analyses of long time series of geodetic and seismic data (Bruno et al., 2012; Solaro et al., 2010; Bozzano et al., 2013; Palano, 2016, and references therein), highlighting the influence of large-scale instability processes where the strain is released by a steady process on decennial timescale (Bonforte et al., 2011). In this
scenario we therefore assume that modeled faults are con-stantly (on average) loaded in time as expected in a typical tectonic process. We also consider the role of eruptive activ-ity controlling the occurrence of low-magnitude earthquakes in the central-summit area of the volcano to be negligible for seismic hazard purposes, since this is an uninhabited zone and hence the risk is very low.
3 Historical seismicity: some hints for long-term fault behavior
Information provided from macroseismic data is representa-tive of the long-term seismicity since the effects of past major earthquakes affecting the urbanized areas of the volcano are well documented (Azzaro et al., 2000; Azzaro and Castelli, 2015). The historical earthquake dataset used for the analy-sis is the CMTE catalogue (CMTE Working Group, 2017), covering the period 1600–2013 and also including fore- and
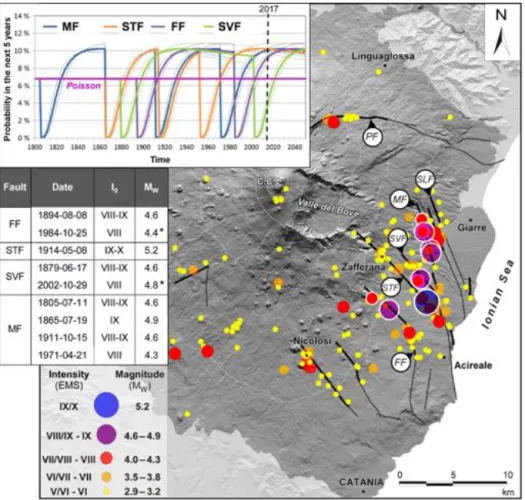
Figure 2. Distribution of the historical seismicity in the Etna region from 1600 to 2015 (data from CMTE Working Group, 2017). Major events considered for the analysis are outlined by a white circle and listed in the enclosed table (asterisk indicates an instrumental value); fault pattern and abbreviations as in Fig. 1; C.C. indicates the central craters. Inset map shows the retrospective test of the time-dependent model based on intertimes and b values of faults: colored curves indicate the variation in time of the conditional probability assigned to the faults of the SZ Timpe in the next 5 years. Before the first event assigned to each fault, the probability is assumed as Poissonian; following the earthquake, the probability curve collapses and progressively increases until the next rupture (from Azzaro et al., 2013b).
aftershocks of low intensity; overall, nearly 1800 events are listed in the catalogue. The magnitude of completeness of this macroseismic catalogue has been estimated as Mc= 3.7;
this corresponds to I0VII on the EMS (i.e., moderate
dam-age), according to the relationship derived by Azzaro et al. (2011).
For our analysis, we selected the historical earthquakes lo-cated along the Timpe fault system (Fig. 2), limiting our at-tention to the strongest events with I0ranging from VIII to
IX–X on the EMS (i.e., from severe damage up to destruc-tion) and with a moment magnitude Mw from 4.6 to 5.2.
It should be noted that moderate values of magnitude for heavily damaging events are a feature of seismicity in ac-tive volcanic areas such as Mt. Etna (Azzaro et al., 2011), whereas in tectonic domains crustal earthquakes produc-ing the same effects are generally associated with M 6 (Rovida et al., 2016). The main reasons for this behavior are (i) the extremely shallow focal depths of Etna earthquakes (0–4 km, see Sect. 4.1.1) compared with those of regional
events (typically in the range 10–15 km) and (ii) an anoma-lously strong low-frequency (0.1 <f <1 Hz) radiation devi-ating from the conventional Brune (1970) spectral scaling, which causes large ground displacements and long (⇡ 20 s) durations of shaking (Milana et al., 2008). The final dataset therefore covers the time span 1805–2015 and consists of nine earthquakes, the causative faults of which are clearly recognized through extensive evidence of coseismic surface faulting (Azzaro, 1999). Earthquakes and associated faults used in the analysis are indicated in Figs. 1 and 2. Thus, the long-term mean recurrence time of historical major events in the Timpe area, reconstructed over a period of 210 years by the fault seismic histories (see Azzaro et al., 2013b), is just 23 years.
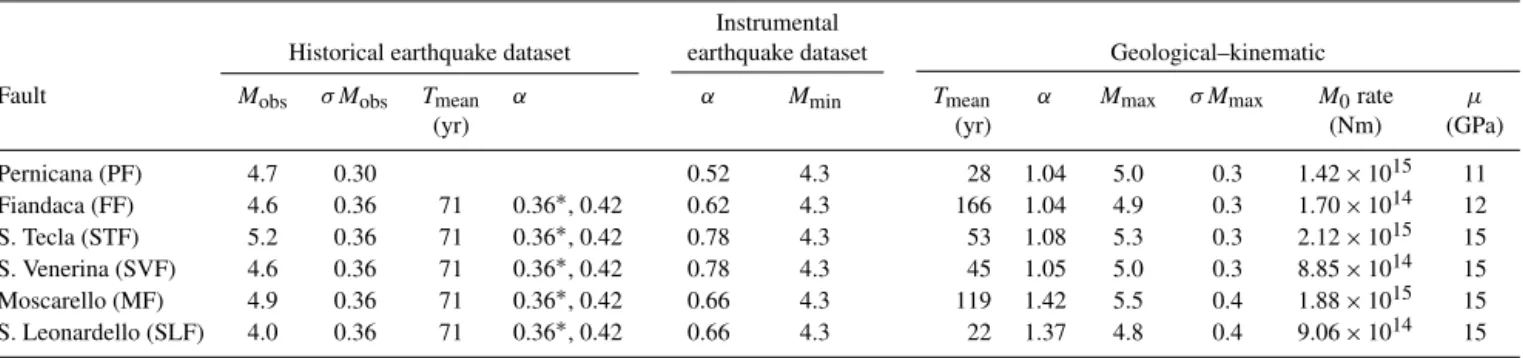
Table 1. Comparison with estimations based on historical and instrumental earthquake datasets; the explanation of the geological–kinematic approach is given in Sect. 5. Abbreviations: Tmeanis the mean recurrence time; ↵ is the aperiodicity factor; Mmaxis the maximum magnitude
obtained by the FiSH code and related standard deviation ( Mmax); M0is the moment rate; µ is the shear modulus; Mminis the minimum
magnitude of the instrumental earthquake dataset. Asterisk indicates the value obtained by the bootstrap analysis.
Instrumental
Historical earthquake dataset earthquake dataset Geological–kinematic
Fault Mobs Mobs Tmean ↵ ↵ Mmin Tmean ↵ Mmax Mmax M0rate µ
(yr) (yr) (Nm) (GPa)
Pernicana (PF) 4.7 0.30 0.52 4.3 28 1.04 5.0 0.3 1.42 ⇥ 1015 11 Fiandaca (FF) 4.6 0.36 71 0.36⇤, 0.42 0.62 4.3 166 1.04 4.9 0.3 1.70 ⇥ 1014 12 S. Tecla (STF) 5.2 0.36 71 0.36⇤, 0.42 0.78 4.3 53 1.08 5.3 0.3 2.12 ⇥ 1015 15 S. Venerina (SVF) 4.6 0.36 71 0.36⇤, 0.42 0.78 4.3 45 1.05 5.0 0.3 8.85 ⇥ 1014 15 Moscarello (MF) 4.9 0.36 71 0.36⇤, 0.42 0.66 4.3 119 1.42 5.5 0.4 1.88 ⇥ 1015 15 S. Leonardello (SLF) 4.0 0.36 71 0.36⇤, 0.42 0.66 4.3 22 1.37 4.8 0.4 9.06 ⇥ 1014 15
Characteristic magnitude and mean recurrence times by historical approach
Supported by the observation that major earthquakes have produced surface faulting ruptures along strike for the entire or most of the length of their causative faults (Azzaro, 1999), we assume that seismogenic Timpe faults behave according to the characteristic earthquake model (sensu Schwartz and Coppersmith, 1984). The earthquake size beyond which the phenomenon becomes evident corresponds to events having I0 VIII on the EMS, equivalent to Mw 4.6. These char-acteristic earthquakes therefore represent the maximum or quasi-maximum historically observed events: in Sect. 5.3 we will deal with the problem of maximum potential earthquake on faults by means of magnitude–size vs. fault dimension re-lationships.
In previous studies we have calculated the mean recur-rence time (Tmean) of a characteristic earthquake by simple
intertimes statistics, given by the sum of all the IETs of ma-jor events divided by the number of the intertimes (see de-tails in Azzaro et al., 2012b). Since the main goal is to bring the process of earthquake occurrence back to the scale of the individual fault, we calculated intertimes of earthquakes oc-curring on the same fault (in all, six intertimes), and then we applied statistics to obtain a Tmeanof 71.3 years and an
ape-riodicity factor ↵ = /Tmean= 0.42, a typical value for
semi-periodic processes. Of course, in this way we assume that all the considered faults are characterized by the same values of Tmean and ↵ (Table 1). Given that the intertimes dataset
is not robust from a statistical point of view, we also applied a bootstrap analysis by sampling the initial IET dataset with replacement 1000 times to verify the confidence intervals of the results, similarly to the procedure adopted for paleoseis-mic datasets (Parsons, 2008), which typically are as “poor” as our sample. As a result, Tmeanremains stable while ↵ is
15 % lower than the value reported above.
The inset of Fig. 2 represents the retrospective analysis ob-tained by Azzaro et al. (2012b); the probability of having a characteristic earthquake on an individual fault in the next
5 years, a period chosen as representative of short-term earth-quake rupture forecast in a high seismic rate region like Etna, is plotted vs. time; the time-invariant probability according to a Poisson distribution is represented by the horizontal pink line (at about 7 % in 5 years), whilst the waves represent fault time-dependent probabilities calculated according to a Brow-nian passage time (BPT) distribution (Matthews et al., 2002). The renewal process causes a sharp drop of the conditional probability function at the occurrence time of earthquakes assigned to each fault; note that all the historical events have occurred when the time-dependent probability of having an earthquake in the next 5 years is higher than the one derived with stationary assumptions, thus supporting the choice of time dependency in our analysis. By doing this, we of course consider that fault behavior inside seismogenic zone (SZ) Timpe is somehow uniform, being affected by the same seis-motectonic regime (Alparone et al., 2011).
4 Recent earthquake dataset: from the instrumental catalogue to the characterization of seismic sources Regarding short-term seismicity, we used data recorded by the seismic network of eastern Sicily that is operated by the Istituto Nazionale di Geofisica and Vulcanologia, Osservato-rio Etneo, in Catania. Although the instrumental data at Etna have been collected since the early 1990s, a revised and com-plete earthquake catalogue has been compiled from 2000 by using a one-dimensional VPvelocity model (Alparone et al.,
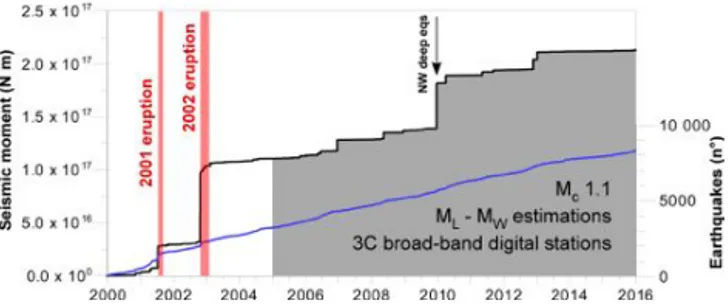
2015; Gruppo Analisi Dati Sismici, 2016). For this study, we considered only the portion of the catalogue from 2005 to 2015. In this time window, the seismic release is gener-ally regular in terms of both energy and numbers of events, not altered by the significant steps typically related with the seismic swarms accompanying eruptions at Etna, as occurred in 2001 and 2002–2003 (Fig. 3). Moreover, since 2005 the seismic network has undergone a major upgrade, in both the number of stations and technology, with three-component broadband seismometers and digital acquisition. This
tech-Figure 3. General trend of seismicity at Mt. Etna from 2000 to 2015: the black line indicates the cumulative seismic moment (calculated according to Kanamori, 1977), and the blue line shows the number of earthquakes. The periods marked in red indicate the main flank eruptions; in gray, the time span selected for the analy-sis. Note that the step in the seismic release at the end of 2009 is related to a seismic sequence in the NW sector of the volcano at a depth of 24–28 km, not affecting the characterization of the shallow sources.
nological development has allowed the detection of very low energy events (Mw 1), the calculation of homogeneous and
well-calibrated local magnitudes (Tuvè et al., 2015) and the application of advanced techniques for locating hypocenters (Mostaccio et al., 2013).
In order to better define seismic clusters or hypocentral alignments, thus contributing to the seismic source identifi-cation needed by the V3 project, the 2005–2015 earthquake dataset was re-processed (Cocina et al., 2016) by using a three-dimensional VPvelocity model (Alparone et al., 2012)
and the tomoDDPS algorithm (Zhang et al., 2009). Com-pared to more simple methods, this code uses a combina-tion of both absolute and differential arrival time readings between events of an earthquake cluster, so that for earth-quakes with foci lying close to each other, travel time errors due to incorrect velocity models in the volume outside the cluster are essentially ruled out.
As a result, we obtained a revised dataset consisting of 4286 seismic events with Mw up to 4.8; the magnitude of
completeness of the catalogue Mcis 1.1. Regarding the
mag-nitude scale, the Mwvalues of major recent earthquakes are
taken from the literature or MedNet bulletin (http://mednet. rm.ingv.it/earthquakes.php), whereas we adopted the ML–
Mwrelationship calibrated on moment tensor analysis (Saraò et al., 2016) to convert the ML values reported in the
cata-logue. In general, most of shallowest earthquakes occurring at Etna in the 2005–2015 period are located in the eastern sector of the volcano within 7 km of depth (orange in Fig. 4a), clustering around the tectonic features of the Timpe and Per-nicana fault systems. It should be noted that this seismicity is strictly related with the continuous fault activity and volcano-tectonic dynamics as a whole (Patanè et al., 2004; Solaro et al., 2010). Conversely, seismicity occurring at deeper crustal levels mainly represents purely tectonic regional dynamics due to the current compressive regime at the front of the
Si-cilian Chain-Foreland (Lavecchia et al., 2007; De Guidi et al., 2015; Scarfì et al., 2016). The most significant seismo-genic volume in the deep crust beneath Etna is the one in the northwestern sector of the volcano, with focal depths in the range of 22–30 km.
4.1 Area seismic sources
The area sources represent the most simplified representa-tion of the fault systems that are relevant for seismic hazard. Area sources, or SZs, are polygons including one or more faults where the earthquake occurrence rate is uniformly dis-tributed and seismicity occurs at a defined (i.e., fixed) level of depth. This conceptual approach has been used in the past for the Italian seismic hazard map MPS04 (Meletti et al., 2008; Stucchi et al., 2011) and, more recently, for the Eu-ropean hazard map in the SHARE project too (Woessner et al., 2015).
Despite the detailed knowledge of the geometries of the active faults at Etna (Azzaro et al., 2013a), defining a SZ is not an easy task since the individual tectonic elements con-sidered here are very close to each other, just 1 km apart in the case of the Timpe fault system (Azzaro et al., 2012a). The borders of the SZs are then defined as buffer zones around the fault lines containing only the shallowest events occurring within 7 km depth (orange in Fig. 4a) of the relocated instru-mental earthquake dataset. This is in agreement with the su-perficial nature of the volcano-tectonic structures, not rooted in the crust. In addition, we also grouped adjacent structures. In this way, we obtained four areal seismic sources – three for the Timpe system and one for the Pernicana system (blue polygons in Fig. 4a) – respecting the homogeneity in terms of other seismological and geological features (Mmax, length
and width, kinematics, slip rate; see also De Guidi et al., 2012).
These SZs represent the recent seismotectonic activity of the shallowest crust ( 7 km) at Mt. Etna as well as all the strongest historical earthquakes (Mw 4.6) associated with
faults discussed before. About 1000 earthquakes were used for the detailed characterization of the areal sources. For an additional exploration on the epistemic uncertainties in defin-ing source geometry, we also considered an extended SZ em-bracing the whole Timpe system, shown as a red polygon in Fig. 4a. In the following, we reported some graphs for the whole Timpe area; even if they are not used in the hazard computation (see Peruzza et al., 2017), we believe they pro-vide the reader with an insight on the uncertainties associated with the source geometry when a less detailed characteriza-tion mediating nonhomogeneous behavior inside the zone is used.
4.1.1 Effective depth
The characterization of the area sources includes the estima-tion of the effective depth, i.e., the seismogenic layer where
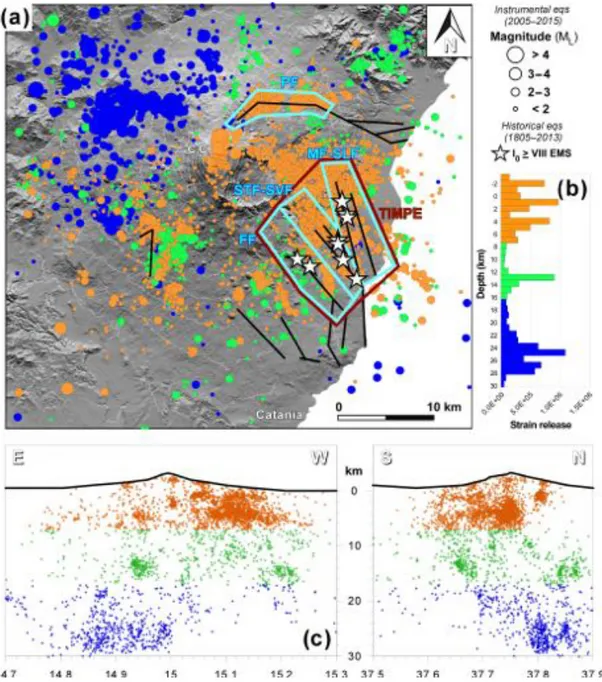
Figure 4. (a) Historical and instrumental seismicity used for characterizing seismic sources at Etna. Areas in light blue indicate the seismic zones: PF is the Pernicana fault (295 earthquakes); MF-SLF are the Moscarello and S. Leonardello faults (354 eqs.); STF-SVF are the S. Tecla and S. Venerina faults (313 eqs.); FF is the Fiandaca fault (69 eqs.); Timpe (919 eqs.). Solid black lines represent the simplified pattern of active faults.(b) Distributions of seismic strain release vs. focal depth for the 2005–2015 instrumental earthquake dataset referring to the entire Etna region.(c) Cross sections of the 2005–2015 instrumental earthquakes beneath the volcano.
most of the seismic energy is released. To this end, we cal-culated, by using the events included in each SZ, the distri-bution of the number of earthquakes above the completeness threshold and the related strain release vs. the focal depth, with steps of 1 km. Results in Fig. 5 indicate that the seismo-genic thickness is mainly confined to the first 5 km of crust, a value in agreement with the focal depth distribution of over-all seismicity in the Mt. Etna region (Fig. 4b). Note that, due to the cone-shaped topography of the volcano rising up 3000 m, hypocenters can be located above sea level (depth
in these cases assumes negative values). In more detail, a first seismogenic layer can be observed at 0–2 km b.s.l. (be-low sea level) in all SZs, but a second layer is also evident at 4–5 km b.s.l., defining the bottom of S. Tecla–S. Vener-ina (STF-SVF) and Moscarello–S. Leonardello faults (MF-SLF) area sources. It should be noted that major seismicity (M 3.0 eqs.) occurs within both layers (dark blue in Fig. 5). A similar pattern also emerges for the Timpe SZ, which in-cludes the aforementioned individual SZs (except PF), con-firming the main contribution to seismogenesis of the deeper
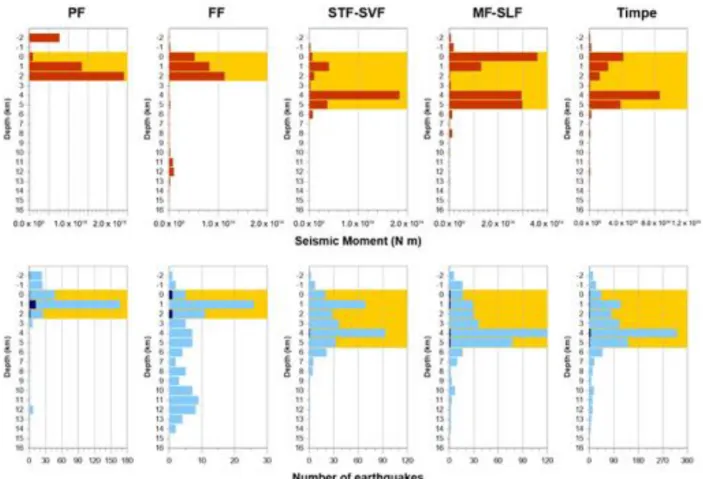
Figure 5. Distributions of seismic strain release (top panels) and number of earthquakes (bottom panels) vs. focal depth for the SZs considered in the model. Dark blue histograms indicate the number of earthquakes with Mw 3.0. The effective depth is marked in orange. Abbreviations
as in Fig. 4.
focal depth level. In conclusion, SZs at Mt. Etna are char-acterized by shallow effective depths, with PF and Fiandaca fault (FF) in the range of 0 to 2 km and other sources between 0 and 5 km b.s.l. (marked by orange stripes in Fig. 5). These intervals are used as reference depths in the hazard computa-tion (see details in Peruzza et al., 2017).
4.1.2 Seismic rate
Seismic rates have been determined by analyzing the frequency–magnitude distribution from the instrumental earthquake catalogue by using the ZMap tools (Wiemer, 2001). The FMD of each SZ is estimated by maximum likeli-hood method (Wiemer and Wyss, 2002) using only the shal-lowest events (those occurring within a depth of 7 km b.s.l.), so that a and b coefficients of the Gutenberg–Richter (GR) relationship are representative of the seismic activity of shal-low sources. The magnitude of completeness, Mc, of this
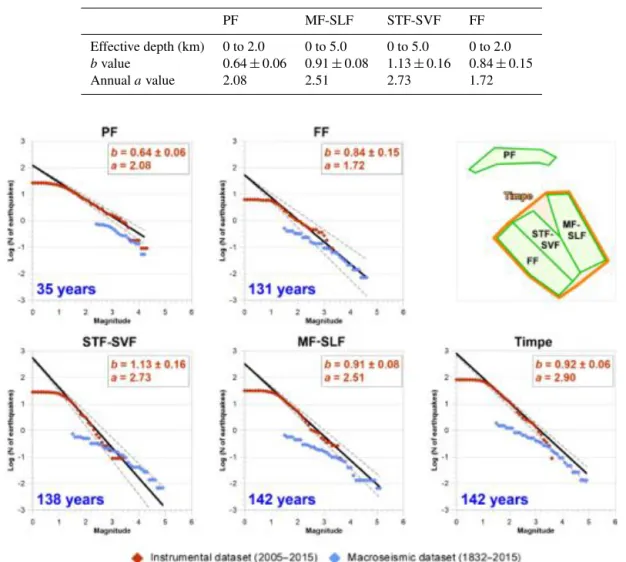
subset of data is 1.3–1.4. The obtained FMDs (red in Fig. 6) indicate that the Timpe faults (FF, STF-SVF, MF-SLF) have b values varying from 0.84 to 1.13 (Table 2), while PF is characterized by a lower b value (0.64).
To check whether the FMDs obtained from an instrumen-tal earthquake dataset during an interseismic period of just 11 years represent the deformation processes driving the volcano-tectonic activity on the Mt. Etna’s flanks, and thus are adequate to describe the long-term seismogenic behav-ior, we calculated FMDs from the historical macroseismic catalogue (blue symbols in Fig. 6). The historical catalogue covers a time span of ca. 150 years for all the SZs except for PF, whose anthropization (and thus the seismic history) is limited to the last decades at most. Since the time exten-sion of the instrumental and historical sub-catalogues is dif-ferent, all the FMDs are represented after a normalization to 1 year. The visual comparison of the observed rates shows a satisfying match between macroseismic and instrumental data; there are no jumps or huge variations in slope, as often happens when dealing with such analyses, for example due to nonuniform magnitude assessment. For the Timpe sources (treated as a group, or separated in main fault systems in FF, STF-SVF, MF-SLF) the macroseismic FMDs are within the uncertainties of the instrumental ones, starting approx-imately above Mw= 3.5. Above this point, historical data
represent the GR relationships for the high magnitudes, ob-viously not represented during an interseismic phase;
con-Table 2. Effective depth, b and a coefficients of the GR relationship for each SZ, obtained from the instrumental earthquake dataset (2005– 2015). PF MF-SLF STF-SVF FF Effective depth (km) 0 to 2.0 0 to 5.0 0 to 5.0 0 to 2.0 bvalue 0.64 ± 0.06 0.91 ± 0.08 1.13 ± 0.16 0.84 ± 0.15 Annual a value 2.08 2.51 2.73 1.72
Figure 6. Frequency magnitude distribution for each SZ. Red dots refer to the instrumental dataset, blue dots to the macroseismic one; dotted lines indicate uncertainties concerning the GR relationship (black line). b and a values are obtained from the instrumental earthquake dataset. Years indicate the actual time window (Tlast Tfirst) of the events in each sub-catalogue of the historical dataset. Data are normalized to 1 year. Abbreviations as in Fig. 4.
versely, the macroseismic FMDs deviate from the GR fitting at low magnitudes, thus representing the incompleteness of historical records for small earthquakes, a fact that is widely known. Regarding the PF, the minor fit of instrumental and macroseismic FMDs is certainly due to the incompleteness of the macroseismic catalogue (short seismic history and events “lost” because the area is largely uninhabited). Finally, we calculated ↵ from GR according to Zöller et al. (2008) (see Table 1).
In conclusion, since we believe that the FMDs from instru-mental and historical macroseismic catalogues match fairly well, we accept the simplification of adopting the 2005– 2015 instrumental seismicity rates as proxies for the long-term seismogenic behavior of area sources. Therefore a and b values are calculated from the instrumental seismicity
de-tected by high-quality monitoring during an interseismic pe-riod (i.e., in which no seismic swarm due to eruptions or vol-canic activity has significantly affected our SZs) and will be used for characterizing the seismicity rates and extrapolating the GR relationships beyond the maximum value observed in these 11 years. The maximum magnitude has to be fixed on independent criteria that will be historical and/or geological, as described in the following.
4.2 Distributed seismicity
An alternative gridded seismicity approach has been used to depict 3-D point sources in a crustal volume beneath Mt. Etna. After several sensitivity tests, we calculated the a and b values of the GR relationship as follows: we created a three-dimensional grid with an inter-nodal
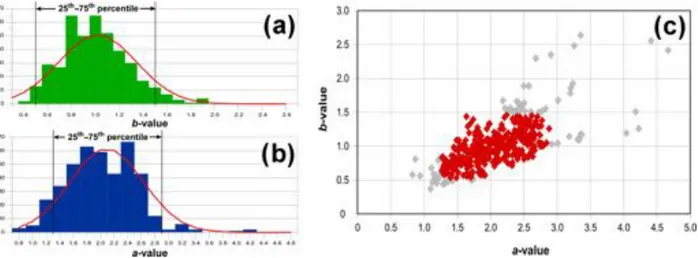
dis-Figure 7. (a, b) Histograms showing the frequency distribution of b and a values. (c) Plot of a and b values obtained for the grid nodes; discarded values are in gray.
Figure 8. Distribution of the b values beneath Etna calculated from the instrumental earthquake catalogue (2005–2015): the horizontal sections show the grids at different depths.
tance of 2 km and applied a constant search radius of 3 km to sample the 2005–2015 instrumental earthquake dataset; grid nodes with less than 20 earthquakes were discarded. The maximum-likelihood method according to Wiemer and Wyss (2002) was applied for GR interpolation of events above the Mc threshold (1.3); a values have been
normal-ized according to the volume represented. In this way, we obtained a grid consisting of 422 nodes; however, since the obtained sample of a and b values features scattering, we filtered the dataset by removing the outliers and considered only the values between the 25th and 75th percentiles (Fig. 7a and b). As a result, the number of grid nodes used to charac-terize distributed seismicity is 359 (Fig. 7c).
We considered only the spatial variation of the b value since the number of earthquakes in the grid nodes is not generally sufficient to be split into different time windows. Figure 8 shows the variability of the b values at different
depths beneath the Etna region. Variations are noteworthy in the first 7 km of the crust, with low b values ( 0.8) charac-terizing the northern sector of the volcano around PF at very shallow levels of 2/ 1 km and higher b values ( 1.2) in the central sector of Etna at a depth of 4 km. Note that in the eastern sector, including the SZ Timpe at depths ranging from 2 to 6 km b.s.l., the b value pattern varies widely both in value (0.7–1.2) and in space (patches extending a few kilo-meters). Finally, a relatively minor variation of b values (0.9– 1.1) is evident at intermediate crustal levels in the range of 10–16 km, while at depths higher than 20 km low b values ( 0.9) prevail again.
This overall picture shows analogies with the pattern found by Murru et al. (1999, 2007) on a temporally different earth-quake dataset (1999-2005), highlighting two areas character-ized by higher b values than other surrounding areas: (i) be-neath the central craters and (ii) in the eastern flank, at a
depth range of 5–7 km. Although the b values cannot be com-pared as absolute numbers because they were calculated from two different magnitude scales – MLin this study, Mdin the
Murru et al. (2007) paper – the aforementioned spatial vari-ations remain constant during time though the datasets cover contiguous time windows. The spatial distribution of the sta-tistical parameters obtained from the IET analysis (Sicali et al., 2014) also displays similar lateral variations, indicating that the characteristics of earthquake occurrence in the cen-tral sector are very different from PF or SZ Timpe, the latter being more similar to the IET distribution observed in purely tectonic settings.
In conclusion, even if we cannot rule out that transient properties of the state of stress may influence the b value in some cells, we believe that the above comparisons – as well as the overall good match between short-term instru-mental and historical catalogue seismicity rates (respectively red and blue dots in Fig. 6) – are sufficient evidence that micity rates deduced from a few years of instrumental seis-micity during an interseismic period are representative of the longer-term seismicity rates. They can thus be considered to represent the distributed seismicity in the source model.
5 Individual sources: seismic rates from geometric–kinematic fault parameters
In the previous chapters, seismic rates assigned to faults and area sources have been defined by historical macroseismic and instrumental earthquake data. Taking advantage of the huge amount of geological field data and active tectonics evidence, we also performed a fault source modeling. This is based on a purely geological approach by converting the geometric–kinematic parameters representing fault activity into a budget of seismic moment potentially released by the structure through a computational scheme that also accounts for a MSR. For each fault, we then obtain the most proba-ble value of expected characteristic magnitude (Mchar) with
the associated standard deviation , the corresponding mean recurrence time (Tmean) and the aperiodicity factor ↵, which
are the basic ingredients to compute earthquake occurrence probabilities, both under a Poissonian assumption and in a time-dependent perspective.
5.1 Method and input data
The analysis has been carried out using the software FiSH, a MATLAB®routine developed to quantify the seismic
activ-ity of a fault from its geometric–kinematic parameters (Pace et al., 2016). The adopted approach is an evolution of the one by Peruzza et al. (2010) based on the criterion of “segment seismic moment conservation” (Field et al., 1999). It takes into account the formal propagation of uncertainties in mag-nitude and slip rate and uses directly the 3-D fault geometry (length, dip angle, thickness of the seismogenic layer) and
slip rate of a seismogenic structure. If a fault has a list of events associated with, the mean values (magnitude, recur-rence time) and their variability derive directly from histor-ical or paleoseismologhistor-ical observations. However, there are very few cases of effective repetition of major earthquakes on the same fault segment in Italy, mostly along the Apennines in Central Italy (Galli et al., 2010; Cinti et al., 2011; Moro et al., 2013; Peruzza et al., 2011). At Mt. Etna, some 10 major earthquakes (Mw= 4.3–5.2) occurred repeatedly along the
fault segments of the Timpe and Pernicana systems (Azzaro et al., 2012b).
The FiSH code uses different empirical and analytical re-lationships available in the literature between fault geometry and the characteristics of the expected earthquake in order to quantify several values of Mmaxand associated Tmean.
Tak-ing uncertainties of magnitude and slip rate into account, the software provides budgeting of the seismic moment rate. Fi-nally, it uses the selected values to calculate the hazard rates, for a given exposure time, according to a Poissonian distri-bution or, in a time-dependent perspective that also consid-ers the time elapsed since the last event, using some other widely used probability density function. For this study, the BPT (Matthews et al., 2002) is adopted to represent time de-pendency.
Regarding our input data, the geometry, slip rate and kine-matics of the fault segments are constrained by detailed geo-logical/geomorphological field investigations (Azzaro et al., 2012a; D’Amato et al., 2017) and geodetic data, the latter providing information on the vertical extension of faults as well as short-term slip rates (Azzaro et al., 2013a). The 3-D model of the individual sources considered in our applica-tion is shown in Fig. 9, together with the related geometric– kinematic parameters.
5.2 MSR for volcano-tectonic events
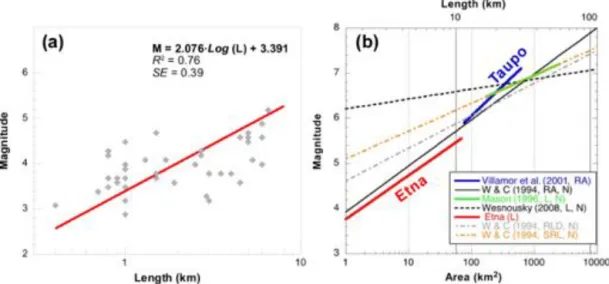
The characterization of an earthquake scaling relationship, which is suitable for a volcanic domain such as Etna, is a key step for modeling the rupture extent of these low-to moderate-magnitude events. Whereas empirical relation-ships derived for tectonic domains are widely available in the literature for both worldwide applications and regional con-texts, those calibrated for active volcanic areas are relatively few. Among these, Stirling et al. (2013) mentioned those developed for thin-crust volcano-tectonic contexts (Mason, 1996; Wesnousky, 2008) and the one specifically derived for the Taupo volcanic zone in New Zealand (Villamor et al., 2001).
At Mt. Etna, major shallow volcano-tectonic earthquakes produce surface faulting with end-to-end rupture lengths up to 6.5 km and vertical offsets up to 90 cm. Systematic his-torical investigations and recent observations have enabled compiling an earthquake rupture catalogue that reports some 50 coseismic faulting events (Azzaro, 1999, 2004). In this analysis, we use the most reliable observations of this dataset
Figure 9. Pattern of individual sources used in the geological model and related geometric–kinematic parameters: red boxes in the left frame represent the projection at the surface of the fault planes, while lines indicate the vertical planes. Note that lengths refer to the seismogenic fault segments only, whereas the ones governed by prevailingly creeping behavior are not considered.
Figure 10. (a) Plot of earthquake magnitude vs. rupture length for the Etna region (this study); (b) comparison with the magnitude–size scaling relationships for the Taupo volcanic zone (Villamor et al., 2001) and other relationships worldwide (Wells and Coppersmith, 1994; Mason, 1996; Wesnousky, 2008). Abbreviations: L is fault length; N is normal kinematics; RA is rupture area; RLD is rupture length at depth; SRL is surface rupture length.
(43 data points) to derive a magnitude–scaling relationship that is specific for the Etna region, calibrated in the range Mw= 2.8–5.2 (Fig. 10a).
In Fig. 10b, Mt. Etna MSR is plotted together with the ones available for tectonic and volcanic domains. Considering the approximations due to the use of different dimensional mea-surements – magnitude scales, rupture length vs. rupture area – and the limitation in extrapolating the fitting outside the original magnitude ranges, the comparison is quite satisfac-tory. We note a strong analogy with respect to the trend of the relationship suggested by Villamor et al. (2001) for the
Taupo volcanic zone, although the Etna one is scaled by ca. 1 order of magnitude, whereas discrepancies are substantial for thin-crust volcano-tectonic context relationships proposed by Mason (1996) and Wesnousky (2008). Also the set of world-wide relationships by Wells and Coppersmith (1994) based on rupture length (rupture length at depth and surface rup-ture length) tends, at different degrees, to overestimate the earthquake magnitude.
These considerations suggested using both the Etna and Taupo MSRs to calculate the seismic rates of the individual sources; in this way we tend to minimize the epistemic
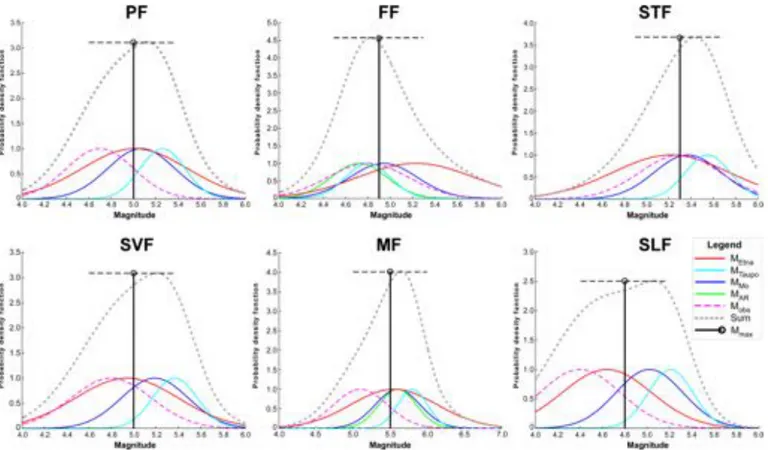
uncer-Figure 11. Maximum magnitudes (Mmax) estimated by the FiSH code for the studied faults. Abbreviations: MEtna MTaupois the magnitude from earthquake scaling relationships for Etna and Taupo; MMois the scalar seismic moment magnitude; MARis the magnitude from aspect ratio relationships; Mobsis the maximum observed magnitude. Uncertainties are represented by probability curves (see text for explanation).
tainty associated with them. However, the effective interval of extrapolation of Taupo MSR is narrow, since the length of faults to be used for estimating expected Mcharis mostly in
the range 7–11 km, i.e., next to the lower part of the Taupo MSR (see Fig. 10b, length in logarithm scale).
5.3 Maximum expected magnitude and related mean recurrence times
The FiSH code calculates the value of magnitudes expected for the full rupture of each fault by the above-defined em-pirical scaling relationships. In order to check the geometri-cal consistency of the sources, it also estimates a maximum magnitude (Mmax) according to (i) the scalar seismic
mo-ment (MMo) by using the modified formulation of magnitude
(IASPEI, 2013) and a constant strain drop value of 3 ⇥ 10 5
and (ii) an additional constraint based on the aspect ratio re-lationships (MAR) derived by Peruzza and Pace (2002).
Fig-ure 11 shows probability curves of all the Mmaxvalues
de-rived so far, assuming that a normal distribution represents the associated uncertainty, with a symmetrical bell shape dis-tributed around the central value; the maximum historical observed magnitude (Mobs) is also reported using the
stan-dard deviation of M assigned in the earthquake catalogue. The dashed curve (SUM) represents the summation of the
probability density functions, whereas the vertical black line indicates the central value of its Gaussian fit to be considered as the reference mean value (Mmax), with the associated
stan-dard deviation ( Mmax) given by the horizontal dashed line
(for details see Pace et al., 2016).
In general, the magnitude values calculated by the differ-ent relationships are not drastically differdiffer-ent from each other if the wide uncertainty ranges are taken into account. Note that the Mmaxvalues are consistent with the Mobsfor the
sim-plest and best documented sources (FF, STF); in the cases of more complex structures (e.g., PF and SLF) that are charac-terized by coseismic slip and creeping alternating in space and even in time along strike (Azzaro, 2004), the maximum observed magnitude always lies in the range of full rupture magnitude minus 1 standard deviation (Mmax Mmax).
The mean recurrence times (Tmean) associated with
Mmax values are computed, accounting for slip rate
val-ues and related uncertainties, which are strongly dependent (see Fig. 9); resulting Tmeanvary from 22 to 166 years
(Ta-ble 1). However, these values cannot merely be compared with those resulting from the analysis of the historical earth-quake dataset, representative of the entire SZ Timpe (Ta-ble 1). Finally, the aperiodicity factor ↵, defined as the stan-dard deviation of the recurrence times over their mean, has been estimated by introducing the formal error propagation
to take account of the uncertainties in Mmax and slip rates
and so to explore how these uncertainties affect the variabil-ity of Tmean.
6 The final source models
The three types of seismic sources described above are used in the final seismic hazard assessment following the concep-tual scheme reported in Fig. 12; for further details of the com-putation, the reader can refer to the companion paper, Part 2 (Peruzza et al., 2017). The following is a brief summary:
– Area seismic sources (cf. Fig. 4) are horizontal planar surfaces of distributed (uniform) seismicity that encom-pass the best-known seismogenic fault systems on the eastern and northern flanks of Mt. Etna; a and b val-ues are calibrated on instrumental seismicity, effective depths are estimated by the analyses of strain release profiles and Mmax is based on historical earthquake
data. These sources represent the so-called “Level 1”, the simplest one with no branches, a first evolution of the Poissonian model used by the current seismic hazard map of Italian regulation (MPS04, Stucchi et al., 2011), where the whole volcanic edifice was enveloped into a single polygonal area.
– Fault sources (cf. Fig. 9) representing major earth-quakes (M > 4.5) are combined with the areas in a more complex source model, namely “Level 2”. Here, the faults are individually modeled in terms of 3-D ge-ometry based on tectonic field data and geodetic in-formation; they are assumed to behave according to a characteristic earthquake model. Background seismic-ity is represented by the area sources of Level 1, where only earthquakes between M = Mmin and Mmax= 4.5
are modeled. The logic tree is in this case represented by four branches, based on historical or geological param-eterization of characteristic earthquakes and on Poisson or time-dependent assumptions on recurrence intervals. – The most complex source model is “Level 3”, which combines fault sources as in Level 2 with point sources (cf. Fig. 8) which are used to represent distributed (grid-ded, nonuniform) seismicity. We prefer this the model as it is less driven by subjectivity in source defini-tion, though it is not free of problems or questionable choices.
These levels form alternative seismic source models, stated in order of increasing complexity, to represent the epistemic uncertainties.
Figure 12. Schematic chart describing the three levels of the source models defined for the Mt. Etna region: increasing complexities are introduced from levels 1 to 3; the final logic tree we adopt is Level 3, with four branching levels. Details of computations are given in Part 2 (Peruzza et al., 2017).
7 Conclusive remarks
In this paper we tackled the problem of characterizing low-magnitude, shallow seismic sources, capable of affecting the seismic hazard for short exposure times at Mt. Etna, the largest active volcano in Europe. Usually the problem of ground shaking due to local superficial volcano-tectonic faults is discarded in favor of estimates based on large-scale regional crustal faults capable of generating strong earth-quakes (M > 6); in addition, other major threats related to the eruptive activity, or to the flank instability (Acocella et al., 2013; Acocella and Puglisi, 2013), can be first-order pri-orities for land planning and risk mitigation actions. But on Mt. Etna’s slopes, several inhabited localities have been re-peatedly and heavily damaged as a consequence of local earthquakes with M < 5.5 that may be connected to the erup-tion phases or not. In the documented history, such damage occurred on average every 20–25 years, the last sequence be-ing along SVF in 2002. To tackle these issues, the Italian Department of Civil Defense (DPC) has funded two research programs on Mt. Etna aimed at mitigating, among other risks, the seismic one (Acocella and Puglisi, 2010; Azzaro and De Rosa, 2016). In this framework we started to characterize, with different methodological approaches, shallow sources and finally to assess the seismic hazard at the local scale of the volcano (Azzaro et al., 2012b, 2013b, 2016; Peruzza et al., 2017). Some basic ideas have driven our analyses. Firstly, a few years of high-quality seismic monitoring in an “inter-seismic” period can be representative of the long-term seis-mic rates of faults. Secondly, fault size and slip rate can con-strain the maximum magnitude and the seismic moment bud-geting, and geologic–geodetic-derived seismic rates must be
coherent with historical and instrumental data. If such ideas are true, we can extend the modeling of seismic sources to the whole volcanic complex by addressing “unknown” faults by distributed point sources. We are then no longer forced to use independent events (i.e., the declustered earthquake cat-alogue, assuring stationarity of the process) but can compute the probabilities of events for any magnitude–frequency dis-tribution for a generalized non-Poissonian model.
We focused our analyses on two main volcano-tectonic fault systems evaluated at the surface and by geophysical investigations. Table 2 reports an overview of the relevant parameters to be used as input data in the companion paper by Peruzza et al. (2017). PF is an E–W-oriented, S-dipping system of brittle and creeping transtensional segments: very shallow instrumental seismicity (located very often above the sea level) depicts quite well the 3-D geometry of this struc-ture characterized by low b values (< 0.7). The Timpe system in the SE flank is a group of nearly vertical normal faults. Their deep geometry cannot be precisely detected even by the high-quality instrumental earthquake dataset available in recent years. Area seismic sources have been depicted with increasing detail by using space buffers around the surface trace faults. Taken as a whole, the FMD of the SZ Timpe – as derived from the instrumental dataset of 2005–2015, a period that represents the “interseismic background” level not affected by main earthquake sequences – is similar to the FMDs and depth distributions of the MF-SLF, whilst the FF and STF-SVF show, respectively, lower and higher b values and activity rates. This apparent discrepancy can be accounted for by (i) the SZ Timpe, which also includes two small triangular areas (see upper right panel in Fig. 6), adding another 183 earthquakes (cf. Fig. 4 caption); and (ii) the “weight” of earthquakes of MF-SLF in terms of seis-mic moment released, which is much higher compared to the ones of FF and STF-SVF, and hence the similarity between SZ Timpe and MF-SLF is more evident.
Regarding the seismicity rates to be assigned to the faults, we note a global consistency by using the geometric– kinematic approach and the historical earthquake dataset. The maximum magnitudes (Mmax) calculated by scaling
relationships appear ca. 0.3–0.6 units higher than the ob-served magnitudes (Mobs), whilst the related mean
recur-rence times (Tmean) are sometimes lower, modulated by the
fast slip rates. There may be a number of reasons for these discrepancies, such as (i) uncertainties of the geologic slip rate estimations, (ii) geometries of the modeled faults not be-ing well constrained, (iii) difficulty in discriminatbe-ing pre- and post-seismic slip with respect the coseismic rupture length and (iv) the role of fault segments in accommodating defor-mation (slip rate partitioning).
Finally, the aperiodicity coefficients suggest sensitivity tests and care in modeling faults by a time-dependent ap-proach: the ↵’s obtained by geologic data indicate a quasi-stationary behavior of the maximum-sized events, whilst the one calculated from the intertimes of historical earthquakes
suggests a certain degree of periodicity. Both the seismicity rates for Mmax, however, are within the uncertainties of rates
derived by the GR relationships of instrumental data. This work helps to improve our basic knowledge of seis-mogenic processes at Etna. Furthermore, it represents an ef-fort to provide the international scientific community with original procedures and methodological approaches to pro-duce hazards maps in other volcanic areas.
Data availability. Most of the data are available on the institutional websites. Those data not available on the institutional websites can be provided upon request.
Competing interests. The authors declare that they have no conflict of interest.
Special issue statement. This article is part of the special issue “Linking faults to seismic hazard assessment in Europe”. It is not associated with a conference.
Acknowledgements. Many thanks are due to G. Weatherill and C. Beauval for their fruitful comments and constructive criticism. The editor O. Scotti is also acknowledged for her valuable sugges-tions. R. Gee gave useful hints for developing some of the numeri-cal models in the initial stage of the work. This study has benefited from funding provided by the Italian Presidenza del Consiglio dei Ministri – Dipartimento della Protezione Civile (DPC), in the frame of the 2012–2014 Agreement with Istituto Nazionale di Geofisica e Vulcanologia (INGV), project V3 “Multi-disciplinary analysis of the relationships between tectonic structures and volcanic activity”. This paper does not necessarily represent DPC official opinion and policies.
The authors are grateful to S. Conway for revising the English text.
Edited by: Oona Scotti
Reviewed by: Graeme Weatherill and Céline Beauval
References
Acocella, V. and Puglisi, G.: Hazard mitigation of unstable volcanic edifices, Eos, 91, 357–358, 2010.
Acocella, V. and Puglisi, G.: How to cope with volcano flank dynamics? A conceptual model behind possible scenarios for Mt. Etna, J. Volcanol. Geoth. Res., 251, 137–148, 2013. Acocella, V., Puglisi, G., and Amelung, F.: Flank instability,
erup-tions, seismicity and hazard: the case of Mt. Etna, J. Volcanol. Geoth. Res., 251, 1–4, 2013.
Alparone, S., Barberi, G., Bonforte, A., Maiolino, V., and Ursino, A.: Evidence of multiple strain fields beneath the eastern flank of Mt. Etna volcano (Sicily, Italy) deduced from seismic and geode-tic data during 2003–2004, Bull. Vulcanol., 73, 869–885, 2011.
Alparone, S., Barberi, G., Cocina, O., Giampiccolo, E., Musumeci, C., and Patanè, D.: Intrusive mechanism of the 2008– 2009 Mt. Etna eruption: constraints by tomographic images and stress tensor analysis, J. Volcanol. Geoth. Res., 229–230, 50–63, https://doi.org/10.1016/j.jvolgeores.2012.04.001, 2012. Alparone, S., Maiolino, V., Mostaccio, A., Scaltrito, A., Ursino,
A., Barberi, G., D’Amico, S., Di Grazia, G., Giampiccolo, E., Musumeci, C., Scarfì, L., and Zuccarello, L.: Instrumental seismic catalogue of Mt. Etna earthquakes (Sicily, Italy): ten years (2000–2010) of instrumental recordings, Ann. Geophys., 58, S0435, https://doi.org/10.4401/ag-6591, 2015.
Azzaro, R.: Earthquake surface faulting at Mount Etna volcano (Sicily) and implications for active tectonics, J. Geodyn., 28, 193–213, 1999.
Azzaro, R.: Seismicity and active tectonics in the Etna region: constraints for a seismotectonic model, in: Mt. Etna: Volcano laboratory, edited by: Bonaccorso, A., Calvari, S., Coltelli, M., Del Negro, C., and Falsaperla, S., American Geophys-ical Union, Geophys. Monogr., Washington, D.C., 205–220, https://doi.org/10.1029/GM143, 2004.
Azzaro, R. and Castelli, V.: Materials for a catalogue of Mt. Etna earthquakes from 1600 to 1831, Quaderni di Geofisica, 123, Isti-tuto Nazionale di Geofisica e Vulcanologia, Roma, 278 pp., 2015. Azzaro, R. and De Rosa, R.: Project V3, multi-disciplinary analy-sis of the relationships between tectonic structures and volcanic activity (Etna, Vulcano-Lipari system), Final Report 1 Novem-ber 2014–30 June 2015, Agreement INGV-DPC 2012-2021, Vol-canological programme 2012–2015, Miscellanea INGV, 29, Is-tituto Nazionale di Geofisica e Vulcanologia, Roma, 172 pp., 2016a.
Azzaro, R. and De Rosa, R.: Understanding vol-canic eruptions where plates meet, Eos, 97, 12–17, https://doi.org/10.1029/2016EO052359, 2016b.
Azzaro, R., Barbano, M. S., Antichi, B., and Rigano, R.: Macro-seismic catalogue of Mt. Etna earthquakes from 1832 to 1998. Upgrade 1999–2008, Acta Volcanol., 12, 3–36, 2000.
Azzaro, R., D’Amico, S., and Tuvè, T.: Estimating the magnitude of historical earthquakes from macroseismic intensity data: new relationships for the volcanic region of Mount Etna (Italy), Seis-mol. Res. Lett., 82, 533–544, 2011.
Azzaro, R., Branca, S., Gwinner, K., and Coltelli, M.: The volcano-tectonic map of Etna volcano, 1 : 100.000 scale: an integrated ap-proach based on a morphotectonic analysis from high-resolution DEM constrained by geologic, active faulting and seismotectonic data, Ital. J. Geosci., 131, 153–170, 2012a.
Azzaro, R., D’Amico, S., Peruzza, L., and Tuvè, T.: Earthquakes and faults at Mt. Etna (Southern Italy): problems and perspec-tives for a time-dependent probabilistic seismic hazard assess-ment in a volcanic region, Boll. Geofis. Teor. App., 53, 75–88, 2012b.
Azzaro, R., Bonforte, A., Branca, S., and Guglielmino, F.: Geome-try and kinematics of the fault systems controlling the unstable flank of Etna volcano (Sicily), J. Volcanol. Geoth. Res., 251, 5– 15, 2013a.
Azzaro, R., D’Amico, S., Peruzza, L., and Tuvè, T.: Probabilistic seismic hazard at Mt. Etna (Italy): the contribution of local fault activity in mid-term assessment, J. Volcanol. Geoth. Res., 251, 158–169, 2013b.
Azzaro, R., D’Amico, S., and Tuvè, T.: Seismic hazard assessment in the volcanic region of Mt. Etna (Italy): a probabilistic ap-proach based on macroseismic data applied to volcano-tectonic seismicity, Bull. Earth. Eng., 17, 1813–1825, 2016.
Bell, A. F. and Kilburn, C. R.: Precursors to dyke-fed eruptions at basaltic volcanoes: insights from patterns of volcano-tectonic seismicity at Kilauea volcano, Hawaii, Bull. Volcanol., 74, 325– 339, 2012.
Bonaccorso, A., D’Amico, S., Mattia, M., and Patanè, D.: Intru-sive mechanisms at Mt. Etna forerunning the July–August 2001 eruption from seismic and ground deformation data, Pure Appl. Geophys., 161, 1469–1487, 2004.
Bonforte, A., Guglielmino, F., Coltelli, M., Ferretti, A., and Puglisi, G.: Structural assessment of Mount Etna volcano from Perma-nent Scatterers analysis, Geochem. Geophy. Geosy., 12, Q02002, https://doi.org/10.1029/2010GC003213, 2011.
Bousquet, J. C. and Lanzafame, G.: The tectonics and geodynamics of Mt. Etna: synthesis and interpretation of geological and geo-physical data, in: Mt. Etna: Volcano laboratory, edited by: Bonac-corso, A., Calvari, S., Coltelli, M., Del Negro C., and Falsaperla, S., Geophys. Monogr., American Geophysical Union, Washing-ton, D.C., 143, 29–47, https://doi.org/10.1029/GM143, 2004. Bozzano, F., Gaeta, M., Lenti, L., Martino, S., Paciello, A.,
Palladino, D. M., and Sottili, G.: Modeling the effects of eruptive and seismic activities on flank instability at Mount Etna, Italy, J. Geophys. Res.-Solid Ea., 118, 5252–5273, https://doi.org/10.1002/jgrb.50377, 2013.
Brune, J.: Tectonic stress and the spectra of seismic shear waves from earthquakes, J. Geophys. Res., 75, 4997–5009, 1970. Bruno, V., Mattia, M., Aloisi, M., Palano, M., Cannavò, F.,
and Holt, W. E.: Ground deformations and volcanic pro-cesses as imaged by CGPS data at Mt. Etna (Italy) be-tween 2003 and 2008, J. Geophys. Res., 117, B07208, https://doi.org/10.1029/2011JB009114, 2012.
Cinti, F. R., Pantosti, D., De Martini, P. M., Pucci, S., Civico, R., Pierdominici, S., Cucci, L., Brunori, C. A., Pinzi, S., and Patera, A.: Evidence for surface faulting events along the Paganica fault prior to the 6 April 2009 L’Aquila earthquake (central Italy), J. Geophys. Res., 116, B07308, https://doi.org/10.1029/2010JB007988, 2011.
CMTE Working Group: Catalogo Macrosismico dei Terremoti Et-nei dal 1600 al 2013, INGV, Catania, http://www.ct.ingv.it/ macro/etna/html_index.php, last access: 31 October 2017. Cocina, O., Alparone, S., Barberi, G., Giampiccolo, E., Maiolino,
V., Musumeci, C., Saraò, A., Scarfì, L., and Ursino, A.: Space-time distribution of seismicity and strain release, also in relation with the main recharging phases of the volcano, in: Project V3: multi-disciplinary analysis of the relationships between tec-tonic structures and volcanic activity (Etna, Vulcano-Lipari sys-tem), Final Report, edited by: Azzaro, R. and De Rosa, R., Miscellanea INGV, 29, 44–49, https://sites.google.com/a/ingv.it/ volcpro2014/ (last access: 31 October 2017), 2016.
D’Amato, D., Pace, B., Di Nicola, L., Stuart, F. M., Visini, F., Az-zaro, R., Branca, S., and Barfod, D.N.: Holocene slip rate vari-ability along the Pernicana fault system (Mt. Etna, Italy): evi-dence from offset lava flows, Bull. Geol. Soc. Am., 129, 304– 317, 2017.
De Guidi, G., Scudero, S., and Gresta, S.: New insights into the local crust structure of Mt. Etna volcano from seismological and
morphotectonic data, J. Volcanol. Geoth. Res., 223–224, 83–92, 2012.
De Guidi, G., Barberi, G., Barreca, G., Bruno, V., Cultrera, F., Grassi, S., Imposa, S., Mattia, M., Monaco, C., Scarfì, L., and Scudero, S.: Geological, seismological and geodetic evidence of active thrusting and folding south of Mt. Etna (eastern Sicily): revaluation of “seismic efficiency” of the Sicilian Basal Thrust, J. Geodyn., 90, 32–41, 2015.
Field, E. H., Johnson, D. D., and Dolan, J. F.: A mutually consis-tent seismic-hazard source model for Southern California, Bull. Seismol. Soc. Am., 89, 559–578, 1999.
Galli, P., Giaccio, B., and Messina, P.: The 2009 central Italy earth-quake seen through 0.5 Myr-long tectonic history of the L’Aquila faults system, Quaternary Sci. Rev., 29, 3768–3789, 2010. Gambino, S., Mostaccio, A., Patanè, D., Scarfì, L., and Ursino, A.:
High-precision locations of the microseismicity preceding the 2002–2003 Mt. Etna eruption, Geophys. Res. Lett., 31, L18604, https://doi.org/10.1029/2004GL020499, 2004.
Gasperini, P., Gresta, G., and Mulargia, F.: Statistical analysis of seismic and eruptive activities at Mt. Etna during 1978-1987, J. Volcanol. Geoth. Res., 40, 317–325, 1990.
Gresta, G., Marzocchi, W., and Mulargia, F.: Is there a correla-tion between larger local earthquakes and the end of erupcorrela-tions at Mount Etna volcano, Sicily?, Geophys. J. Int., 116, 230–232, 1994.
Grünthal, G. (Ed.): European Macroseismic Scale 1998 (EMS-98), European Seismological Commission, Subcommission on Engi-neering Seismology, Working Group Macroseismic Scale, 15, Luxembourg, 99 pp., http://www.ecgs.lu/cahiers-bleus/ (last ac-cess: 31 October 2017), 1998.
Gruppo Analisi Dati Sismici: Catalogo dei terremoti della Sicilia Orientale – Calabria Meridionale (1999-2015), INGV, Catania, http://www.ct.ingv.it/ufs/analisti/ (last access: 31 October 2017), 2016.
IASPEI – International Association of Seismology and Physics of the Earth’s Interior: Summary of Magnitude Work-ing Group recommendations on standard procedures for determining earthquake magnitudes from digital data, ftp://ftp.iaspei.org/pub/commissions/CSOI/Summary_WG_ recommendations_20130327.pdf (last access: March 2017), 2013.
Kanamori, H.: The energy release in great earthquakes, J. Geophys. Res., 82, 2981–2987, 1977.
Lavecchia, G., Ferrarini, F., De Nardis, R., Visini, F., and Bar-bano, M. S.: Active thrusting as a possible seismogenic source in Sicily (Southern Italy): Some insights from integrated structural-kinematic and seismological data, Tectonophysics, 445, 145– 167, 2007.
Mason, D. B.: Earthquake magnitude potential of the intermountain seismic belt, USA, from surface-parameter scaling of late Qua-ternary faults, Bull. Seismol. Soc. Am., 86, 1487–1506, 1996. Matthews, M. V., Ellsworth, W. L., and Reasenberg, P. A.: A
Brow-nian model for recurrent earthquakes, Bull. Seismol. Soc. Am., 92, 2233–2250, 2002.
Meletti, C., Galadini, F., Valensise, G., Stucchi, M., Basili, R., Barba, S., Vannucci, G., and Boschi, E.: A seismic source zone model for the seismic hazard assessment of the Italian territory, Tectonophysics, 450, 85–108, 2008.
Milana, G., Rovelli, A., De Sortis, A., Calderoni, G., Coco, G., Corrao, M., and Marsan, P.: The role of long-period ground mo-tions on magnitude and damage of volcanic earthquakes on the Mt. Etna, Italy, Bull. Seismol. Soc. Am., 98, 2724–2738, 2008. Moro, M., Gori, S., Falcucci, E., Saroli, M., Galadini, F., and Salvi,
S.: Historical earthquakes and variable kinematic behaviour of the 2009 L’Aquila seismic event (central Italy), causative fault, revealed by paleoseismological investigations, Tectonophysics, 583, 131–144, 2013.
Mostaccio, A., Tuvè, T., Patanè, D., Barberi, G., and Zuccarello, L.: Improving seismic surveillance at Mt. Etna volcano by prob-abilistic earthquake location in a 3D model, Bull. Seismol. Soc. Am., 103, 2447–2459, 2013.
Murru, M., Montuori, C., Wyss, M., and Privitera, E.: The locations of magma chambers at Mt. Etna, Italy, mapped by b-values, Geo-phys. Res. Lett., 26, 2553–2556, 1999.
Murru, M., Console, R., Falcone, G., Montuori, C., and Sgroi, T.: Spatial mapping of the b-value at Mount Etna, Italy, using earth-quake data recorded from 1999 to 2005, J. Geophys. Res., 112, B12303, https://doi.org/10.1029/2006JB004791, 2007.
Nercessian, A., Hirn, A., and Sapin, M.: A correlation between earthquakes and eruptive phases at Mt. Etna: an example and past occurrences, Geophys. J. Int., 105, 131–138, 1991.
Pace, B., Visini, F., and Peruzza, L.: FiSH: MATLAB tools to turn fault data into seismic hazard models, Seismol. Res. Lett., 87, 374–386, https://doi.org/10.1785/0220150189, 2016.
Palano, M.: Episodic slow slip events and seaward flank motion at Mt. Etna volcano (Italy), J. Volcanol. Geoth. Res., 324, 8–14, 2016.
Parsons, T.: Monte Carlo method for determining earthquake re-currence parameters from short paleoseismic catalogs: exam-ple calculations for California, J. Geophys. Res., 113, B03302, https://doi.org/10.1029/2007JB004998, 2008.
Patanè, D., Cocina, O., Falsaperla, S., Privitera, E., and Spamp-inato, S.: Mt. Etna volcano: a seismological framework, in: Mt. Etna: Volcano Laboratory, edited by: Calvari, S., Bonac-corso, A., Coltelli, M., Del Negro, C., and Falsaperla, S., Am. Geophys. Union, Geophys. Monogr., 143, Washington, D.C., 147–165, 2004.
Peruzza, L. (coord.): Project S2 Final Scientific Report Agreement INGV-DPC 2012–2021, Seismological Program 2012–13, https: //sites.google.com/site/ingvdpc2012progettos2/documents/ (last access: 31 October 2017), 2013.
Peruzza, L. and Pace, B.: Sensitivity analysis for seismic source characteristics to probabilistic seismic hazard assessment in Cen-tral Apennines (Abruzzo area), Boll. Geofis. Teor. App., 43, 79– 100, 2002.
Peruzza, L., Pace, B., and Cavallini, F.: Error propagation in time-dependent probability of occurrence for characteristic earth-quakes in Italy, J. Seismol., 14, 119–141, 2010.
Peruzza, L., Pace, B., and Visini, F.: Fault-based earthquake rup-ture forecast in Central Italy: remarks after the L’Aquila Mw6.3
event, Bull. Seismol. Soc. Am., 101, 404–412, 2011.
Peruzza, L., Azzaro, R., Gee, R., D’Amico, S., Langer, H., Lom-bardo, G., Pace, B., Pagani, M., Panzera, F., Ordaz, M., Suarez, M. L., and Tusa, G.: When probabilistic seismic hazard climbs volcanoes: the Mt. Etna case, Italy – Part 2: Computational im-plementation and first results, Nat. Hazards Earth Syst. Sci., 17, 1999–2015, https://doi.org/10.5194/nhess-17-1999-2017, 2017.
Rasà, R., Azzaro, R., and Leonardi, O.: Aseismic creep on faults and flank instability at Mount Etna volcano, Sicily, in: Volcano instability on the Earth and other planets, edited by: McGuire, W. J., Jones, A. P., and Neuberg, J., Geol. Soc. Lond. Spec. Publ., 110, 179–192, 1996.
Rovida, A., Locati, M., Camassi, R., Lolli, B., and Gasperini, P. (Eds.): CPTI15, the 2015 version of the Parametric Catalogue of Italian Earthquakes, Istituto Nazionale di Geofisica e Vul-canologia, https://doi.org/10.6092/INGV.IT-CPTI15, 2016. Saraò, A., Cocina, O., Moratto, L., and Scarfì, L.: Earthquake
features through the seismic moment tensor, in: Project V3: multi-disciplinary analysis of the relationships between tectonic structures and volcanic activity (Etna, Vulcano-Lipari system), Final Report, edited by: Azzaro, R. and De Rosa, R., Mis-cellanea INGV, 29, 98–101, https://sites.google.com/a/ingv.it/ volcpro2014/ (last access: 31 October 2017), 2016.
Scarfì, L., Barberi, G., Musumeci, C., and Patanè, D.: Seismotec-tonics of northeastern Sicily and southern Calabria (Italy): new constraints on the tectonic structures featuring in a crucial sector for the central Mediterranean geodynamics, Tectonics, 35, 812– 830, https://doi.org/10.1002/2015TC004022, 2016.
Schwartz, D. P. and Coppersmith, K. J.: Fault behaviour and charac-teristic earthquake: examples from the Wasatch and San Andreas fault zones, J. Geophys. Res., 89, 5681–5698, 1984.
Sicali, S., Barbano, M. S., D’Amico, S., and Azzaro R.: Character-ization of seismicity at Mt. Etna volcano (Italy) by inter-event time distribution, J. Volcanol. Geoth. Res., 270, 1–9, 2014. Sicali, S., Barberi, G., Cocina, O., Musumeci, C., and Patanè, D.:
Volcanic unrest leading to the July–August 2001 lateral eruption at Mt. Etna: seismological constraints, J. Volcanol. Geoth. Res., 304, 11–23, 2015.
Solaro, G., Acocella, V., Pepe, S., Ruch, J., Neri, M., and Sansosti, E.: Anatomy of an unstable volcano from InSAR: multiple processes affecting flank instability at Mt. Etna, 1994–2008, J. Geophys. Res., 115, B10405, https://doi.org/10.1029/2009JB000820, 2010.
Stirling, M., Godet, T., Berryman, K., and Litchfield, N.: Selection of earthquake scaling relationships for seismic-hazard analysis, Bull. Seismol. Soc. Am., 103, 2993–3011, 2013.
Stucchi, M., Meletti, C., Montaldo, V., Crowley, H., Calvi, G. M., and Boschi, E.: Seismic Hazard Assessment (2003–2009) for the Italian Building Code, Bull. Seismol. Soc. Am., 101, 1885–1911, 2011.
Traversa, P. and Grasso, J. R.: How is volcano seismicity different from tectonic seismicity?, Bull. Seismol. Soc. Am., 100, 1755– 1769, 2010.
Tuvè, T., D’Amico, S., and Giampiccolo, E.: A new MD–ML re-lationship for Mt. Etna earthquakes (Italy), Ann. Geophys., 58, S0657, 2015.
Villamor, P., Berryman, R. K. R., Webb, T., Stirling, M., McGinty, P., Downes, G., Harris, J., and Litchfield, N.: Waikato Seismic Loads: revision of Seismic Source Characterisation, Client Re-port 59, Institute of Geological and Nuclear Sciences, GNS Sci-ence, Lower Hutt, New Zealand, 109 pp., 2001.
Wells, D. L. and Coppersmith, K. J.: New empirical relationships among magnitude, rupture length, rupture area, and surface dis-placement, Bull. Seismol. Soc. Am., 84, 974–1002, 1994. Wesnousky, S. G.: Displacement and geometrical characteristics of
earthquake surface ruptures: issues and implications for seismic-hazard analysis and the process of earthquake rupture, Bull. Seis-mol. Soc. Am., 98, 1609–1632, 2008.
Wiemer, S.: A software package to analyze seismicity: ZMAP, Seis-mol. Res. Lett., 72, 374–383, 2001.
Wiemer, S. and Wyss, M.: Mapping spatial variability of the frequency-magnitude distribution of earthquakes, Adv. Geo-phys., 45, 259–302, 2002.
Woessner, J., Danciu, L., Giardini, D. Crowley, H., Cotton, F., Grünthal, G., Valensise, G., Arvidsson, R., Basili, R., Demircioglu, M. N., Hiemer, S., Meletti, C., Musson, R. W., Rovida, A. N., Sesetyan, K., Stucchi, M., and the SHARE consortium: The 2013 European Seismic Hazard Model: key components and results, Bull. Earthq. Eng., 13, 3553–3596, https://doi.org/10.1007/s10518-015-9795-1, 2015.
Zhang, H., Thurber, C., and Bedrosian, P.: Joint inversion for Vp, Vs,
and Vp/Vsat SAFOD, Parkfield, California, Geochem. Geophy. Geosy., 10, Q110032, https://doi.org/10.1029/2009GC002709, 2009.
Zöller, G., Hainzl, S., and Holschneider, M.: Recurrent large earth-quakes in a fault region: what can be inferred from small and intermediate events?, Bull. Seismol. Soc. Am., 98, 2641–2651, https://doi.org/10.1785/0120080146, 2008.