http://dx.doi.org/10.1351/PAC-CON-11-09-30
© 2012 IUPAC, Publication date (Web): 16 January 2012
A fully validated method for the determination
of arsenic species in rice and infant cereal
products*
Toni Llorente-Mirandes
1, Josep Calderón
2,
José Fermín López-Sánchez
1, Francesc Centrich
2, and
Roser Rubio
1,‡1Department of Analytical Chemistry, University of Barcelona, Martí i Franquès
1-11, Barcelona E-08028, Spain; 2Laboratory of the Public Health Agency of Barcelona, Chemistry, Avda. Drassanes 13-15, 08001-Barcelona, Spain
Abstract: A full validation of inorganic arsenic (iAs), methylarsonic acid (MA), and
dimethyl arsinic acid (DMA) in several types of rice and rice-based infant cereals is reported. The analytical method was developed and validated in two laboratories. The extraction of the As species was performed using nitric acid 0.2 % and hydrogen peroxide 1 %, and the cou-pled system liquid chromatography-inductively coucou-pled plasma-mass spectrometry (LC-ICP-MS) was used for speciation measurements. Detection limit (DL), quantification limit, linearity, precision, trueness, accuracy, selectivity, as well as expanded uncertainty for iAs, MA, and DMA were established. The certified reference materials (CRMs) (NMIJ 7503a, NCS ZC73008, NIST SRM 1568a) were used to check the accuracy. The method was shown to be satisfactory in two proficiency tests (PTs). The broad applicability of the method is shown from the results of analysis of 29 samples including several types of rice, rice
prod-ucts, and infant cereal products. Total As ranged from 40.1 to 323.7 μg As kg–1. From the
speciation results, iAs was predominant, and DMA was detected in some samples while MA was not detected in any sample.
Keywords: arsenic speciation; chemical speciation; food chemistry; infant cereals; inorganic
arsenic; liquid chromatography-inductively coupled plasma-mass spectrometry (LC-ICP-MS); method validation; rice.
INTRODUCTION
Rice is the main food for over half of the world’s population owing to its nutritive properties and its rel-atively low cost. It is estimated that in many countries rice may contribute up to 50 % of the daily intake of protein, and in Asian countries it is a staple food. Moreover, rice is also extensively produced and consumed in Europe and in the United States [1,2]. From the point of view of health, rice is of interest because many types may contain higher contents of As than other food of terrestrial origin. Thus, it could be considered an important contributor to total As intake in many parts of the world where the diet is mainly rice-based [3–7]. Furthermore, it is estimated that the As content of rice is over 10 times
*Pure Appl. Chem. 84, 169–333 (2012). A collection of invited papers based on presentations at the 4thInternational IUPAC Symposium on Trace Elements in Food (TEF-4), Aberdeen, UK, 19–22 June 2011.
greater than that found in other cereals [8,9]. Rice may thus be an important exposure route for As, a non-threshold class1 human carcinogen [10], which underlines the importance of fundamental studies on rice consumption data and calculation of estimated daily intake (EDI) of inorganic arsenic (iAs), to protect consumer health [11,12].
The origin and forms of As present in rice have been studied in depth, and it is concluded that the inorganic forms, arsenite and arsenate, along with dimethylarsinic acid (DMA) are the main species, among which the inorganic forms predominate. But the relative amount of iAs compared with the total As content varies substantially from one cultivation zone to another [4,13–15]. The species-dependent differences in toxicity must be considered when establishing maximum tolerated levels in food direc-tives. Currently, no such levels have been fixed for iAs in European legislation, probably due to a lack of fully validated, standardized analytical methods and reference materials for this measurand [16]. Aware of this situation, the EFSA (European Food Safety Authority) included rice among the foods that most contribute to iAs exposure and pointed out the need to produce speciation data for different food commodities to estimate the health risk associated with dietary As exposure [17]. Moreover, it has recently been reported that rice-based food products intended for infants contain concentrations of iAs
that are above the Chinese regulatory limit (0.15 mg As kg–1) [18]. Several analytical methods have
been proposed for the determination of As species in rice [2,19–22], and current interest is focused on the availability of robust methodologies that allow us to distinguish between total As and iAs in rice samples [4,6,23,24]. The establishment of such methods is of paramount importance, in order to press for legislation to establish guideline levels for iAs for food in general, as has recently been stressed [25]. The European Union Reference Laboratory for Heavy Metals in Feed and Food (EU-RL-HM) promotes the evaluation of the performance of European laboratories in relation to analytical methods for iAs, through proficiency tests (PTs) in the International Measurement Evaluation Program (IMEP). After evaluation of the results from the PT IMEP-107 it was shown that the determination of iAs in rice is not method-dependent, since good agreement was obtained from different laboratories participating with their own analytical method. It was concluded that the introduction of a maximum level for iAs in rice should not be postponed for analytical reasons [26]. Thus, analytical laboratories of food control should now be ready to determine iAs in food (mainly rice), so they will need suitable and robust methods for oncoming legislation. The use of validated methods, a requirement of the ISO-UNE-EN 17025 [27] standard, is mandatory for analytical laboratories working on food control.
The present study reports the full validation of an analytical method for the determination of iAs, MA, and DMA in rice and rice products, performed in two laboratories: (A) the Department of Analytical Chemistry of the University of Barcelona and (B) the Public Health Agency of Barcelona, under different instrumental and operating conditions. The applicability was also assessed by applying the validated method to 29 samples of rice and rice-based baby cereals.
MATERIALS AND METHODS Reagents and standards
Analytical-grade reagents were used throughout the study.
All solutions in both laboratories were prepared with doubly deionized water obtained from
Millipore water purification systems (Elix & Rios) (18.2 MΩ cm−1resistivity and total organic carbon
<30 μg L–1). All the stock solutions were kept at 4 °C, and further diluted solutions for the analysis
were prepared daily.
Details of specific reagents and standards of both laboratories can be found in the Supplementary Material.
Instruments and apparatus
A microwave digestion system, Milestone Ethos Touch Control, with a microwave power of 1000 W and temperature control was used. Table SM-1 summarizes the chromatographic systems and operating conditions used in the study. In both cases, the outlet of the liquid chromatography (LC) column was connected via polyetherether ketone (PEEK) capillary tubing to the nebulizer of the inductively coupled plasma-mass spectrometry (ICP-MS) system, which was the As-selective detector. The ion intensity at
m/z 75 (75As) was monitored using time-resolved analysis software. Additionally, the ion intensities at
m/z 77 (40Ar37Cl and 77Se) were monitored to detect possible argon chloride (40Ar35Cl) interference at
m/z 75.
Samples and sample pretreatment
For the applicability study, 29 rice products, which are representative of all types of rice and rice-based baby food consumed in Spain, were purchased from local supermarkets and health food shops in Barcelona, Spain, during February 2011. All samples were of different brands and origin. Some of them were typical rice products that are widely available in supermarkets (e.g., rice crackers, white rice, or rice-based infant cereals) whilst others are more specialized foods (e.g., rice noodles, basmati rice, sushi rice, or jasmine rice). Rice samples were ground to a fine powder in a commercial coffee mill (Moulinex, Vidrafoc). Powdered samples were placed in plastic containers and stored in the refrigera-tor at –4 °C until analysis. Rice certified reference materials (CRMs) were SRM 1568a Rice Flour, obtained by NIST (Gaithersburg, MD, USA); NMIJ CRM 7503a White Rice Flour, obtained by NMIJ (Japan), and NCS ZC73008 Rice, obtained by NCS (Beijing, China).
Procedures
Moisture determination
Moisture was determined gravimetrically. Aliquots of 0.5 g samples were dried, in triplicate, at 102 °C to constant weight in an oven with natural convection. Moisture ranged from 4 to 14 %, and all further results refer to dry mass.
Total arsenic analysis
The total As content of the samples and the CRMs was determined in triplicate by ICP-MS measure-ment after microwave digestion, as follows: 0.5 g aliquots of the samples or the CRMs were weighed in the digestion vessels, and 8 mL of nitric acid solution (diluted 1:1 with doubly deionized water) and 2 mL of hydrogen peroxide was added. The mixtures were digested from room temperature ramped to 190 °C in 45 min. After cooling to room temperature, the digested samples were diluted in water up to 20 mL. For the final measurements, further dilution was carried out when necessary. He gas was used
in the collision cell to remove interferences in the ICP-MS measurements. 103Rh was used as the
inter-nal standard. The samples were quantified by means of an exterinter-nal calibration curve from arsenate stan-dards. For quality control purposes, the standards of the calibration curve were run before and after each sample series. The corresponding digestion blanks (one for each sample digestion series) were also measured. Quality control standard solutions at two concentrations levels were measured after every 10 samples.
Arsenic speciation analysis
As speciation was carried out on the extracts by LC-ICP-MS. The extraction procedure of As species is based on the study of [28] with slight modifications. For speciation analysis, 0.25 g aliquots of the powdered rice products were weighed in the digestion vessels and then extracted by adding 10 mL of 0.2 % (w/v) nitric acid and 1 % (w/v) hydrogen peroxide solution in a microwave digestion system. The temperature was raised to 95 °C in 45 min. Samples were cooled to room temperature and centrifuged
at 3000 rpm for 12 min. The supernatant was filtered through PET filters (pore size 0.45 μm). The extracts were kept at 4 °C until analysis (up to 24 h). Total As was determined in the extracts by ICP-MS (as described above) and As speciation was carried out on the extracts by LC-ICP-ICP-MS using a method previously applied to marine algae [29] (see Table SM-1) for operating conditions. As species in the chromatograms were identified by comparison of the retention times with those of the standards. External calibration curves were used to quantify MA, DMA, arsenite, and arsenate against the corre-sponding standards. Extraction blanks were also analyzed by LC-ICP-MS in each session. Quality con-trol standard solutions at two concentrations levels were measured in each speciation run.
VALIDATION STUDY FOR iAs, DMA, AND MA DETERMINATION
The parameters of the method developed for the determination of As species in rice were calculated as specified elsewhere [30]. The following parameters were established to evaluate the method: detection limit (DL), quantification limit, linearity, precision (repeatability and intermediate precision), accuracy, trueness, selectivity, expanded uncertainty and applicability were assessed for iAs, MA, and DMA using spiked samples of rice and infant cereals at various concentrations.
Assessment of the quantification of inorganic arsenic
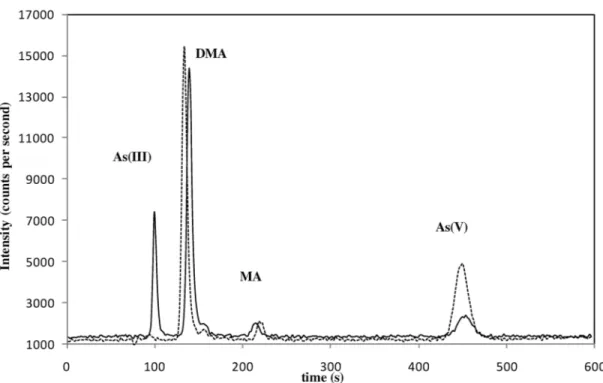
One of the goals of this study is to validate a method for the quantification of iAs in samples of rice foodstuffs. When using a LC as chromatographic system for As speciation with a strong anionic exchange column (Hamilton PRP-X100) and a mobile phase of ammonium phosphate, As(III) could elute near the void volume, and it could co-elute with other cationic species potentially present in rice [31]. So one possible strategy for a routine analytical approach is to quantify the iAs as arsenate, by using an oxidizing agent as extractant [25]. The extraction method used in the present study caused complete oxidation of As(III) to As(V), so we quantified iAs as As(V) and it was not necessary to quan-tify two peaks, so errors were minimized. During the recovery study, which was performed by spiking experiments with standards [As(III), DMA, MA, and As(V)] the recovery of DMA and MA was satis-factory (see Table SM-2). As(V) appeared as the only inorganic species showing the quantitative oxi-dation of As(III), and good recoveries of iAs were found. This behavior is illustrated in Fig. 1, which
shows differences in the chromatograms with and without addition of H2O2in the extracting agent. As
in the spiked samples, As(III) was also quantitatively oxidized to As(V) in the rice-based CRMs (see
Table 1). NMIJ 7503a rice is certified in As species: As(III) = 71.1 μg As kg–1, As(V) = 13.0 μg
As kg–1, and DMA = 13.3 μg As kg–1. The value found was 84.9 μg As kg–1of iAs, as As(V) form,
which is in agreement with the sum of arsenite and arsenate in the CRM (84.1 μg As kg–1). For the
NIST SRM, 104 μg As kg–1of iAs, quantified as As(V), were obtained, which is consistent with the
literature data [28,32–35]. According to [32], in a similar extraction method (diluted HNO3extraction)
applied to similar matrices only 0.5 % of added As(III) remained unchanged. It has also been reported
that preservation of As(III) and As(V) speciation during HNO3extraction of rice grains occurs at a
Validation parameters
Linearity
Linearity of the method was evaluated by analyzing six working standard solutions in triplicate for each As species [As(III), As(V), DMA, and MA]. Linearity was determined by the calculation of the
regres-sion line using the method of least squares, and it is expressed by the correlation coefficient (R2).
Linearity was validated through three analytical runs on three different days. The acceptance criterion
was R2≥ 0.9990 for every calibration. As recommended [30], the residuals errors (difference between
nominal and observed concentration) at each calibration point were checked, accepting a residual error
≤15 % for the lowest calibration level and ≤10 % for the higher ones. External calibration range for
DMA and MA was (0.25–10.0 μg As L–1). External calibration range for iAs was (0.50–10.0 μg
As L–1). These standards concentration ranges covered the usual concentrations of the studied As
species in all analyzed food samples.
Detection limit and quantification limit
For most modern analytical methods, the DL may be divided into two components, instrumental detec-tion limit (IDL) and method detecdetec-tion limit (MDL) [36].
In the validation study, IDL and instrumental quantification limit (IQL) were calculated for iAs,
DMA, MA, on the SD of y-intercepts of regression analysis (σ) and the slope (S) of the standard curves,
using the following equation IDL = 3 σ/S. IQLs were calculated from the equation IQL = 10 σ/S.
Similar IDLs and IQLs were obtained for both laboratories. The IDLs for DMA, MA, and iAs were
0.03, 0.04, and 0.06 μg As L–1, respectively. The IQLs for DMA, MA, and iAs were 0.12, 0.14, and
0.20 μg As L–1, respectively.
According to [37], method quantification limit (MQL) is the lowest concentration that can be reli-able achieved within specified limits of precision and accuracy during routine laboratory operating
con-Fig. 1 Chromatograms of NIST SRM 1568a extracts from anion exchange by LC–ICP–MS, continuous line:
T a ble 1 Accurac y assessment. Concentrations e xpressed as µg As kg –1
on dry mass (mean ± SD,
n
= 3) for total As and As species in rice CRMs.
Certif ied reference T o tal As T o tal DMA MA iAs iAs Sum E xtraction Column material ex tracted (%) a of As ef ficienc y reco v ery As species (%) (%) NCS ZC73008 Rice Laboratory A 105.1 ± 5.8 100.3 ± 6.2 19.0 ± 0.3 <MDL 79.8 ± 3.4 80.7 98.8 95.4 98.5 Laboratory B – – 19.2 ± 0.7 <MQL 83.6 ± 1.2 81.3 102.8 – – Certif ied v alue 102 ± 8
NIST SRM 1568a Rice
Laboratory A 287.8 ± 4.5 286.1 ± 3.8 168.0 ± 2.2 13.6 ± 2.5 104.3 ± 4.4 36.5 285.9 99.4 99.9 Laboratory B 275 ± 15 – 179.5 ± 5.2 13.2 ± 0.2 105.2 ± 1.6 35.3 297.9 – – Certif ied v alue 290 ± 30
NMIJ CRM 7503-a Rice
Laboratory A 97.6 ± 4.7 96.8 ± 4.1 11.7 ± 1.9 <MDL 84.9 ± 0.7 87.8 96.6 99.2 99.8 Laboratory B – – – – – – – – – Certif ied v alue 98 ± 7 13.3 ± 0.9 84.10 b aiAs di
vided by sum of As species.
bNMIJ 7503a rice is certif
ied in As species: As(III) = 71.1
μ g As kg –1 and As(V) = 13.0 μ g As kg –1 so the v
alue for iAs is 84.10
μ
g As kg
–1
ditions. In order to assess the MQL of As species in the samples we fortified three different samples at
a concentration close to the lowest concentration of the standard calibration curves (10 μg As kg–1for
DMA and MA and 20 μg As kg–1for iAs), on three different days and processed through the entire
ana-lytical method. Below such concentrations, the values obtained for precision and accuracy could not reach the specified limits established for routine laboratory operating conditions. We assume that the lowest limit validated could be equivalent as the MQL for the three As species. MDLs were calculated
from the equation MDL = 3 MQL/10. The MDLs for DMA, MA, and iAs were 3, 3, and 6 μg As kg–1,
respectively. The values obtained for MQL and MDL were suitable for determining the As species at the low levels found in the samples studied.
Precision
Precision was assessed as within-day repeatability and as between-day intermediate precision [38]. In both cases, spiking experiments were carried out by adding As(III), As(V), DMA, and MA standards to solid samples and homogenized. The mixtures were then left to stand for 30 min before extraction. Unspiked samples were also analyzed in triplicate in order to calculate the spike recovery. Precision, expressed in terms of relative standard deviation (% RSD) of As recovery, was assessed by analyzing
spiked rice samples at three concentration levels in triplicate: low (10 μg kg–1corresponding to MQL),
medium (50 μg kg–1), and high (200 μg kg–1) (Table SM-2). To evaluate the between-day precision
(intermediate precision) various factors were changed: three different analysis days over three weeks, different analysts and different standards for spiking. For within-day repeatability, six samples for each spiking level were analyzed within a day. The precision acceptance criterion [39,40] matches the 2/3
Horwitz function [41], which was: 14.7 % for values ≤ 100 μg kg–1, 13.6 % RSD for 200 μg kg–1, and
12.2 % RSD for 400 μg kg–1. The between-day (intermediate precision) and within-day (repeatability)
precisions (expressed in terms of % RSD) calculated for both laboratories ranged from 1.7 to 7.0 % and from 0.8 to 5.0 %, respectively. Good precision was obtained in all cases, and the results obtained are consistent with the precision acceptance criteria. All details of precision of both laboratories can be found in the Supplementary Material, Table SM-2.
Trueness
The same spiked samples analyzed to evaluate precision of the method were also used for evaluation of the trueness, which is expressed in terms of recovery, according to [30]. As commented above, no added As(III) was found in spiked extracts, so we calculated iAs recoveries assuming that all of the As(III) was oxidized to As(V). Recoveries were calculated as follows: recovery (%) = (a-b)*100/c, where a is the As concentration measured in the extracts of samples which were spiked with standards solutions;
b is the As concentration measured in the unspiked sample and c was the known concentration added
to the sample. The between-day and within-day recoveries for both laboratories were in the range 97.0–104.2 % and 98.0–103.0 %, respectively. More information about recoveries of both laboratories can be found in Table SM-2. For assessing trueness, our acceptance criteria for recovery validation is 85–115 %. The recoveries for both laboratories were satisfactory compared to acceptance criteria set by
CODEX [42]: (60–115 % for 10 μg kg–1and 80–110 % for 0.1–10 mg kg–1). The results of two
labo-ratories indicated excellent trueness of the proposed method.
Accuracy
To evaluate the accuracy of the procedure applied, CRMs were analyzed. Rice CRMs (NMIJ 7503a, NCS ZC73008, and NIST SRM 1568a) were used throughout the study (Table 1). NMIJ 7503a rice is certified in total As and also in As species: the present results showed good agreement with the
certi-fied values. SRM NIST 1568a rice is certicerti-fied for total As: 290 μg As kg–1. Although the concentration
of As species is not certified, our results showed good agreement with other reported results on As species on this material [28,32–35]. NCS ZC73008 rice is certified for total As but not for As species. As speciation results on this CRM are not found in the literature. In the present study, the sum of the
Expanded uncertainty
The relative expanded uncertainty was calculated in order to complete the validation study. Although this parameter is important in the evaluation of the results of toxic substances in food control, it is rarely described in the literature [26]. Relative expanded uncertainty was estimated by a top-down method, adapted from [43].
in which Rec is the average recovery of all spiked concentration levels, RSDRecis the relative standard
deviation of Rec values, n is the number of replicates made in the validation and k is the coverage fac-tor 2. The results for each species and each spiked level are shown in Table SM-2. The results of the relative expanded uncertainty range from 3.6 to 14.8 % for both laboratories for all species in the three
spiked levels. The acceptable criteria are: Umax< 2 * RSD (according to [41,44]). The results obtained
of U(%) agree with this criterion.
Selectivity
A blank sample (0.2 % HNO3and 1 % H2O2solution) was analyzed by LC-ICP-MS in each session,
and no signal was observed at the retention times of the As species studied. Therefore, reagents in the blank did not induce interferences in the chromatograms. The presence of a high content of chloride
(Cl–) in the matrices could lead to the misidentification of As with ICP-MS detection [45]. As
com-mented above, the ion intensity at m/z 75 (75As) was monitored and additionally, the ion intensities at
m/z 77 (40Ar37Cl and 77Se) and m/z 35 (35Cl) were monitored to detect possible argon chloride
(40Ar35Cl) interference at m/z 75. A blank sample (MilliQ-water) spiked at 50 mg L–1with Cl standard
solution was analyzed to check the possible interference with As(V), and no signal was observed at the
retention time of As(V). The (40Ar35Cl) peak eluted at 7.92 min, whereas As(V) eluted at 6.0 min. The
selectivity of the method regarding the (40Ar35Cl) interference for the As species studied was verified.
External quality control
The method accuracy was assessed with participations in PTs. Laboratory A participated as an expert laboratory in the IMEP-107: Total and iAs in rice [26,46]. Laboratory B participated in a PT of the Central Science Laboratory-Food Analysis Performance Assessment Scheme (CSL-FAPAS), in the determination of total and inorganic As in rice, with good results.
Applicability
In order to assess the wide applicability of the method, it was applied to 29 samples.
TOTAL ARSENIC
The results are shown in Table 2, and total As in all the samples ranged from 40.1 to 323.7 μg As kg–1.
The mean As concentration from all rice and rice products (n = 20, excluding baby food) was 169.5 μg
As kg–1. The results for total As are similar to others reported in the literature [20,28,33,47] and show
that, compared with other cereals (wheat, barley, and maize), rice accumulates much higher levels of As [8,9]. With respect to infant products, some studies reported that rice-based baby food contains high
concentrations of total As [18,48]; our results are in agreement, and ranged from 40.1 to 309.5 μg
As kg–1. As shown in Table 2, among the products labeled as “infant cereals”, the rice-based products
contained higher As concentrations than other infant cereals (multicereals). Total As was determined in three CRMs to assess the accuracy and for mass balance purposes. The results are shown in Table 1.
The instrumental detection and quantification limits were calculated as 3 times the signal (3σ) and 10
times the signal (10σ) of 10 digestion blanks, respectively, and the results obtained are: 7.3 and
dif-T
a
ble 2
Concentrations of total As and As species in rice and inf
ant cereals e
xpressed as
μ
g As kg
–1
on dry mass (mean ± SD,
n = 3). Rice product Color Grain type T o tal As T o tal DMA MA iAs iAs (%) a Sum of As Extraction Column ex tracted species ef ficienc y reco v ery As (%) (%) Rice White Medium 173.2 ± 9.9 166.2 ± 8.0 b 57.3 ± 0.7 <MDL 112.9 ± 8.2 66.3 170.1 96.0 102.4 Rice White Long 156.5 ± 7.1 156.2 ± 4.4 b 45.1 ± 3.2 <MDL 108 ± 0.5 70.5 153.1 99.9 98.0 Rice White Medium 184.9 ± 8.7 165.3 ± 2.0 b 58.6 ± 1.9 <MDL 109.2 ± 2.7 65.1 167.7 89.4 101.5 Rice White Medium 186.1 ± 3.8 173.2 ± 0.7 b 55.1 ± 0.4 <MDL 117.6 ± 3.3 68.1 172.7 93.0 99.8 Rice White Medium 193.4 ± 3.8 193.6 ± 8.0 b 68.4 ± 1.6 <MDL 116.8 ± 5.4 63.1 185.3 100.1 95.7 Rice White Basmati 90.9 ± 2.3 86.6 ± 6.3 25.7 ± 1.3 <MDL 53.1 ± 1.8 67.4 78.8 95.2 91.0 Rice White Sushi 143.4 ± 2.7 129.2 ± 11.8 41.0 ± 1.0 <MDL 85.6 ± 3.2 67.6 126.6 90.1 97.9 Rice White Bomba 174.0 ± 2.6 161.4 ± 8.4 80.6 ± 4.9 <MDL 71.9 ± 2.8 47.2 152.5 92.8 94.5 Rice crack ers White Original 86.3 ± 4.8 80.7 ± 4.5 36.6 ± 2.3 <MDL 42.5 ± 3.2 53.7 79.1 93.5 98.0 crack ers Rice crack ers White Sesame 79.7 ± 5.4 77.9 ± 3.4 44.4 ± 3.9 <MDL 34.4 ± 5.8 43.7 78.9 97.7 101.2 crack ers Rice noodles n.s. c Rice noodles 104.6 ± 2.7 102.1 ± 2.6 21.4 ± 2.3 <MDL 82.5 ± 3.5 79.4 103.8 97.7 101.7 Rice Bro w n W hole long 151.1 ± 5.3 129.1 ± 18.6 17.6 ± 0.8 <MDL 109.0 ± 5.1 86.1 126.6 85.5 98.1 grain Rice Bro w n B asmati 170.5 ± 5.6 147.0 ± 12.7 16.4 ± 1.6 <MDL 129.0 ± 2.5 88.7 145.3 86.2 98.9 Rice Bro w n Jasmine 234.4 ± 7.2 223.9 ± 11.3 39.3 ± 2.9 <MDL 182.8 ± 9.4 82.3 222.0 95.5 99.2 Rice Bro w n W hole medium 323.7 ± 25.2 281.6 ± 6.2 49.7 ± 0.9 <MDL 238.9 ± 8.5 82.8 288.6 87.0 102.5 grain Rice crack ers Bro w n C rack ers 261.7 ± 11.1 213.0 ± 7.8 51.2 ± 3.4 <MDL 160.1 ± 5.0 75.8 211.2 81.4 99.2 Rice crack ers Bro w n C rack ers 252.0 ± 2.8 242.5 ± 4.7 52.0 ± 5.2 <MDL 189.8 ± 6.6 78.5 241.7 96.2 99.7 Rice Red L ong 160.6 ± 6.8 160.6 ± 6.8 19.1 ± 1.9 <MDL 125.4 ± 8.2 86.8 144.5 99.8 90.2 Mixture of Mixture M ixture of 180.0 ± 19.4 153.9 ± 11.1 22.8 ± 0.2 <MDL 126.5 ± 9.4 84.7 149.4 85.5 97.1 wild rice
whole-grain basmati, red and black rice
Rice Black Medium 83.3 ± 9.4 73.9 ± 15.4 22.1 ± 0.5 <MDL 49.9 ± 1.4 69.3 72.1 88.7 97.5 Inf ant cereal n.s. c Multigrain 46.3 ± 3.4 46.6 ± 7.5 21.0 ± 2.0 <MDL 24.2 ± 0.6 53.5 45.2 100.5 97.0 Inf ant cereal n.s. c Multigrain 40.1 ± 5.4 38.3 ± 3.8 b 11.9 ± 1.4 <MDL 26.3 ± 1.2 68.9 38.2 95.4 99.9 with fruits (continues on ne xt pa g e)
Inf ant cereal Bro w n O rg anic 231.7 ± 9.5 237.9 ± 1.0 30.0 ± 1.3 <MDL 200.0 ± 5.0 87.0 230.0 102.7 96.7 whole-wheat rice Inf ant cereal n.s. c 100 % rice 309.5 ± 11.2 312.2 ± 2.0 182.6 ± 5.0 <MQL 128.0 ± 3.4 41.2 310.6 100.9 99.5 Inf ant cereal n.s. c Rice based 94.5 ± 2.0 91.7 ± 7.0 19.0 ± 1.1 <MDL 67.7 ± 1.0 78.0 86.7 97.0 94.6 Inf ant cereal n.s. c Rice based 80.5 ± 10.5 78.1 ± 2.9 12.8 ± 1.0 <MDL 63.6 ± 1.6 83.3 76.3 97.0 97.8 Inf ant cereal n.s. c Rice based 42.6 ± 6.5 39.8 ± 4.8 11.1 ± 1.2 <MDL 29.6 ± 0.4 72.7 40.7 93.5 102.2 with fruits Inf ant cereal n.s. c Cereals without 64.2 ± 3.9 55.4 ± 6.8 b 12.8 ± 0.6 <MDL 43.7 ± 0.3 77.3 56.5 86.2 102.0 gluten Inf ant cereal n.s. c Corn based < MQL <MQL <MDL <MDL <MQL aInor ganic As di
vided by sum of As species.
bAnalyzed in duplicate (
n
= 2).
cNo specif
ic information on the type of the rice grain is a
v ailable. T a ble 2 (Continued ). Rice product Color Grain type T o tal As T o tal DMA MA iAs iAs (%) a Sum of As Extraction Column ex tracted species ef ficienc y reco v ery As (%) (%)
ferent days, n = 9) and the repeatability (six times within a day, n = 6) were assessed for the results obtained by analyzing different replicates on CRMs (Table 1). The results of RSD % are: 6.7 and 5.7 %, respectively, for NCS ZC73008 Rice; 3.0 and 2.4 %, respectively, for NIST SRM 1568a Rice Flour, and 5.2 and 4.1 %, respectively, for NMIJ CRM 7503a White Rice Flour.
ARSENIC SPECIATION
Table 2 summarizes the results of As speciation, total extracted As, total As, column recovery, tion efficiency, and the percentage of the species detected in inorganic form. In the present study, extrac-tion efficiencies (calculated as the ratio of total As in the extract to total As in the sample) are compa-rable with others reported in the literature [6]. The values ranged from 81.4 to 102.7 % and extracted
on average 93.7 %, which indicates that the HNO3/H2O2solution could be a suitable solvent for the
extraction of As species in this type of matrix.
For quality assessment, column recovery must also be established, to guarantee the correctness of the chromatographic separation. With this aim, we calculated the ratio of the sum of the species eluted from the chromatographic columns to the total As in the extract injected into the column. This param-eter, assessed in replicates with good reproducibility, allowed us to evaluate the quantification of the As species. The values obtained for column recoveries (Table 2), ranged between 90.2 and 102.5 % and showed average recoveries of 98.3 %.
Data of As speciation concentrations for rice and infant food samples are summarized in Table 2. In this study, we only found two As species, As(V) [as commented above, As(III) is oxidized to As(V) under the extraction conditions] and DMA, which are known to be the main As components of both white and brown rice [15,20,49,50]. iAs was the predominant form, ranging from 41.2 to 88.7 %, and DMA (11.3–58.85 %) was also detected. For iAs and DMA, the average percentages found in all
sam-ples were 71.0 and 29.0 %, respectively. MA was below MQL (10 μg As kg–1) in all the samples
ana-lyzed. The present results are in agreement with the literature [4,20,47] but differ from the data on U.S. rice, in which DMA is reported to dominate [4,13,20]. iAs levels in all samples ranged from 24.2 to
238.9, with an average value of 101.0 μg As kg–1. It has been shown that iAs is elevated in the bran
layer of rice, resulting in brown rice having a higher content than corresponding white rice [15]. The present results are consistent with these reports, and showed that brown rice has more iAs (75.8–88.7 %) than white rice (43.7–70.5 %), whereas in rice noodles the percentage of iAs was higher (79.4 %). No specific information on the type of the rice grain was found on the packaging of rice prod-ucts for babies, so we could not establish a relationship between rice type and iAs content. From the
results shown in Table 2, iAs concentration in infant cereals products ranged from 24.2 to 200.0 μg
As kg–1, with an average value of 72.9 μg As kg–1. Other authors reported a similar range of iAs
lev-els in rice for babies: 60 to 160 μg As kg–1[18]. In one sample of whole-grain rice, 200 μg As kg–1
was measured.
From all these results, the iAs levels in rice-based infant cereals should not be ignored and should be of concern. There are currently no EU regulations regarding As levels in foods [26]. The Chinese
standard for iAs in rice is probably the strictest in the world, with a standard limit of 150 μg As kg–1
iAs [51]. Four samples of rice and one sample of rice-based infant products examined in this study (see Table 2) exceed this limit.
Correlations have been reported between As species and total As [4,52], and it is proposed that rice may be classified into two populations, depending on the form of As in the grain: iAs-type and DMA-type [13]. According to our results, if we consider all the products listed in Table 2, iAs and also DMA concentrations increase with total As, the slope corresponding to iAs being steeper (Fig. 2).
CONCLUSIONS
From the validation study, it can be concluded that excellent trueness (% recovery) and good precision (as intermediate precision and repeatability) were obtained for both laboratories. The MQLs achieved were low enough and suitable for determining the As species at the low levels found in the samples. The results on CRMs show good agreement with the certified values, as well as with the results on As species reported in the literature. The validated method was applied successfully to 29 samples of rice and rice-based infant products, and it is currently accredited under the ISO/IEC 17025 and used for rou-tine analysis in Laboratory B, for food control purposes. From the speciation results in the samples stud-ied, iAs was the major As compound, highlighting the importance of rice as a possible source of iAs in the diet, which is especially important in rice-based infant products.
The present validated method could be a valuable tool for assessing the iAs in rice. The method can be considered straightforward enough to be applied in routine analysis, as required in food control laboratories according to the ISO/IEC 17025:2005 standard.
SUPPLEMENTARY MATERIAL
Details of specific reagents and standards of both laboratories are included in the Supplementary Material.
Table SM-1 provides LC-ICP-MS operating conditions used by both laboratories.
Table SM-2 provides validation results about precision, trueness, and expanded uncertainty (k = 2) data for As species in spiked rice and infant cereal (rice-based).
This material is available online (http://dx.doi.org/10.1351/PAC-CON-11-09-30).
ACKNOWLEDGMENTS
The authors thank DGICYT (Project No. CTQ2010-15377) and also Grup de Recerca Consolidat (Project No. SGR2009-1188) for financial help received in support of this study. The authors also thank Dr. A. Padró (SCTT Universitat de Barcelona) for his support with LC-ICP-MS measurements.
REFERENCES
1. C. Frazzoli, M. D’Amato, S. Caroli. In The Determination of Chemical Elements in Food, S. Caroli (Ed.), pp. 383–400, John Wiley, Hoboken, NJ (2007).
2. T. Narukawa, K. Chiba. J. Agric. Food Chem. 58, 8183 (2010).
3. Food and Agricultural Organization of the United Nations (Ed.). FAO Rice Information, Vol. 3, FAO, Rome (2002).
4. A. A. Meharg, P. Williams, E. Adomako, Y. Y. Lawgali, C. Deacon, A. Villada, R. J. Campbell, G. Sun, Y.-G. Zhu, J. Feldmann, A. Raab, F.-J. Zhao, R. Islam, S. Hossain, J. Yanai. Environ. Sci.
Technol. 43, 1612 (2009).
5. A.-M. Carey, K. G. Acheckel, E. Lombi, M. Newville, Y. Choi, G. J. Norton, J. M. Charnock, J. Feldmann, A. H. Proce, A. A. Meharg. Plant Physiol. 152, 309 (2010).
6. G.-X. Sun, P. N. Williams, A.-M. Carey, Y.-G. Zhu, C. Deacon, A. Raab, J. Feldmann, R. M. Islam, A. A. Meharg. Environ. Sci. Technol. 42, 7542 (2008).
7. E. Smith, A. L. Juhasz, J. Weber, R. Naidu. Sci. Total Environ. 392, 277 (2008).
8. J. M. Duxbury, G. Panaullah. FAO Water Working Paper, p. 28, Food and Agricultural Organization of the United Nations, Rome (2007).
9. P. N. Williams, A. Villada, C. Deacon, A. Raab, J. Figuerola, A. J. Green, J. Feldmann, A. A. Meharg. Environ. Sci. Technol. 41, 6854 (2007).
10. R. Stone. Science 321, 184 (2008).
11. G. Li , G. X. Sun, P. N. Williams, L. Nunes, Y. G. Zhu. Environ. Int. 37, 1219 (2011). 12. Y.-G. Zhu, P. N. Williams, A. A. Meharg. Environ. Pollut. 154, 169 (2008).
13. Y. J. Zavala, R. Gerads, H. Gürleyuk, J. Duxbury. Environ. Sci. Technol. 42, 3861 (2008). 14. D. T. Heitkemper, K. M. Kubachka, P. R. Halpin, M. N. Allen, N. V. Shockey. Food Addit.
Contam., Part B 2, 112 (2009).
15. A. A. Meharg, E. Lombi, P. N. Williams, K. G. Scheckel, J. Feldmann, A. Raab, Y. Zhu, R. Lisam.
Environ. Sci. Technol. 42, 1051 (2008).
16. I. Baer, M. Baxter, V. Devesa, D. Vélez, G. Raber, R. Rubio, T. Llorente-Mirandes, J. J. Sloth, P. Robouch, M. B. de la Calle. Food Control 22, 1928 (2011).
17. European Food Safety Authority. EFSA J. 7, 1351 (2009).
18. A. A. Meharg, G. X. Sun, P. N. Williams, E. Adomako, C. Deacon, Y. G. Zhu, J. Feldmann, A. Raab. Environ. Pollut. 152, 746 (2008).
19. J. H. Huang, G. Ilgen, P. Fecher. J. Anal. At. Spectrom. 25, 800 (2010).
20. P. N. Williams, A. H. Price, A. Raab, S. A. Hossain, J. Feldmann, A. A. Meharg. Environ. Sci.
Technol. 39, 5531 (2005).
21. E. Sanz, R. Muñoz-Olivas, C. Cámara, M. Kumar Sengupta, S. Ahamed. J. Environ. Sci. Health,
Part A 42, 1695 (2007).
22. V. Dufailly, M. Nicolas, J. Richoz-Payot, E. Poitevin. J. AOAC Int. 94, 947 (2011).
23. S. Torres-Escribano, M. Leal, D. Velez, R. Montoro. Environ. Sci. Technol. 42, 3867 (2008). 24. M. Hamano-Nagaoka, T. Nishimura, R. Matsuda, T. Maitani. J. Food Hyg. Soc. Jpn. 49, 95
(2008).
25. J. Feldmann, E. M. Krupp. Anal. Bioanal. Chem. 399, 1735 (2011).
26. M. B. de la Calle, H. Emteborg, T. P. J. Linsinger, R. Montoro, J. J. Sloth, R. Rubio, M. J. Baxter, J. Feldmann, P. Vermaercke, G. Raber. Trends Anal. Chem. 30, 641 (2011).
27. EN ISO/IEC 17025. General Requirements for the Competences of Testing and Calibration
Laboratories, International Organization for Standardization, Geneva (2005).
28. A. Raab, C. Baskaran, J. Feldmann, A. A. Meharg. J. Environ. Monit. 11, 41 (2009).
29. T. Llorente-Mirandes, M. J. Ruiz-Chancho, M. Barbero, R. Rubio, J. F. Lopez-Sanchez.
Chemosphere 81, 867 (2010).
31. H. R. Hansen, A. Raab, A. H. Price, G. D. Yongguan Zhu, G. J. Norton, J. Feldmann, A. A. Meharg. J. Environ. Monit. 13, 32 (2011).
32. M. D’Amato, F. Aureli, S. Ciardullo, A. Raggi, F. Cubadda. J. Anal. At. Spectrom. 26, 207 (2011). 33. G.-X. Sun, P. N. Williams, Y.-G. Zhu, C. Deacon, A.-M. Carey, A. Raab, J. Feldmann, A. A.
Meharg. Environ. Int. 35, 473 (2009).
34. C. Wu, Z. Ye, W. Shu, Y. Zhu, M. Wong. J. Exp. Bot. 62, 2889 (2011).
35. Y. G. Zhu, G. X. Sun, M. Lei, M. Teng, Y. X. Liu, N. C. Chen, W. L. Hong, A. M. Carey, A. A. Meharg, P. N. Williams. Environ. Sci. Technol. 42, 5008 (2008).
36. J. Corley. Handbook of Residue Analytical Methods for Agrochemicals, Vol. 1, John Wiley (2003).
37. U.S. EPA. Title 40 of the U.S. Code of Federal Regulations, Part 136 Appendix B, Office of the Federal Register National Archives and Records Administration, Washington, DC (July 1, 1993). 38. A. Menditto, M. Patriarca, B. Magnusson. Accred. Qual. Assur. 12, 45 (2007).
39. K. Deventer, P. Van Eenoo, P. Mikulcıkov, W. Van Thuyne, F. T. Delbeke. J. Chromatogr., B 828, 21 (2005).
40. O. Frys, P. Bajerova, A. Eisner, M. Mudrunkova, K. Ventura. J. Sep. Sci. 34, 2405 (2011). 41. W. Horwitz. Anal. Chem. 54, 67A (1982).
42. Codex Procedural Manual, 19thed., Codex Alimentarius Commission, Rome (2010).
43. A. Maroto, R. Boqué, J. Riu, I. Ruisánchez, M. Òdena. Anal. Bioanal. Chem. 382, 1562 (2005).
44 M. Thompson. Analyst 125, 385 (2000).
45. A. Shraim, N. C. Sekaran, C. D. Anuradha, S. Hirano. Appl. Organomet. Chem. 16, 202 (2002). 46. M. B. de la Calle, T. Lisinger, H. Emteborg, J. Charoud-Got, I. Verbist. Report of the seventh
interlaboratory comparison organized by the European Union-Reference Laboratory for Heavy Metals in Feed and Food, IMEP-107: Total and inorganic arsenic in rice, JRC European
Commission-IRMM (Institute for Reference Materials and Measurements) (2010).
47. B. L. Batista, J. M. Souza, S. S. De Souza, F. Barbosa Jr. J. Hazard. Mater. 191, 342 (2011). 48. K. Ljung, B. Palm, M. Grandér, M. Vahter. Food Chem. 127, 943 (2011).
49. P. N. Williams, M. R. Islam, E. E. Adomako, A. Raab, S. A. Hossain, Y. G. Zhu, J. Feldmann, A. A. Meharg. Environ. Sci. Technol. 40, 4903 (2006).
50. N. M. Smith, R. Lee, D. T. Heitkemper, K. D. Cafferky, A. Haque, A. K. Henderson. Sci. Total
Environ. 370, 294 (2006).
51. USDA. Foreign Agricultural Service Global Agriculture Information Network Report CH6064.
China, Peoples Republic of FAIRS Product. Specific Maximum Levels of Contaminants in Foods
(2006).