Bachelor’s Thesis
Analysis of the growth of Pinus sylvestris and Quercus petraea from their tree
rings and climatic series in northeastern Germany between 1920- 2009;
basis for understanding their growth in the next years under climate change
scenario
By
Glòria Monterrubio Coll University of Barcelona Faculty of Geography and History
1st Reviewer: Dr Ingo Heinrich
GFZ German Research Centre for Geosciences
Department 5.2 Climate Dynamics and Landscape Evolution Telegrafenberg, Haus C
14473 Potsdam, Germany
2nd reviewer: Dr Xavier Úbeda Cartañá
Mediterranean Environmental Research Group (GRAM) Department of Physical Geography and regional analysis Office 3073, 3rd floor
Montalegre 6, 08001 Barcelona, Spain
Table of Content
0. Abstract... 1
1. Introduction... 2
1.1. State of the Art... 4
1.2. Aims of the study... 5
2. Theoretical background... 6
2.1. Dendrochronology... 6
2.1.1. Principles of dendrochronology... 6
2.1.2. Tree ring growth... 6
2.1.3. Growth factors... 8
2.2. Ecology of study species... 9
2.2.1. Pinus sylvestris... 9
2.2.2. Quercus petraea... 10
3. Study area... 12
3.1. Location... 12
3.2. Climate... 13
3.3. Soil and hydrology... 14
3.4. Vegetation... 14
4. Material... 16
4.1 Meteorological data... ... 16
4.1.1 Temperature and precipitation... 16
4.1.2 Palmer Drought Severity Index... 17
4.2 Tree ring width... 18
5. Methods... 19
5.1 Crossdating quality... 19
5.2 Standardization... 21
5.3 Tree ring width and meteorological data correlations... 24
6. Results... 25
6.1. Analyses of Pinus sylvestris and Quercus petraea... 25
6.1.1. Period 1920-1949... 27
6.1.2. Period 1950-1979... 29
6.1.3. Period 1980-2009... 31
7. Discussion... 34
7.1. Regional climate projections for north and central Europe... 34
7.2. Expected reactions of Pinus sylvestris and Quercus petraea... 39
8. Conclusion... 41
9. Bibliography... 43
Fig 1. Scheme of a coniferous tree...8
Fig 2. Distribution map of Scots pine in Europe...9
Fig 3. Picture of Scots pine...10
Fig 4. Distribution map of Sessile Oak in Europe...11
Fig 5. Picture of Sessile oak...11
Fig 6. Overview of the study area Müritz-Nationalpark...12
Fig 7. Climate graph of the Serrahn area between 1961-1990...13
Fig 8. Mean temperature from 1901 to 2012 and trend line...16
Fig 9. Annual precipitation from 1901 to 2012 and trend line...17
Fig 10. PDSI for the period 1850-2010...17
Fig 11. Sessile oak and Scots pine raw TRW data ...19
Fig 12. Mean standard indices and smoothing line of Sessile oak and Pinus sylvestris………23
Fig 13. Correlations between temperature and TRW 1920-2009...………...25
Fig 14. Correlations between precipitation and TRW 1920-2009 ...……….26
Fig 15 Correlations between PDSI and TRW 1920-2009...27
Fig16. Correlations between temperature, precipitation, PDSI and TRW 1920-1949 ...28
Fig 17. Correlations between temperature, precipitation, PDSI and TRW 1950-1979...30
Fig 18. Correlations between temperature, precipitation, PDSI and TRW 1980-2009...32
Fig 19. Mean seasonal temperature and precipitation for the EUM region 1980-1999...34
Fig 20. Time series of temperature changes in December-February, June-August 1900-2100 with different RCP scenarios...35
Fig 21. Time series of precipitation changes in October-March, April-September 1900-2100 with different RCP scenarios...36
Fig. 22 Mean temperature and annual precipitation of Germany for the period 2091 to 2100 under a RCP 8.5...38
Table 1. Cofecha summary results for Sessile oak and Pinus sylvestris………20
Table 2. RBar and EPS for TRW data of Sessile oak and Pinus sylvestris ...………23
Abbreviations
TRW Tree ring width
PDSI Palmer drought severity index
RCP Representative Concentration Pathways
AR4; AR5 Fourth and fifth assessment report
IPCC International Panel on climate change
EPS Expressed population signal
List of Figures
0.Abstract
0. ABSTRACT
(English)
All trees need temperate environments and enough water availability on the soil for good growth. But what if temperatures raise more than they should and there are more drought events with less precipitation? The climate has a great influence on forest, and as the climate is changing, their ecosystems have to adapt to future situations. So as to study these influences, analyses from tree ring width of Scots pine (Pinus sylvestris) and sessile Oak (Quercus petraea) from the north eastern part of Germany have been done. Long temperature, precipitation and PDSI series from the area (1920-2009) have been analysed in correlation with the tree ring width of both species so as to see how they have grown. From their past interpretation in sub-periods, and the future climate projections, a change in the growth of this two tree species is expected; a situation that may affect socioeconomic and ecological sectors, important fields for Germany.
(Castellano)
Todos los árboles necesitan ambientes templados con suficiente agua en el suelo para un buen crecimiento. Pero, ¿qué pasaría si las temperaturas subieran más de lo que debieran y hubiese más episodios de sequía y menos precipitaciones? El clima tiene una gran influencia en los bosques, y según cambia con el tiempo sus ecosistemas se tienen que acostumbrar a las situaciones futuras. Para estudiar esta influencia, se ha analizado el crecimiento de los anillos de dos especies de árboles del noreste de Alemania: el pino silvestre (Pinus sylvestris) y del roble albar (Quercus petraea). Correlaciones de largas series de temperatura, precipitación y PDSI del área de estudio (1920-2009) y de la anchura de los anillos de los árboles han sido analizadas para comprender cómo han crecido a lo largo de éstos 90 años. A partir de la interpretación de los subperiodos y de las proyecciones futuras del clima de la región, se prevé un cambio en el crecimiento de estas dos especies; una situación que afecta a sectores socioeconómicos y ecológicos, sectores importantes para el conjunto del país.
(Català)
Tots els arbres necessiten ambients temperats amb suficient aigua al sòl per un bon creixement. Però, què passaria si les temperatures augmentessin més del que haurien i hi haguessin més episodis de sequera i menys precipitacions? El clima te una gran influència sobre els boscos, i segons canvia amb el temps, els seus ecosistemes s’han d’acostumar a les situacions futures. Per estudiar aquesta influència, s’ha analitzat el creixement dels anells de dues espècies d’arbres del nord-est d’Alemanya: el pi roig (Pinus sylvestris) i el roure de fulla gran (Quercus petraea). Correlacions de llargues sèries de temperatura, precipitació i PDSI de l’àrea d’estudi (1920-2009) i de l’amplada dels anells dels arbres han estat analitzades per comprendre millor com han crescut al llarg d’aquests 90 anys. A partir de la interpretació dels subperíodes i de les projeccions futures del clima de la regió, es preveu un canvi en el creixement d’aquestes dues espècies; una situació que afecta a sectors socioeconòmics i ecològics, sectors importants pel conjunt del país.
1.Introduction
1. INTRODUCTION
Approximately 73 % of German forests nowadays consist of mixed stands. Spruce accounts for the largest share among the tree species (28 %), followed by pine (23 %), beech trees (15 %) and oak trees (10 %). At natural conditions European beech (Fagus sylvatica) and sessile oak (Quercus petraea) would make up the majority of forests in Germany, mixed with scots pine (Pinus sylvestris). However due to forestry, large monocultures of scots pine were planted since the 18th century as they grow faster than deciduous species.
The tree species proportions depend on the specific natural features and site conditions as well as on different historic developments. Large forest zones can be found in Germany: pine trees abound in the north of Germany, deciduous trees prevail in the lower mountain ranges and coastal areas and southern Germany is rich in spruce trees.
In the Müritz National Park sessile oak, pine and beech mixed stand are of most importance, being part of World Heritage property “Primeval Beech forests of the Carpathians and Ancient Beech Forests of Germany”, but as said, if man had not uprooted forests and turned them into fields or meadows, this area would today be covered with beech forests.
Changes in the climate also have to be taken into account when controlling the forestry. It is well established from physical, ecological, and physiological studies that climate strongly influences physical and biological systems.
Warming of the climate system is unequivocal. The atmosphere and ocean have warmed, the amounts of snow and ice have diminished, sea level has risen, and the concentrations of greenhouse gases have increased. Even under an average global temperature increase limited to 2°C compared to pre-industrial times, the climate of Europe is simulated to depart
significantly in the next decades from today’s climate with severe drought events and intense meteorological events. Many terrestrial, freshwater, and marine species have shifted their geographic ranges, seasonal activities, migration patterns, abundances, and species interactions in response to ongoing climate change.
Forests are also experiencing the consequences of these changes, as many different dendrochronology studies show. Some tree species will shift due to its low drought tolerance while others will gain territories as they will adapt better to the changing situations. These situations have consequences in an ecological field but also in a socioeconomic scale.
Germany ranks among the densely wooded countries not only in Europe but on a global scale, with around 11 million hectares (one third of Germany) covered with forests. Forest-based industry plays a major role in the country, with annual sales of 170 billion Eur and almost 1,2 million employees, according to the Ministry of food, agriculture and consumer protection in 2011. The German forestry industry cluster is a key global player in the country, and they have to continue preserve it. In 1989, ex-chancellor Helmut Kohl warned in the German Parliament
1.Introduction
that “The damage to our forests is dramatic. Our forests are of inestimable importance for the water cycle, for our climate, for our health, for our recreation and for the identity of the German landscape. If we do not succeed in saving our forests, the world in which we live will be changed beyond recognition". Thus, the sector has to be aware of the changes that the forest may suffer from climate change and prepare new strategies.
The following thesis analyses the way two tree species, sessile oak and scots pine, react to the past temperatures, precipitation and drought registers and grow during the last 90 years so as to understand under which climate situation they grow better and if there have been any changes. Doing that, and basing on a determined climate scenario for the next century, the thesis will try to understand how these species could react in the future. For achieving this purpose, the thesis have been divided into three big sections:
- The first one, referring to some theoretical concepts concerning to what dendrochronology is and implies, basic ecology definitions for both tree species, and the study area (chapters 2,3) . - A second section, where the practical part of the thesis is explained. These chapters explain the materials used in the analyses and all the statistics needed for a correct use of the tree ring width and correlations (chapters 4, 5).
- The third big section expose and interpret the results of the correlations, explaining in detail the long serie correlation (1920-2009) and the sub-periods (1920-1949/1950-1979/1980-2009). The section also includes the regional climate projections for north Europe with the discussion of the correlations and the conclusions (chapters 6, 7, 8).
Finally in chapter 9 there is all the literature consulted for the thesis. In chapter 10, there is extra information and figures that provide more information the reader for a complete comprehension of what is being said in the text.
The idea of this thesis came up thanks to Dr. Ingo Heinrich, who has provided all tree rings data and has reviewed the thesis. As a personal interest in physical geography and more concrete to climatology, and as an exchange student in the Humboldt Universität zu Berlin, in October 2013 I decided to attend to a class related to paleoclimatology, where Dr. Heinrich, a specialist in dendroclimatology and paleoecology, was one of the docents. In one of those classes he talked about tree rings as a proxy for knowing how the climate of the past was, and as I was interested in this field, he decided to show me his laboratory in the German Research Centre for
Geosciences in Potsdam in order to have more idea what this field concern. The group was working in a project called TERENO-Terrestrial Environmental Observatories-, a long-term project that aims to catalogue ecological, social and economic impacts of global change at regional level in Germany.
From this visit and the help and cooperation from other students that were involved in this TERENO project came the idea of studying the impact of climate change in tree ring in a bachelor level, an interesting approach to this biogeography and ecology field.
1.Introduction
The thesis doesn’t give advices to wood industry, or policy makers, or purpose a forestry management model. It just analyses the situation until nowadays and tries to guess how it will be in the future, although we can never be sure how things, political actions, society, economy, climate...can change. There is only one thing which is surer: knowing how the past was, improves the knowledge of the present.
The past is the key to the future.
1.1 State of the art
The scientific study of dated tree rings is known as dendrochronology, a specialization that has established a dating framework for many field studies: architectural history, art-history and archaeology, but also for ecological and geographical studies of landscape history and climate reconstruction, as it is one of the fields cited in the different IPCC reports (Hughes, K., 2002). The greatest strength of dendrochronology is the capability to date tree rings to the calendar with a very high degree of confidence. This is done by replicated patterns matching of tree-ring properties, a process known as cross-dating, developed by A.E Douglass (Speer, H., 2010), who also founded the first laboratory of Tree ring Research at the University of Arizona in 1937. Thanks to this laboratory, tree ring techniques advanced faster, improving tree ring chronologies of different species. Years later, in 1974 Harold Fritts in collaboration with other scientific
established the International Tree-Ring Data Bank (ITRDB), a professional organization which provides a permanent location for the storage of well-dated, high-quality dendrochronological data from around the world (Grissino-Mayer, H., 1996).
Almost all rigorous reconstructions of past climate from tree rings have been based on ring width or maximum latewood density. However they have many other structural and chemical characteristics like variations in stable isotopes of carbon, hydrogen and oxygen or the size and wall thickness of tracheids in conifer likely to be under environmental control(Hughes, K., 2002). More than 100 years ago, tree-ring analysis was already being used to recognize and quantify forest damage caused by industrial pollution. Since then, a large number of studies have demonstrated a correlation between atmospheric concentrations of certain pollutants and reductions in increment (Cook, E., 1990). But other parameters such us changes in elevational and latitudinal treeline have also been dated and interpreted in terms of climate.
Regional and subcontinental histories of forest fire based on crossdated fire chronologies and tree-ring analyses of fire-scarred trees are also used in historical analyses. They identify and separate broad-scale climate-driven patterns of fire occurrence from local, nonclimatic features of individual sites permitting an understanding of multiple connection events in space and time (Swetnam, W.T., 2003). Moreover tree ring width have been used to study past volcanic events from temperature-sensitive sites at treeline, as they respond to volcanically-forced cooling by producing narrow ring widths (D’Arrigo, R., 2013).
1.Introduction
Despite age and management-related variation in growth, the sensitivity of a specie on a given site to environmental changes can be assessed. Both pines and oaks have been widely studied and have given great results in dendrochonologies (Hughes, K., 2002; Sanders, T., 2014). Worldwide, the longest chronologies have been established on the European continent. For oak trees it is founded in southern Germany, reaching back to 8480 BC (Haneca, K., 2009), and for conifer tree ring chronology in Eurasia it is in northern limit of Finnish Lapland, reaching back to 5634 BC (Helama, S., 2008).
Changes in the climate have large influence in tree growth, and as these areas have a high ecological and socio-economical value, it is essential that people know how these species will react in the future for a better adaptation.
1.2 Aims of the study
The main aim of this study is to assess the climate response of two common tree species
(Scots pine-Pinus sylvestris- and sessile oak-Quercus petraea-) in the north-eastern part of Germany for the next 100 years under climate change scenario.
Before this main objective can be accomplished, a better knowledge of variations of the past climate responses of these trees first needs to be achieved. For this reason, the second aim is to analyse the climate response of Scots pine and sessile oak for 30-year periods between 1920 and 2009.
In order to fulfil these two main objectives, it is essential to have good data and a suitable study area –(Müritz National Park, Neustrelitz)-. In this regard, two more basic objectives need to be completed:
- Find a reliable and long climate data series of temperature, precipitation and drought. - Find good tree-ring width data for Scots pine (Pinus sylvestris) and sessile oak (Quercus petraea).
2. Theoretical background
2. THEORETICAL BACKGROUND
In this section the theoretical basics of this thesis will be explained for a better understanding of the following explanations. Simple definitions and explanations related to dendrochronology, its principles and factors that affect tree growth, as well as the ecology of the studied species will be treated here.
2.1 Dendrochronology
The science of reconstructing past climate by use of tree rings is known as dendroclimatology, which is a branch of the more general discipline of dendrochronology (Fritts, H., 1976),“the study of the chronological sequence of annual growth rings in trees” (Stokes, M.A., 1968). It enables the researcher to relate the tree growth to the environmental factors affecting it in dependency of time (Cherubini, P., 2004). Features such as patterns of tree-ring width, wood density, biochemical elements content and other parameters store information on past growth conditions.
2.1.1 Principles of dendrochronology
There are some general and basic concepts that have to be taken into consideration when studying tree rings. A well known and generalized principle is the uniformitarian principle, which says that knowing environmental conditions that operated in the past can help with a better prediction for the environmental conditions in the future (Fritts, H., 1976).
It is also important knowing that each specie has their pattern of vegetation on the landscape that is controlled by the range of climate variables to which a specie responds, known as the
ecological amplitude (Speer, H., 2010).
The dendrochronologist must select sites that will maximize the environmental signal being investigated, and afterwards ring widths or other characteristics have to be matched following patterns so as to identify the exact year in which each tree ring was formed. This principle of
crossdating is essential in dendrochronology (Grissino-Mayer, H., 1996). Moreover, a replication of the tree core samples should be taken from the species so as to minimize the
environmental factors not being studied (Grissino-Mayer, H., 1996).
The tree growth cannot be faster than is allowed by the most limiting factors.
2.1.2 Tree ring growth
Tree rings are the end result of a complex sequence of assimilation of natural resources by the tree. A cascade of chemical reactions and cell division produces the annual ring that contains the information that will be analyzed (Speer, H., 2010).
2. Theoretical background
In all the plants, the stems always have a primary growth, which is the moment when the plant extends its length and gains sun exposure for a better photosynthesis, and the secondary growth, when the width of the plant increases providing the plant with a more robust basis and improving the transport and storage of substances in the trunk (Cabrera and González, 2007). But not all the plants have a secondary growth (Shmoop Editorial Team, 2008). Monocots, such as palms and yucca plants, don’t have a secondary growth and so they are not useful for dendrochronology (Speer, H., 2010), so only the trees with a secondary growth, which add layers of xylem are used for dating (Stokes, M.A., 1968).
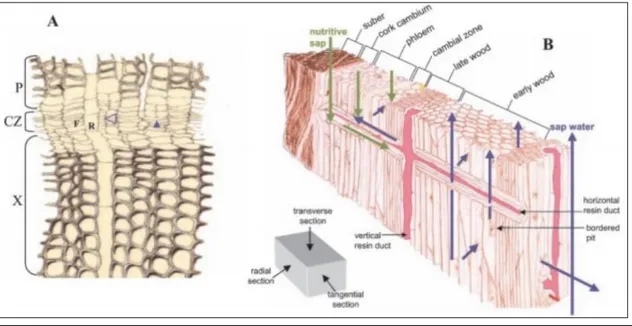
Tree rings are generated by the vascular cambium, a narrow layer with meristematic cells (tissues which contain cells capable of dividing and producing new cells that cause the plant to grow (Fritts, H., 1976)) between bark and wood. During cell division xylem is produced towards the inside of the tree, becoming (Speer, H., 2010) the water-conducting tissue which makes up the woody cylinder of a tree, and phloem is produced as a food conducting tissue in the bark (Fritts, H., 1976). Xylem mother cells always divide more compared with phloem mother cells, which explains the considerable disproportion existing between phloem and xylem tissues (Plomion, C., 2001) (Fig.1). Their added layers account for the radial growth of the tree (Stokes, M.A., 1968).
Gymnosperms (softwood trees or conifers) produce simple wood structure than Angiosperms (hardwood or deciduous trees) (Speer, H., 2010).
Gymnosperms transport water from the roots to the leaves through tracheids, long narrow cells that comprise growth rings, in the outer part of the xylem. They succumb to functional cell immediately after the cell wall thickening is finished (Plomion, et al., 2001). These wood cells are stretched longitudinally and compressed tangentially, producing a compression between the cells responsible for the stability of a trunk (Plomion, C., 2001). These cells also form a
connected column that transports nutrients along with water passively from the roots toward the shoots by the transpiration throughout the stomata in the leaves of the tree. Conifers also have some resin ducts that transport resin throughout the tree to seal off wounds (Speer, H., 2010). Angiosperms (hardwood or deciduous trees) transport the water and nutrients with specialized cells called vessels (Speer, H., 2010), and possess longitudinal parenchyma and ray
parenchyma cells that stay alive and assist as channel for the descending nutritive sap (Plomion, C., 2001).
As long as the cells in the wood tissue are still alive, the wood is called sapwood, the outer light-coloured portion of the stem, but after several years those cells die and became darker. This innermost zone of a tree is called the heartwood (HW) (Fritts, H., 1976).
2. Theoretical background
In temperate areas with a differentiation between summer and winter the tree ring can be divided into earlywood or latewood. The earlywood, or springwood has wider and larger tracheids, with thinner walls and it is lighter; while the latewood or summerwood has flattened and narrowed tracheids wtih thicker walls and a darker colour (Fritts, H., 1976). This cycle of growth in the spring and less development in the winter, repeats every year and is that what forms the annual tree rings (Shmoop Editorial Team, 2008).
2.1.3 Growth factors
The growth of a tree is determined by endogenous factors, which basically are genetic and physiological processes, and exogenous or environmental factors included in the general site conditions of the pedosphere, hydrosphere and atmosphere, such as light (quality and quantity), relative humidity, precipitation, temperature (Coder, K., 1999), wind, nutrients, root space, type of soil and pollution (Schweingruber, F., 1996). Among all these factors, temperature and precipitation are the most important ones for the tree development.
Temperature is a major limiting factor of tree growth (Schweingruber, F., 1988). Extreme temperature changes and late frosts and winter frosts are the most influential and damaging situations for a tree development. Tree ring are very narrow in stands along northern timberlines and large in warm, moist subtropical regions (Schweingruber, F., 1996). Depending on the geographical location and altitude has a significant impact on all metabolic functions and influences their seasonal development (Fowells, H. A., 1990). Topographic irregularities influence the length of the vegetative period, the duration of the snow cover and the soil temperature, having a great impact on the plant physiology, and in special the processes which take place in the water-conducting sapwood area and in the dividing tissue. But plants can also
Fig 1.A Drawing of a transverse section of the cambial zone (CZ) of maritime pine (Pinus pinaster) showing the disproportion existing
between phloem (P) and xylem (X) tissues. B, Scheme of maritime pine wood showing the different parts that form a tree ring. Source: http://www.plantphysiol.org/content/127/4/1513.full.pdf+html
2. Theoretical background
develop traits which are adapted to the site, for example to frost hardiness (Schweingruber, F., 1996).
The water supply of a region or site also has a great impact on plants and vegetation. The intensity of the precipitation determines the growth of the trees, and it is also related to geographical locations (equator is moist, tropics are dry). The availability of water is also determined by the soil’s physical properties and its humidity parameters, but also by the composition of the tree crowns and the stand. The total leaf surface and the hydrological conditions influence the rate of evaporation (Schweingruber, F., 1996).
2.2 Ecology of study species
2.2.1 Pinus sylvestris
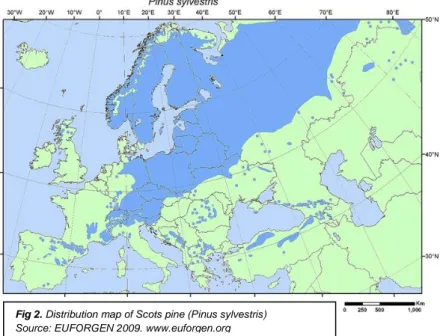
Scots pine is a conifer species which belongs to the family of Pinaceae and the genus Pinus. It covers a very wide ecological spectrum, from the cold continental climate of northern Europe and Asia, like that of Scandinavia and Siberia, as well as in the semiarid climate of southern Europe like Spain (Schweingruber, F., 1993), although they prefer continental climate (Manuel, K., 2007) (Fig 2).
Scots pine is not a highly competitive specie (Pritzkow, C., 2013). As it has a very broad physiological spectrum, it is pushed to the limits of its adaptability by other strongly competitive species (Schweingruber, F., 1988). Thus, it has low demands concerning humidity and
nutrients, and is resistance against droughts and late frost (Spiesky, D., 2013). It is a light demanding specie and very tolerant to extreme temperatures, with January temperatures of -15°C in northern Europe to 8°C in Southern Europe, and mean July
Fig 2. Distribution map of Scots pine (Pinus sylvestris)
2. Theoretical background
temperatures from 10 to 22°C (Schweingruber, F., 1993). Their altitude limit in the Alps is between 1700 and 2000 m, habiting places with an annual precipitation of 2500mm -western Europe- and 400 mm -southern Europe- (Schweingruber, F., 1988). Their shape and size can be very different. They can reach heights of 35-40 m on optimal sites with a narrow crown, and on adverse sites only 5-15m with a bushy crown (Pritzkow, C., 2013). It’s orange-red scaly bark protects the tree from parasites and fast burning fires, and makes it easy to recognize the specie (González, J.M., 2006) (Fig 3.).
Their well developed root system makes them largely independent of the water and nutrient supply of the topsoil (Leibundugt, H., 1991). Likewise, their demands on soil properties are very low, habiting in areas with dry sandy soils and calcareous, siliceous soil (Leibundugt, H., 1991). On all natural sites, Pinus sylvestris grows to be well over 300 years old, and it reaches its maximum age of 600 years on dry sites (Schweingruber, F. 1993).
2.2.2 Quercus petraea
Sessile Oak3 is a deciduous tree which belongs to the beech family, Fagaceae, and the genus Quercus. The ecological spectrum of the sessile Oak is rather large at low and intermediate elevations (Schweingruber, F., 1993). It covers most of Europe between 40-60º N, from Spain to Russia and Scotland to Turkey (YücedaĞ, C., 2013) (Fig 4.), and it forms forest at medium altitudes, between 300-400m (Schweingruber, F., 1988).
3
The data this study uses is based on previous studies of the same area. This studies took samples of both Sessile Oak (Quercus
petraea) and Pedunculate Oak (Quercus robur), but as the wood of these two species cannot be differentiated and hybridization is
common, they are treated together in dendrochronology.
In this case, characteristics of Sessile Oak (Quercus petraea) will be treated more in depth for their association with the other compared Fig 3. Scots pine (Pinus sylvestris)
2. Theoretical background
It is light-demanding specie, although is able to support denser and shadowed
conditions (Bacilieri, R., 1994). Sessile Oak has a broad climatic tolerance within their area of distribution, occurring under very varying conditions. In western Europe, in oceanic climates, temperatures in July average around 14ºC and in January of -5ºC, with an annual precipitation of 300 mm(Schweingruber, F., 1993).
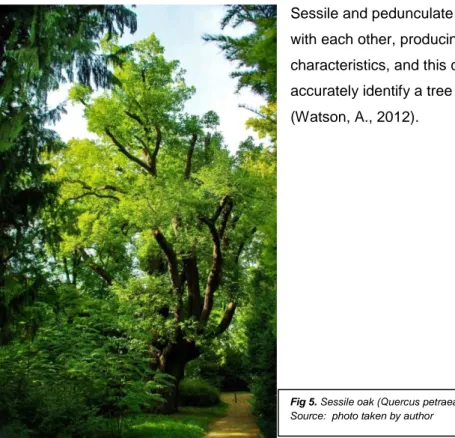
Quercus petraea demands warm summers and is sensitive to late frost and few moisture. This deciduous tree growth to a high of 40 m and has a narrow and regular crown, with a strong, deep root system. It has a grey and fissured bark with straighter branches (Watson, A., 2012). It is better developed in well-drained, few fertile and acidic soils. Quercus petraea, especially from dry sites, can grow to be ancient over 1000 years, while on sites with good water and nutrient supply oaks are barely over 200 years old (Schweingruber, F., 1993).
Sessile and pedunculate oak hybridise naturally with each other, producing trees of intermediate characteristics, and this can make it difficult to accurately identify a tree to the species level (Watson, A., 2012).
Fig 5. Sessile oak (Quercus petraea)
Source: photo taken by author .com
Fig 4. Distribution map of Sessile Oak (Quercus petraea)
3.Study area
3. STUDY AREA
The following chapter will be focus on the physical geography of the general study area. A description about the place where the tree ring sampling data used, as well as the climate, vegetation and soil characteristics of its surrounding area will be here explained.
3.1 Location
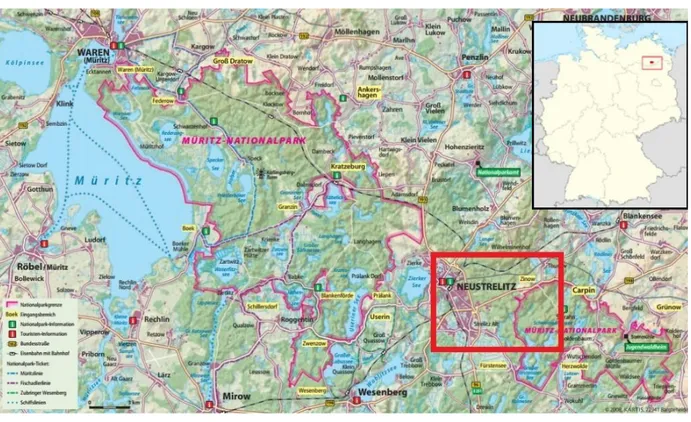
The study area is located in the Müritz National Park (53ºN 13ºE), in the state of Mecklenburg- Vorpommer and the District of Mecklenburg Lake, between the cities of Waren (Müritz), Neustrelitz and Feldberg, in the north-eastern part of Germany. For this thesis the data used has been focused on the area of Neustrelitz and its surroundings (Fig. 6).
The Müritz National Park comprises an overall area of 32.199 Ha and consists of two sub-areas, the larger part, Müritz -25969 Ha-, which is located on the west side of the city
Neustrelitz, and Serrahn, the smaller area -6230 Ha- located on the eastern side (LFG., 2004) and of most importance for the study.
The eastern part of the national park Serrahn, is a forest that has been preserved from utilization for 150 years. The sessile oak, pine and beech mixed stand are of most importance, being part of World Heritage property “Primeval Beech forests of the Carpathians and Ancient Beech Forests of Germany”. In 2011 the singularity of these woods was included in the list of
Fig 6. Area of the Müritz-Nationalpark. On the red square the study area, including the area closed to Neustrelitz and Sarrihn, place where the
majority of the data here used where taken from. Source: www.mueritz-nationalpark.de/
3.Study area
the UNESCO World Heritage. Their preservation have a great priority, thus they became a subject of study for many studies related to the forest dynamics, as in the Northeast German Lowland Observatory Müritz National Park" (TERENO NO) project4, from where tree rings data have been provided.
During the middle ages the forested area of northeastern Germany was exploited as agricultural land, leading to a destruction of the natural forest structure. What was once a broadleaf
dominated forest with European Beech (Fagus sylvatica), Sessile oak (Quercus petraea), and Pedunculate oak (Quercus robur) representing the main tree species, is now dominated by Scots Pine (Pinus sylvestris). With silviculture practices 200 years ago it was possible to cultivate previously damaged sites by planting Scots pine as it isn’t a demanding specie and is easy to reforest the devastated natural forest. But since the 1990s, Scots pine forests have been transformed into mixed pine-oak forests thanks to forest management.
3.2 Climate
The area that has been studied is considered in the temperate zone, more precisely in the transition region of a sub-atlantic to a sub-continental climate. Therefore the maritime influence is weak but also continental influences have an impact.
According to the data of the study area for the period 1961-1990, provided from the WMO (World Meteorological Organization), the mean annual temperature in Serrahn is 7.7 ° C with a mean annual precipitation sum of 622 mm (Fig.7).
In this area are registered the highest values of precipitation. This is due to the considerably prominent lobe of Strelitz (up to about 110 m above sea level) of the Pomeranian terminal moraine and the large enclosed beech forests, which affect the local climate (LFG., 2004). It ensures to raise advective air masses and thus, the air cools down and it comes to condensation and cloud
formation.
4
More information about the project on: http://teodoor.icg.kfa-juelich.de/overview-de. Fig 7. Climate graph of the Serrahn area between 1961-1990.
Source: http://www.pik-potsdam.de/~wrobel/sg-klima-3/landk/Mecklenburg-Strelitz.html?id=19
3.Study area
The difference between the absolute minimum temperature (-24,1ºC) and maximum
temperature (34,87ºC) is high enough so as to indicates a strong continentality (58,97ºC). The wettest period is in summer (June, July, August), with a maximum temperature of the hottest month of 22,12ºC, but also with the highest precipitation period, associated with the increased thunderstorm activity. The frost-free period is about 168 days although it is possible that between 10 and 12 months some frost events might happen.
Since the average monthly precipitation curve (blue) is above the mean monthly temperature curve (red), the climate can be described as humid (Dfb, according to the Köppen climate classification system).
3.3 Soil and hydrology
The geological young landscape of the Müritz National Park was shaped during and after the last ice age, a period that influenced geomorphologic and sedimentology the natural
environment.
The moraine of the Pomeranian stage forms the Strelitzer lobe between the areas of Weisdin and Feldberg. Due to the high relief (142 m above sea level), the terminal moraine was unsuitable for arable land and therefore was for centuries forested (LFG., 2004).
The soil of this protected area of Serrahn is undulating glaciated lowland with lakes, mires and bogs, lying on poor sandy soils, acidic sands and boulder clays. Brown soils, poor in nutrients, represent the dominant soil type in the Müritz National Park (UNEP, WCMC, 2011).
As a result of this glacial influence, some lakes were form after the retreat of the Weichselian ice sheet in a subglacial channel directly in front of the Pommerian ice margin. The Großer
Fürstensee, is one of the most important lakes of the Serrahn region (Dietze, E., 2013) with an
average depth of 4.3 m. The lake catchment includes other smaller lakes and peatlands like the
Hinnensee, an unconfined aquifer with 48 Ha and with medium glacial sands.
The lake levels vary with groundwater levels in response to hydrological and catchment‐related groundwater recharge (Dietze, E., 2013).
3.4 Vegetation
Overall, a 72% (23.180 Ha) of the Müritz National Park is cover with forest. Pine is the dominant species followed by beech (8%), birch (6%) and alder (5%).
On the study area, close to the northern bank of the Hinnensees the sessile oak and beech forest are dominant, but pine-beech forest can also be found. Actually, Scots pine (Pinus
3.Study area
sylvestris) is the most common specie of the region, followed by the 200 years old beech (Fagus sylvatica) and the old sessile oak (Quercus petraea) (LFG., 2004).
There are some stands in orderly rows where the pines have been planted by hand, but in many places it is possible to see that deciduous trees are spreading under the pines. As they grow up they cause a severe lack of light, which justifies the meagre ground vegetation of the area. All this happens as a result of natural forest regeneration (Pohlmann, S., 2013). Thus for the last 50 years the area has not experienced any heavy forestry management and therefore presents a more natural state (Nüske, W., 2012).
4.Material
4. MATERIAL
This chapter describes the basis data used for this thesis. On the one hand, there will be explained the source of the meteorological data used as well as an explanation of what they concern, and on the other hand from where the tree rings width values have been obtained.
4.1 Meteorological data
Although the characteristics of the study area have been based on the place where the tree ring cores were sampled, the meteorological data covers a bigger area. Due to the lack of
meteorological stations with long climatic series close to the different places where the cores were taken in the area of Serrahn, an interpolation of the closest meteorological stations of the coordinates from Neustrelitz, 53ºN-13E with a grid point data sets which cover the global surface at regular squares with a resolution of 0.5 ° has been downloaded from the KNMI Climate explorer (http://climexp.knmi.nl/).
Values of the monthly temperature (CRU TS3.21) and monthly precipitation (CRU TS3.21) from the period 1901-2012 have been downloaded from the database of the Climate Research Unit (CRU). Moreover, the datasets for the monthly drought (UCAR Palmer Drought Severity Index) in the PDSI for the period 1850-2010 have also been downloaded.
4.1.1 Temperature and precipitation
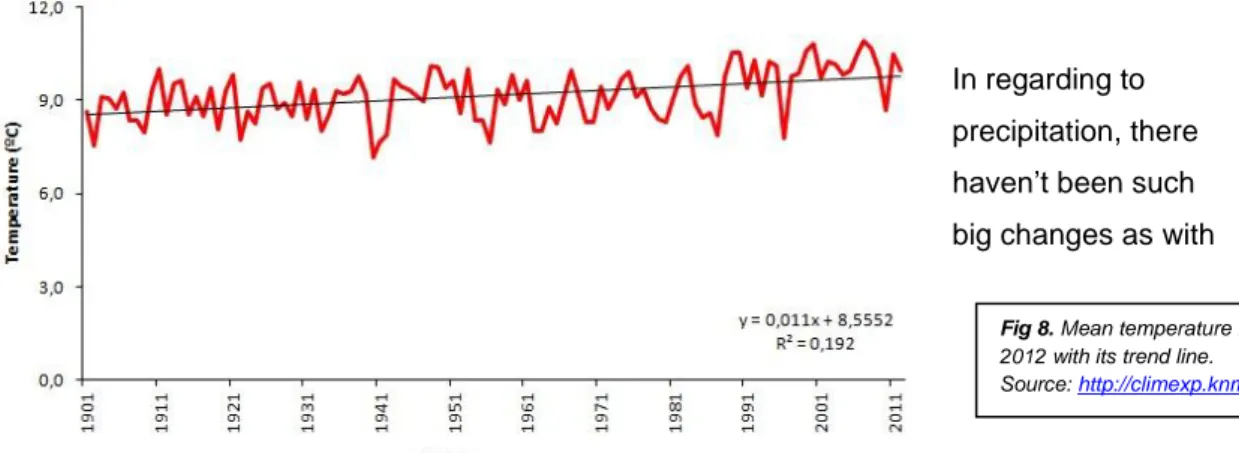
Both meteorological parameters increase over the analyzed period, although temperatures have higher increase than precipitation (Fig.8 and Fig.9).
Focusing on temperature (Fig.8), there has almost been an increase of 1’5ºC over the last 100 years if we compare the temperature in 1901 (8,6ºC) and 2012 (10ºC), with higher values in the last two decades. From 1990 to nowadays, the annual average temperature is around 10ºC, while at the beginning of the century the values registered where around 8,5 and 9ºC. So temperature is having an increasing tendency.
In regarding to precipitation, there haven’t been such big changes as with
Fig 8. Mean temperature from 1901 to
2012 with its trend line. Source: http://climexp.knmi.nl/
4.Material
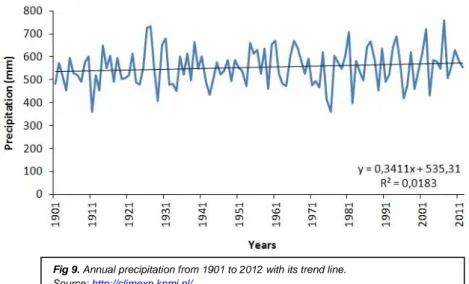
temperature. There has been a slightly increase in the year precipitation trend over the period. In 1901 the year precipitation registered was 482,4 mm while in 2012 was 555,9 mm, so there has been an increase of 73,5 mm. But still the year precipitation is around 550 mm.
All in all, it is said that a warmer world will lead to a world with more precipitation5, a statement that can be seen in this period.
4.1.2 Palmer Drought Severity Index (PDSI)
The Palmer Drought Severity Index (PDSI) attempts to measure the duration and intensity of the long-term drought. It can be calculated by the parameters of precipitation and air
temperature of the respective location, but it also takes into account soil properties such as soil moisture. The values of the PDSI are in a range from -6.0 (extreme drought) to +6.0 (extreme wet conditions) (NOAA).
5
According to the IPCC 2007: “Apart from driving temperatures up, global warming is likely to cause bigger, more destructive storms, leading to an overall increase in precipitation.” Quoted from Earth observatory NASA (www.earthobservatory.nasa.gov)
Fig 9. Annual precipitation from 1901 to 2012 with its trend line.
Source: http://climexp.knmi.nl/
Fig. 10 PDSI for the period 1850-2010
4.Material
The data set presented in this thesis contains monthly values of the PDSI from 1850 to 2010. As figure 10 shows, the area around Neustrelitz experiences moderate drought conditions during this period, with some moist periods between 1920-1930 and 1960-1970. Strong changes or tendencies are not obvious.
4.2 Tree ring width (TRW)
In dendrochronology, the simplest proxy is measuring the width of growth rings. The tree ring width involves measuring the distance between the latewood boundary for one year and the boundary for the next year. Due to their physiological characteristics, trees normally create a ring every year. This continuous time series is the reason, why every ring is dateable. The first dateable and therefore complete tree ring, beginning from the bark side, is the one from the year that the sample was taken. Then, every following ring is dated in relation to this ring, and measured contrarily to the growing direction from the bark to the pith (Pritzkow, C., 2013). The tree rings width data used in this thesis have been provided from previous works done in the German Research Centre for Geosciences (GFZ) in Potsdam.
As parts of the TERENO project, master and doctoral thesis have been completed in the Müritz National Park, and in this case in the area of Serrahn, studying the tree-ring growth, cell anatomy, isotopes and other variables in the trees related with the climate. For the studies, trees had to be sampled and prepared, and so this thesis thankfully used the information already treated and dated as a basis.
As described in the study area (chapter 3), the forest of Serrahn are a mix of pine, beech and oak trees. Most of the studies are focused on Scots pine of the area, because coniferous trees have been proved to be the best and easiest trees to work with, but there has also been studies focused on the evolve of the Oaks. So as a basis for this thesis all this data have been used, being modified for achieving the purpose of this project.
Tree ring width of long series from Scots pine and Sessile oak had to be adjusted just into the last 110 years so as to have the same period of time as the meteorological data and for the necessary statistics methods described in the following chapter (Methods).
5.Methods
5. METHODS
The following information describes the methods and statistics used for a future correct interpretation. The given values of tree rings width had to be checked and standardized before they could be correlated with the meteorological data. Moreover, statistics tests had to be done so as to have good enough representative data from all given datasets.
All these analysis are based, basically, on qualitative procedures using specific programs for dendrochronology, although quantitative procedures will be also necessary.
5.1 Crossdating quality
Crossdating is the most basic principle of Dendrochronology. It is a technique that ensures each individual tree ring is assigned its exact year of formation by matching patterns of wide and narrow rings between cores from the same tree and trees from different locations (Martinez, L., 1996). This is possible because climate or other regional environmental factors that limit annual radial growth produce common year-to-year variation in tree rings across a large number of individuals. The accurate interpretation of environmental signals (e.g., insect outbreak, fire, and drought) recorded in annual tree rings is dependent on the quality of crossdating (R.S Maxwell., 2011).
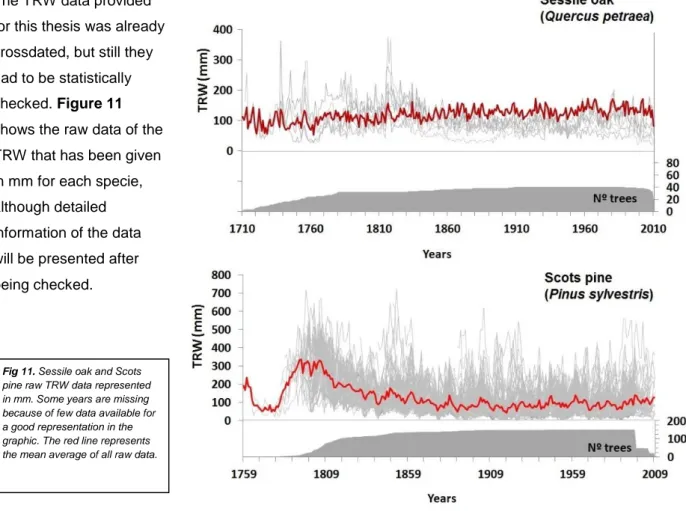
The TRW data provided for this thesis was already crossdated, but still they had to be statistically checked. Figure 11 shows the raw data of the TRW that has been given in mm for each specie, although detailed information of the data will be presented after being checked.
Fig 11. Sessile oak and Scots
pine raw TRW data represented in mm. Some years are missing because of few data available for a good representation in the graphic. The red line represents the mean average of all raw data.
5.Methods
For quality-control of the data, a software called COFECHA (The Laboratory of Tree Ring Research, University of Arizona, http://ltrr.arizona.edu/research/software) was used. The program checks the crossdating and overall quality of tree-ring chronologies and inform about wrong dated rings, creating an output file with all the information.
In this thesis it has been used the default analysis settings for running the program: (1) 32-year cubic smoothing spline with 50% wavelength cutoff for filtering; (2) examination of 50-year segments lagged by 25 years; (3) autoregressive model applied; (4) transformation of series to logarithms; and (5) 0.3281 confidence level in the Pearson correlation analysis. Then the program did the properly statistics and generated an Output file with all the results. This thesis has concentrated mainly on the outputs options showed in Table 1, with the quality control for both oak and pine data.
The sessile oak analysis was based on 41 dated series with information of TRW from 1688 to 2010 and Scots pine on a 150 dated series from 1758 to 2009. From all this long data, this thesis will be just focusing on the last 90 years, but knowing the good quality and long time series from the provided data it is also essential for properly analysis.
The series correlation or Pearson’s correlation (rxy)(1) is an important consideration in assessing
chronology quality. It measures the linear relationship between pairs of values from two series (the strength of the climate signal common to all sampled trees at the site). It is the average correlation of each series with a master chronology derived from all other series.
(1)
r
xy=
where: = Values of core x and y at time I = Mean of core x and y ( )
If the two variables are correlated with each other, a trend should be visible when they are plotted against each other (Spiesky, D., 2013). Since trees grow over the same period under
Table 1. COFECHA summary results for Sessile oak and Scots pine. For detailed information about the descriptive statistics
5.Methods
similar conditions a positive trend is expected, meaning the values of tree x increase with the values of tree y. The maximum value for a positive correlation is 1 (identical), 0 stands for no correlation and -1 means negatively identical (Schweingruber, F., 1988). Most chronologies have values between 0.550 and 0.750. In this thesis the series correlated are acceptable; for sessile oaks is 0,59 and for pines 0,55 (see Appendix I).
The mean sensitivity (ms x) (2) is a common parameter used to describe a chronology. It
represents the intensity of the influence of external factors, the change in tree-ring width from one year to the next (Fritts, H., 1976) that varies among species and regional climates.
(2)
ms
x =where: = ring width in year t
= ring width in following year = number of years being compared
The resulting index ranges from zero to one. If every ring had the same width, the sensitivity would be zero and if every second ring were missing, the sensitivity would be 1. If the pattern of the sensitivity is high, the impact from external factors is high as well (Schweingruber, F., 1983). Values between 0.1 and 0.4 indicate good sensitivity (Speer, H., 2010). Both species have a mean sensitivity around 0,2, showing the ease good measures of the crossdata, although it is not a measure of the chronology’s utility for climate reconstruction. As said previously, this part of the methods was focused in the reliability of the given data, but not yet with the climatic data correlations.
5.2 Standardization
Some tree ring parameters, such as tree ring width, are influenced by biological factors. One physiological factor which participated on the tree ring shape is the age trend. It resulted from the fact that every year tree diameter rises and the same amount of growth is spread over a larger area. Due to this, the tree ring width is reduced by constant parameters over the time (Fritts, H., 1966). In dendroclimatology, the “noise”, is removed for a better climatic dependent signal in tree ring widths, and so indices are created using different “data-adaptive”
standardization techniques. All in all, the tree ring series are compared by eliminating long-term variables caused by bio-ecological factors (Schweingruber, F., 1983).
For that purpose, the program ARSTAN (The Laboratory of Tree Ring Research, University of Arizona, http://ltrr.arizona.edu/research/software ) was used. It produces chronologies from tree-ring measurement series by detrending and indexing (standardizing) the series. ARSTAN
5.Methods
provides the user with three different chronologies (Cook, E., 1996). The chronology derived from the indices as biweight robust mean, called the Standard- chronology. Endogenous disturbances are removed and the common signal of all series is enhanced. Secondly, there is the Residual-chronology. Calculated alike the standard- chronology but without the
autocorrelation of one year with the previous ones. Finally, the ARSTAN-chronology is calculated. Here the pooled autocorrelation is reintegrated into the residual-chronology. Compared to the Standard-chronology, the standard error is reduced and the climate signal further enhanced. This thesis has used the residual values, as they just focus on whole years. First, a power-transformation was applied to every tree-ring width series for a stabilization of the variance, so that the indices could be computed as residuals (Spiesky, D., 2013). Then, the detrending method used was the default one: negative exponential curve. This method is appropriate for the smoothing of age trends in width values (Schweingruber, F., 1983). A cubic smoothing spline filter6 of 66 years was used, and so climatic independent trends were
eliminated. Then an index series (It) (3) from a TRW series had to be created for standardize
the growth level from the different trees, by dividing them with the values of the smoothing function. The mean of the indices resulting from the finished calculation is always 1 and the pattern of the variances is on the same magnitude of order for all trees (Cook, E., 1990).
(3)
I
t=
where: = tree ring width series = smoothing function values
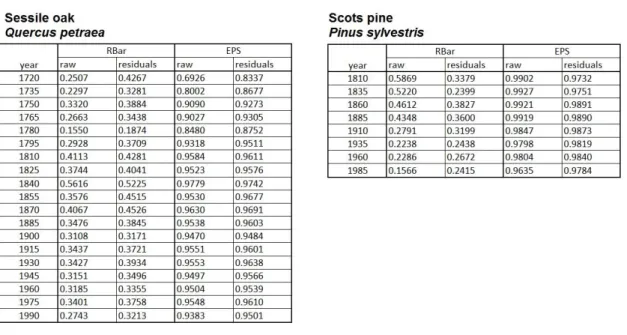
Besides of standardizing, to check the quality of the chronology the RBar values as well as the EPS (expressed population signal) signal are calculated (Table 2.). They are used to evaluate if the given parameters are sufficiently represented in the time series described (Fritts, H., 1976). The RBar represents the correlation between individual trees within the chronology and it ranges between +1 and -1 (Spiesky, D., 2013), although only positive values are relevant. The EPS (4) signal is a combined signal of the population density and correlations of the samples and represents the statistical quality of the chronology. The values under the EPS are not really representative for a good interpretation of the series. According to Wigley et al (1984) values over the threshold of 0.85 are acceptable to use the time series of the parameter as a chronology (Speer, H., 2010).
(4)
where: = average number of trees
= mean between tree correlation
5.Methods
The program runs these steeps for every single sample of both species. Once all the data was processed individually, the last step was to form the chronologies by averaging the single index series and smoothing it, and so the resulting chronology is represented (Fig. 12).
Fig 12. Mean standard indices(black line) with the smoothing line (red) of each specie. The upper graphic represents the sessile oak index
and the lower graphic makes reference to scots pine indices.
5.Methods
5.3 TRW and meteorological data correlations
After all the statistics and quality control done by ARSTAN, the indices of the tree ring width from each specie were exported where the climate data was saved, so that the correlations (Pearson’s correlation) could be done. It is a basic statistical tool in dendrochronology, widely used to identify the monthly or seasonal climate variables related to ring width growth.
They were correlated to the monthly temperature, precipitation and PDSI information. Besides, in order to include the influence of autocorrelation, the correlation analyses was extended from the previous year, from January to December of the year of growth, and together from seasons in three months (January, February, March (JFM); April, May, June (AMJ); July, August, September (JAG); October, November, Desember (OND)).
A general correlation of all study years, from 1920 to 2009, was firstly done for both species together. For a detailed analysis, a division of the whole period into 30 years was done. According to the World Meteorological Organization, it is considered that a 30 year period is long enough to filter out any interannual variation or anomalies, but also short enough to be able to show longer climatic trends. For this reason, this thesis divided the period into three
subperiods: from 1920 to 1949, from 1950 to 1979 and from 1980 to 2009.
So as to prove that the correlations where statistically good enough, a significance level of 95% and 99% were chosen. It indicates the probability of a systematic relationship between two variables. It expresses whether it may be an apparent connection purely random in nature or with a high probability that is actually present (Cook, E., 2011).
Using a template calculator of the t-test provided from the GFZ the significance levels at 95% were considered significant if they exceeded absolute values of 0,174 for the whole period and 0.305 for the subperiods, while the levels at 99% were of 0.2448 and 0.4212 respectively. The critical values for the significance levels are quite high because the degrees of freedom (number of samples –years-) are small. It has to be taken into consideration that the shorter periods implies fewer data and so the probability increases.
But still, an interpretation of the data can be done as individually they have a good quality. So a general description of how the trees evolved for the whole period, as well as a detailed
6.Results
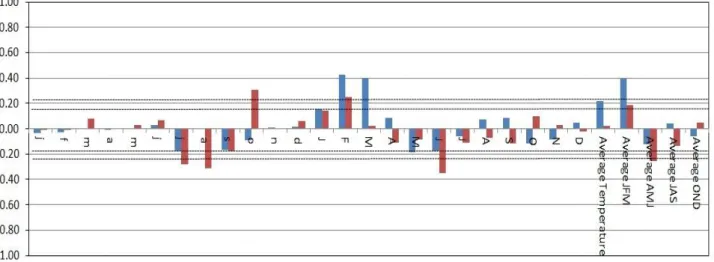
Fig 13. Correlations between monthly temperatures and TRW 1920-2009 (shaded lines represent the significance level at 95% where r=0,17
and 99% where r=0,24). The blue bars represent the correlations for Scots pine while the red bars make reference to the sessile oak.
6. RESULTS
This section will focus on presenting the results of the different correlations. They indicate the strength of the connections of the parameters based on Pearson correlation coefficient (chapter 5.1). The goal here is to identify chronologies which are highly (positive or negative) correlated with each other so as to understand their climate reaction. Firstly, a general interpretation of the whole period for each meteorological data will be presented and afterwards analysis of both species for each period will be described. In this second part the meteorological data will be first treated in more detail and then later as part of correlation analyses.
Shaded lines represent the significance level (95% and 99%) in the diagram. The diagrams represent the correlations beginning at the previous year beyond the current year to
combinations of months. The x axis represents the time (months and combinations of months) while the y axis represents the correlation coefficient.
6.1 Analyses of Pinus sylvestris and Quercus petraea
The following diagram (Fig. 13) contains the correlations between temperature and the TRW of both Scots pine and sessile oak for the period 1920 to 2009.
Scots pine (blue bars) profits from high temperatures in January, February and March of the current year, as the average in JFM is high and representative enough. On the other hand, sessile oak (red bars) exhibits negative correlations with the averages AMJ and JAS. Also the correlations are negative with summer temperatures (jas) of the previous year, especially significant for sessile oak.
6.Results
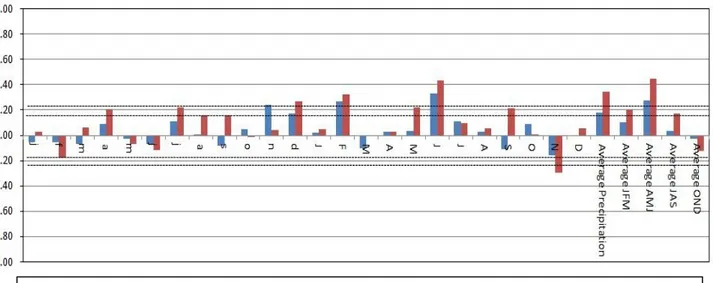
Fig 14. Correlations between monthly precipitation and TRW 1920-2009 (shaded lines represent the significance level at 95% where r=0,17
and 99% where r=0,24). The blue bars represent the correlations for Scots pine while the red bars make reference to the sessile oak.
temperatures (average temperature) and in winter time, but the species with more pronounced reaction will most likely be Scots pine.
The next diagram (Fig.14) represents the correlations between TRW and precipitation. In this case, sessile oak is the species which shows more sensitive reaction towards varying
precipitation. For May and June previous year (mj) the correlations are negative and so in the same period of the current year the correlations are higher. It shows that oaks have developed better in precipitation periods from April to September when the previous year the precipitation was good enough, so that the soil could store enough water for the next growth period (AMJ). Although Scots pine also shows positive correlations with precipitation, the increase is not as strong as for oaks.
Both species Scots pine and sessile oak grow better when an increase of precipitation occurs, especially in April, May and June, with a more sensitive reaction by the oaks.
As Figure 10 (chapter 4.1.1) has shown, the study area can undergo slightly moderate drought periods. The results for the PDSI presented in Fig.15 show strong positive correlations for both spices which indicate that the trees are sensitive to available moisture. Focusing on Scots Pine, the monthly PDSI of the previous year from January to July shows weak correlations with tree growth so the previous winter and spring are slightly humid. But from August of the previous year to December of the present year the correlation is positive, especially highly positive in June, July and August, when temperature starts to increase but still precipitation correlations are positive and so the PDSI indicates there is no extreme drought period.
6.Results
Fig 15. Correlations between monthly PDSI and TRW 1920-2009 (shaded lines represent the significance level at 95% where r=0,17 and 99%
where r=0,24). The blue bars represent the correlations for Scots pine while the red bars make reference to the sessile oak.
Almost all of the oak correlations are above the significance level 99% showing a strong positive correlation. From January to June of the previous year the correlations are positive in
comparison with Scots pine, but without reaching the significance level 95% of the correlations from July of the previous year to December of the current year. It means that the average of the PDSI and its growth is stronger and so it grows better in moist and moderately wet areas. High precipitation during the growth season benefits the radial growth of tree by providing necessary water for the radial cell division and elongation, while low precipitation limits the radial growth. Inversely, increased temperature before and during the growth season inevitably strengthens the water stress by accelerating water consumption in the soil and trees through evaporation and transpiration, resulting in the formation of narrow rings, especially in drought episodes during summer months.
All in all both species have high correlations with PDSI, especially in July, August and September, periods which register the precipitation of the previous months due to the lag effect5, but still there are some drought episodes. They can tolerate moist, but as the Scots pine correlation are lower than the sessile oak ones, and PDSI is based on a negative index, it can be said that Scots pine has a better reaction in drought moments.
6.1.1 Period 1920-1949
In general, this period is characterized by an increase of the temperatures (for more information about the meteorological data see Appendix II). This increase is more important in summer months (JAS) and in autumn (OND), although spring months (AMJ) also register high temperatures.
Precipitation values are more stable towards the ends of this 30 years. From 1920 to 1940 the summer precipitation sums where higher, with a maximum of 300 mm in the summer 1927. But
5
A lag effect is used to represent the effect of a previous value of the lagged variable when there is some inherent ordering of the observations of this variable (amount of time between the time action is taken and an effect is realized)
6.Results
Fig 16. Correlations between monthly Temperatures, precipitation, PDSI and TRW 1920-1949 (shaded lines represent the
significance level at 95% where r=0,30 and 99% where r=0,42). The blue bars represent the correlations for Scots pine while the red bars make reference to the sessile oak.
the last few years more precipitation has occurred homogeneously in all seasons, with a small increase in spring (AMJ).
For the first 10 years the area was experiencing a moist period with more precipitation and lower temperatures, but after this time, a period of mild slightly drought took place in all seasons but less so in AMJ.
6.Results
The correlations between temperatures and TRW for Scots pine are strong for the winter season (JFM), just before tree growth starts (see Appendix II). PDSI correlations in JFM are also high, as the oak results, something that reveals that pine can also develop in moist soils, but not as good as oaks.
Concerning the correlations in summer (JAS), Scots pine shows positive temperature
correlations, but negative for precipitation sums and weak correlations for PDSI. This suggest that in the three decades Scots pine has grown better in temperate winters with less water demand, and so it has been more resistant to drought periods. In summer (JAS), when the temperatures were higher -and the precipitation sums only slightly higher-, resulting in weak drought conditions, Scots pine exhibited a positive reply and grew better.
Oaks also demonstrate high correlations for winter months, but the correlation patterns indicate that oaks grow better in wetter springs (AMJ) as the correlations are high. During the period oaks are almost more sensitive to moisture availability and are well developed in damp soils, indicated by the high PDSI correlations.
6.1.2 Period 1950-1979
As the figures of the Appendix II show, temperatures of this period have increased slightly but without strong trends. However one important point to highlight is the fact that April, May, and June (AMJ) rise especially from 1977 onwards.
In JAS the precipitation sums are the highest, but with an important increase of the spring (AMJ) precipitations. By this season, precipitation starts to increase in comparison to previous years. This change in spring precipitation (AMJ) shows that between 1969 and 1972, and especially during the last few years, the amounts were higher than summer precipitations.
Regarding such slight increases of temperatures and precipitations, it is not surprising that in this period mild droughts occur more often, particularly in the last ten years of the period. The 1960 were more humid than the final decades, when the temperatures increased while precipitation was stable but less concentrated in summer season and more intense in AMJ. The correlations with TRW are represented in Figure 17. The strongest temperature
correlations for both Scots pine and sessile oak are visible in winter months (JFM). With general increases of the temperatures, the occurrences of really cold winters start to decrease and the climate becomes more temperate, supplying generally more suitable conditions for the
development of trees. Scots pine also displayed positive correlations with precipitation, which is likely due to the elongation of the precipitation period, but also because the water supplies of the trees are also ensured by the additional precipitation sums of the previous year, which can be inferred from the high autumn correlations (OND) of the previous year. The PDSI correlations for Scots pine in winter are also high, indicating that there were no severe droughts. For sessile
6.Results
Fig 17. Correlations between monthly Temperatures, precipitation, PDSI and TRW 1950-1979 (shaded lines represent the
significance level at 95% where r=0,30 and 99% where r=0,42). The blue bars represent the correlations for Scots pine while the red bars make reference to the sessile oak.
oak the situation is the same, but with somewhat stronger PDSI correlations, which may suggest that this species is more sensible to the soil water availability during drought periods.
On the other hand during the months AMJ, the correlations are totally opposite for both species, that is highly negative for temperatures and positive for precipitation. During the growing season, the temperatures are high and often too high resulting in unfavourable conditions for tree growth, except if the precipitation sums are high enough, as they sometimes are (see
6.Results
Appendix II). The water supply is more important for tree growth than the temperature, as demonstrated by correlation patterns (Fig.17). In such mild drought situations, the PDSI correlations in AMJ are high, especially for sessile oak, which reacts more sensitive.
In summer (JAS) the PDSI correlations for Scots pine are high due to the limited amounts of water supplies that the soil has stored from previous precipitation AMJ.
6.1.3 Period 1980-2009
The following period is based on warm, slightly humid and drought years (see Appendix II). An increase of the temperature in the last 10 years can be noted, with an average temperature above 10ºC. Winter season (JFM) is less cold than previous years with temperatures above 0ºC and so with fewer frost periods. Summer moths (JAS) still register the higher values, although the spring season (AMJ) also increases its values and it is becoming warmer.
For the precipitation values, no clear tendencies can be discovered, but a general small increase for all months. The highest values are no longer just in summer but also in spring. Even autumn and winter also have experienced slight increments.
These have been moderate drought periods, as the risen in temperatures have been larger higher than for the precipitation values. This situation has become more prominent since the 1990s when temperatures started to be higher and the precipitation was distributed more evenly throughout the seasons. An example of an extreme drought episode was the summer of 2003, when precipitation during the whole previous year (2002) was low and temperatures were extremely high (Appendix II).
Figure 18 represents the correlations between the TRW and meteorological data just described
separately. Starting with temperature correlations for Scots pine, they show there is a strong positive correlation in winter time during the current year (JFM), when the temperatures have also increased. Despite temperate winters, these are not the wettest months. As previously said, precipitation has become more evenly distributed during the year. The soil can store this water and stays slightly moist and thus the PDSI from January to June of the previous year was negative. But the correlation situation changes from July previous year to December of the current year because although the soil is moist, temperatures increased and so the pine correlations for the current year reach more significant levels. They are not as high as sessile oak, which it seems to represent a better adaptation to mild drought events.
The same situation of positive correlations for PDSI also happens during the growing season in spring (AMJ). Temperatures increase as well as precipitation sums, but in this moment
precipitation storage is more important than temperatures for the tree growth. For this reason spring temperature correlations (AMJ) are negative while the ones for precipitation are, on average, quite positive and representative.
6.Results
Fig 18. Correlations between monthly Temperatures, precipitation, PDSI and TRW 1980-2009 (shaded lines represent the
significance level at 95% where r=0,30 and 99% where r=0,42). The blue bars represent the correlations for Scots pine while the red bars make reference to the sessile oak.
In summer, with higher temperatures, summer temperature correlations (JAS) for Scots pine, especially in August, are higher than the others. The precipitation correlations for the same months are not really strong. Nevertheless, summer can be interpreted as drought period because the PDSI correlations are positive and significant enough. In comparison the
correlations for Scots pine are lower than sessile oak which seems to be more sensible to dry periods and not as well adapted as Scots pine.