Impact of imaging protocol on left ventricular
ejection fraction using gated-SPECT myocardial
perfusion imaging
C. Marcassa, MD,
aR. Giubbini, MD,
bW. Acampa, MD,
cC. Cittanti, MD,
dO. Djepaxhija, MD,
hA. Gimelli, MD,
eA. Kokomani, MD,
hG. Medolago, MD,
fE. Milan, MD,
gand R. Sciagra
`, MD
haCardiology Department, S. Maugeri Fnd, IRCCS, Scientific Institute of Veruno, Veruno, Italy bDepartment of Medical Imaging, University and Spedali Civili, Brescia, Italy
cDepartment of Advanced Biomedical Sciences, University ‘‘Federico II’’, Naples, Italy
dNuclear Medicine Unit, Department of Morphology, Surgery and Experimental Medicine,
University of Ferrara, Ferrara, Italy
eFondazione Toscana G. Monasterio, Pisa, Italy fNuclear Medicine Dept, Bergamo, Italy
gNuclear Medicine Unit, San Giacomo Apostolo Hospital, Castelfranco Veneto, Italy
hNuclear Medicine Unit, Department of Experimental and Clinical Biomedical Sciences,
University of Florence, Florence, Italy
Received Dec 16, 2015; accepted Feb 2, 2016 doi:10.1007/s12350-016-0483-6
Background. There are limited data on the impact of the imaging protocol (single-day stress-rest, SD, vs. dual-day, DD) on the change in left ventricular (LV) ejection fraction (EF) (post-stress-rest) in relation to ischemia and on outcome.
Methods. Using propensity score matching procedure, 490 of 1121 patients with known CAD, undergoing a SD or a DD in a multicenter study, were evaluated. Stress and rest gated-SPECT myocardial perfusion imaging was used to quantify LV perfusion, EF, and volumes. Outcome was assessed at an average follow-up time of 3.2 years.
Results. Post-stress LVEF in SD and DD were comparable across all degrees of ischemia. The change in LVEF in patients with severe ischemia was, however, higher in the DD protocol, independent of the extent of CAD. At follow-up, 240 patients (49.0%) required coronary revascularization (CR) and 52 patients (10.6%) had hard events. The ischemic burden was independently associated with CR and hard-events; the post-stress LVEF was associated with CR but the change in EF was not predictive of either CR or hard events.
Conclusions. In patients with severe ischemia, underestimation of post-stress myocardial stunning could be observed with the SD protocol. Post-stress LVEF and the extent ischemia, but not the change in EF, are predictive of CR and hard events. (J Nucl Cardiol 2016)
Key Words: Gated-SPECTÆ myocardial perfusion imaging Æ prognosis Æ study protocol
On behalf of The Italian Working Group of Nuclear Cardiology. Reprint requests: C. Marcassa, MD, Cardiology Department, S.
Maugeri Fnd, IRCCS, Scientific Institute of Veruno, Italy; [email protected]
1071-3581/$34.00
Abbreviations
CAD Coronary artery disease
CR Coronary revascularization
DD Dual-day
EF Ejection fraction
EDV End-diastolic volume
ESV End-systolic volume
LV Left ventricular
MPI Myocardial perfusion imaging
SD Single-day
SDS Summed difference score
SRS Summed rest score
SSS Summed stress score
See related editorial, doi:
10.1007/s12350-016-0473-8
.
INTRODUCTION
Gated-SPECT myocardial perfusion imaging (MPI) provides incremental diagnostic and prognostic infor-mation in patients with known or suspected coronary artery disease (CAD).1–5 The use of 99mTc-labeled tracers, due to their intra-cellular trapping, requires two separate tracer injections for a complete stress/rest study; this can be obtained using a single-day (SD) or dual-day (DD) protocols.6 The time interval between tracer injection during stress and image acquisition, the type of stressor used (exercise vs vasodilator stress), and the study protocol could affect the relationship between ischemia and left ventricular (LV) ejection fraction (EF) and conceivably outcome prediction.7–9
The aim of this study was to examine the differen-tial impact of these variables on myocardial perfusion and LV EF and volumes using a propensity matching analysis of a large cohort of patients enrolled in a multicenter study in whom coronary angiographic data were also available.
METHODS
The study cohort included patients aged [18 years with known or suspected CAD who underwent stress/rest gated-SPECT imaging with either SD or DD protocol for clinical indications in six institutions in Italy. At each site, patients were retrospectively selected from the respective databases according to the following inclusion criteria: stable sinus rhythm and coronary angiography performed within 3 months from the gated-SPECT. Patients were excluded if they had pacemakers, previous coronary revascularization (CR) or moderate-to-severe valvular disease. In each of the recruiting institutions, a physician trained in nuclear cardiology collected
data on demographics, risk factors, and clinical presentation. The type of stress (either exercise or pharmacological) was based on the discretion of the physician performing the study. The study protocol (SD or DD) and the radiopharmaceutical used were according to the local practices at each site. An informed written consent was obtained from all patients.
Gated-SPECT acquisition and interpretation
Stress and rest perfusion images were analyzed locally and semi-quantitatively scored according to the 17-segment model10
and a 5-point scale (from 0 = normal to 4 = absence of detectable tracer uptake) with an automated software program (QPS).10The summed stress score (SSS) and summed rest score (SRS) were calculated by adding the scores of the 17 segments in the stress and rest images, respectively. SSS was classified as follows: \4: Normal; 4–8: Mildly abnormal; 9–13: Moderately abnormal; [13: Severely abnormal. The summed difference score (SDS = SSS-SRS) was used as a marker of ischemia, and classified as follows: \2: No ischemia; 2–4: Mild ischemia; 5–8: Moderate ischemia; [8: Severe ischemia. Left ventricular volumes and EF were measured after stress and at rest using a previously validated software (QGS).11The LVEF, end-systolic volume (ESV), and end-diastolic volume (EDV) after stress and at rest were calculated at each institution. Transient ischemic dilatation was based on gated EDV and ESV.12
Coronary angiography was performed using standard techniques; [50% luminal diameter narrowing was considered significant stenosis.
Events during the follow-up were defined as the need for percutaneous or surgical CR due to worsening symptoms or hard events, defined as the occurrence of cardiac death or acute coronary syndrome. These events were verified by review of hospital records, interviewing patients, their family members or treating physicians.
Statistical Analysis
Continuous data are presented as mean ± 1 standard deviation. Categorical variables are presented as numbers or proportions and were compared with the continuity corrected Chi-square or Fischer’s-exact test, as appropriate. Patients undergoing a SD or a DD protocol were balanced using the propensity score matching procedure. Rosenbaum and Rubin first proposed this method to balance the variables related to the choice of the exposure (treatment) in order to reconstruct a situation similar to a random assignment.13 The propensity score model was generated using all potential covariates that could affect the group allocation, in order to draw more reliable results. A non-parsimonious logistic model was used to estimate the individual probability to undergo a SD or a DD study protocol for each patient. The matching procedure used in this analysis was to match cases in the SD and DD group by similarity of propensity score. A 1:1 matching procedure without replacement was used. The impact of the study protocol and amount of ischemia combinations on the LV stress/rest EF changes was assessed by a two-way principal analysis ANOVA. Two models were explored. In the first
model, as independent variables (factors) were considered the study protocol and amount of ischemia; in the second model, the presence and extent of CAD were additional factors. The LVEF changes were considered as the dependent variable in all models. A post hoc test (Scheffe´ F test) was performed to identify the main sources of variability. If a significant F value
was found for one independent variable, then this was referred as a main effect. When a main effect was found, then a post hoc test (Scheffe´ test) was performed to compare the depen-dent variable upon the levels of the factor, thus idepen-dentifying the main sources of variability. A multinomial logistic regression analysis was performed, to identify independent predictors of
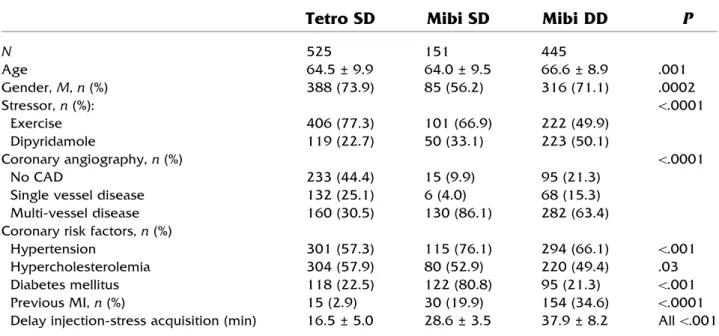
Table 1. Characteristics of the study cohort
Tetro SD
Mibi SD
Mibi DD
P
N 525 151 445 Age 64.5 ± 9.9 64.0 ± 9.5 66.6 ± 8.9 .001 Gender, M, n (%) 388 (73.9) 85 (56.2) 316 (71.1) .0002 Stressor, n (%): \.0001 Exercise 406 (77.3) 101 (66.9) 222 (49.9) Dipyridamole 119 (22.7) 50 (33.1) 223 (50.1) Coronary angiography, n (%) \.0001 No CAD 233 (44.4) 15 (9.9) 95 (21.3)
Single vessel disease 132 (25.1) 6 (4.0) 68 (15.3) Multi-vessel disease 160 (30.5) 130 (86.1) 282 (63.4) Coronary risk factors, n (%)
Hypertension 301 (57.3) 115 (76.1) 294 (66.1) \.001 Hypercholesterolemia 304 (57.9) 80 (52.9) 220 (49.4) .03 Diabetes mellitus 118 (22.5) 122 (80.8) 95 (21.3) \.001 Previous MI, n (%) 15 (2.9) 30 (19.9) 154 (34.6) \.0001 Delay injection-stress acquisition (min) 16.5 ± 5.0 28.6 ± 3.5 37.9 ± 8.2 All \.001
CAD coronary artery disease, %HR percentage of maximal age-predicted heart rate, MI myocardial infarction
Table 2. Clinical findings in the study cohort before and after propensity matching
Before Matching
P
After Matching
P
Tetro SD
MIBI DD
Tetro SD
MIBI DD
N 525 445 245 245 Age 64.5 ± 9.9 66.6 ± 8.9 .007 66.0 ± 9.5 67.1 ± 8.6 .18 Gender, M, n (%) 388 (73.9) 316 (71.1) .31 192 (78.4) 179 (73.2) .11 Stressor, n (%): \.0001 .97 Exercise 406 (77.3) 222 (49.9) 142 (57.9) 143 (58.1) Dipyridamole 119 (22.7) 223 (50.1) 103 (42.1) 102 (41.9) Exercise %HR 83.2 ± 10.4 83.0 ± 10.5 0.25 81.2 ± 0.9 83.7 ± 10.0 .17 Coronary angiography, n (%) \.0001 .29 No CAD 233(44.4) 95 (21.3) 75 (30.6) 74 (30.1)
Single vessel disease 132 (25.1) 68 (15.3) 41 (16.8) 29 (11.9) Multi-vessel disease 160 (30.5) 282 (63.4) 129 (52.6) 142 (58.0) Coronary risk factors, n (%)
Hypertension 301 (57.3) 294 (66.1) \.006 160 (65.3) 159 (65.1) .95 Hypercholesterolemia 304 (57.9) 220 (49.4) .01 143 (58.4) 122(50.0) .09 Diabetes mellitus 118 (22.5) 95 (21.3) .57 47 (19.2) 42 (17.1) .54 Previous MI, n (%) 15 (2.9) 154 (34.6) \.0001 15 (6.1) 20 (8.1) .48 Delay injection-stress acquisition (min) 16.5 ± 5 37.9 ± 8.2 \.001 17.0 ± 6.0 37.5 ± 7.5 \.001
events, considering the occurrence of hard events or CR as dependent variables, with patients with ‘‘no events’’ as reference group. The v2value, odds ratio (OR), corresponding
95% confidence interval (CI), and the Wald test P value are reported for each factor. Survival estimates for patients grouped according to the study protocol were calculated using the Kaplan–Meier method and compared by the log-rank test. To assess the incremental prognostic information from the addition of demographic, clinical, scintigraphic, and angio-graphic variables, data analysis was also performed according to a modified stepwise procedure in which individual factors were included in the model in the same order in which they would be considered in the clinical practice. Increment in information of the model at each step was considered signif-icant when the log-likelihood difference had a P value \0.05. Statistical analysis was performed with Statistical Version 10 (StatSoft, Tulsa, USA. Propensity matching was performed with the MatchIt Package14 for R (version 3.1.1).15 A P value \0.05 (two-tailed) was considered significant.
RESULTS
The study cohort included 1121 patients with a mean age 65.1 + 9.6 years, of whom 70% were men. The SD stress/rest protocol was employed in 676 (60%) patients and the DD protocol in 445 (40%); tetrofosmin was used in 525 (47%) patients and 99mTc-sestamibi in 596 (53%). The tracer-protocol combina-tions employed as well as the respective pertinent clinical data are shown in Table1. Tetrofosmin was exclusively used in conjunction with the SD protocol, while 75% of studies with sestamibi employed the DD protocol. The choice of the pharmaceutical was based on local practices and not upon patient demographics.
Patients undergoing the SD protocol were younger, mostly males, very few had a prior myocardial infarction and the majority were able to perform an exercise stress test. A multi-vessel disease was documented in 86% of
Table 3. Perfusion and function data in matched groups according to the type of protocol
Perfusion data
Tetro SD
Mibi DD
P
N 245 245
SRS 2.2 ± 3.9 2.2 ± 4.5 .94
SSS 7.0 ± 5.0 6.5 ± 6.4 .26
SDS 4.9 ± 3.2 4.2 ± 4.2 .08
% Abnormal myocardium rest 3.2 ± 5.7 3.2 ± 6.6 .94 % Abnormal myocardium stress 10.4 ± 7.3 9.5 ± 9.4 .24 % Abnormal myocardium ischemic 7.1 ± 4.7 6.2 ± 6.2 .08 SSS category, n (%) Normal 0–3 53 (21.6) 75 (30.5) \.0001 Mild 4–8 120 (49.0) 69 (28.0) Moderate 9–13 44 (18.0) 33 (13.4) Severe [ 13 28 (11.4) 69 (28.1) SDS category, n (%) No ischemia 0–1 36 (14.7) 87 (35.4) \.0001 Mild ischemia 2–3 82 (33.5) 56 (22.8) Moderate ischemia 4–7 96 (39.2) 65 (26.4) Severe ischemia [8 31 (12.6) 38 (15.4) Functional data LVEF rest (%) 53.8 ± 13.8 54.4 ± 14.1 .61 LVEF stress (%) 51.6 ± 13.9 51.8 ± 14.0 .88 stress/rest LVEF changes -2.2 ± 4.9 -2.6 ± 6.7 .39 EDV index stress (cc/m2) 65 ± 29 55 ± 24 \.001
ESV index stress (cc/m2) 34 ± 25 29 ± 21 .02 EDV index rest (cc/m2) 62 ± 28 54 ± 22 \.001 ESV index rest (cc/m2) 32 ± 26 27 ± 19 .01 TID EDV 1.04 ± 0.1 1.05 ± 0.15 .43 TID ESV 1.10 ± 0.22 1.13 ± 0.28 .20
% Abnormal myocardium (stress and rest) was calculated by dividing the summed scores by 68, the maximum potential score (4 points 9 17 segments), and multiplying by 100. The difference (stress-rest) indicates the % Abnormal Myocardium Ischemic EDV end-diastolic volume, EF Ejection fraction, ESV end-systolic volume, LV left ventricle, SDS summed difference score, SRS summed rest score, SSS summed stress score, TID transient ischemic dilation
patients undergoing the SD protocol with sestamibi, while 44% of patients undergoing the SD tetrofosmin protocol had no significant CAD.
To avoid the influence of confounders on the analysis of the relation between the different study protocols, a propensity matching approach was used, with the exclusion of the group of patients undergoing the SD protocol with sestamibi, due to the smaller sample size (n = 151; Table1). Clinical and angio-graphic data before and after matching are reported in Table2. Though no significant differences were docu-mented between the SD and the DD protocol in SSS, SRS, and SDS, patients undergoing the DD protocol more frequently showed either normal or severely abnormal results than patients undergoing the SD protocol (Table3). No significant differences were documented between the two groups regarding rest and post-stress LVEF. However, stress and rest LV end-diastolic and end-systolic volumes were significantly higher in patients undergoing the SD protocol (Table3).
Combined perfusion and function assessment
To better define the relative influence of the study protocol and the amount of ischemia on stress/rest LVEF changes, a two-way ANOVA was performed. In the first model, the amount of ischemia (F = 6.02; P \ .001) and the study protocol (F = 4.2; P = .041) had a significant impact on the change in EF (stress test) while the type of stress was not (F = 0.04, P = NS). The
LVEF and the change in EF varied according to the presence and severity of ischemia in the SD and DD protocols (Figure1). Post hoc evaluation of the relative effect of the study protocol and the presence and severity of ischemia showed no significant differences in the group of patients who underwent the SD protocol; however, a significantly greater reduction in the LVEF was documented in patients with severe ischemia undergoing the DD protocol (Figure 2).
In the second model, including also extent and severity of CAD, the extent of ischemia remained to have a significant impact on the change in LVEF (F = 5.0, P = 0.002), while the presence (F = 1.10,
Figure 1. Schematic representation of the single-day (SD) and dual-day (DD) protocols, with associated test and acquisition average timings. Left ventricular ejection fraction values and stress/rest ejection fraction changes (DEF) are reported, according to the presence and severity of ischemia.
Figure 2. Graph showing the stress/rest left ventricular ejec-tion fracejec-tion changes (DEF) according to the amount of ischemia in relation to the study protocol employed. Vertical bars denote 95% Confidence Intervals. DD Dual-day, SD Single-day.
Figure 3. Graph showing the stress/rest left ventricular ejec-tion fracejec-tion changes (DEF) according to the amount of ischemia in relation to the study protocol employed and to the severity of coronary artery disease. Vertical bars denote 95% Confidence Intervals. DD Dual-day, MVD Multiple-vessel disease; SD Single-day.
P = 0.29) and severity of CAD (F = 0.24, P = 0.62) and the study protocol (F = 2.85, P = 0.09) were not (Figure3).
The post-stress and rest LV volumes according to presence and severity of ischemia and the study protocol employed are reported in Table4. Left ven-tricular volumes (EDV and ESV) increase with the worsening of ischemia both in the SD and DD protocol. Across the different amounts of ischemia, LV volumes are higher for the SD than for the DD protocol, both at rest and after stress. According to the two-way ANOVA, while the amount of ischemia is responsible for the increase in volumes (with the same trend in SD and DD), only the study protocol is the factor signif-icantly associated to the differences in LV volumes within the same category of severity of ischemia, both post-stress and at rest.
Outcome data
During an average follow-up of 3.2 ± 2.1 years (range 8 days to 5.2 years) 240 patients (49.0% of the propensity matched patients) underwent CR and 52 patients (10.6%) had hard events. A comparable cumu-lative event rate was documented in the SD (55.3%) and in the DD (63.9%) groups (P = 0.08) (Figure4).
Clinical and MPI data in those with and without events are shown in Table5. Those with events were older, more likely men, have diabetes mellitus and multi-vessel CAD. Patients with hard events had higher SSS, EDV, and ESV, and lower rest and post-stress LVEF than patients with no events or undergoing CR (Table5). Patients with undergoing CR had greater SDS
and stress/rest LVEF changes than patients with no events (Table5).
When the clinical and MPI variables that were significantly associated with events by univariate anal-ysis were included in a multiple logistic regression analysis, the presence of multi-vessel CAD was the strongest variable associated with both hard events and CR (Table 6). Amongst the MPI variables, the SDS was independently associated with both CR and hard events, and the post-stress EF was associated with CR. The change in EF between post-stress and rest was not independently associated with either CR or hard events. When clinical, perfusional and functional scintigraphic data, and CAD extent were sequentially added in a stepwise model, gated-SPECT data had a significant incremental prognostic value for CR and hard events
Table 4. Left ventricular rest and post-stress end-systolic and end-diastolic volumes according to the study protocol
Tetro SD
MIBI DD
Tetro SD
MIBI DD
EDV rest (F 5 13.7, <0.001)
EDV post-stress (F 5 12.1, <0.001)
No ischemia 117 ± 37 89 ± 46 117 ± 38 92 ± 48 Mild 119 ± 41 105 ± 59 122 ± 43 106 ± 59 Moderate 112 ± 36 100 ± 36 118 ± 39 105 ± 38 Severe 130 ± 62 110 ± 45 135 ± 64 119 ± 46
ESV rest (F 5 7.3, =0.007)
ESV post-stress (F 5 5.5, =0.019)
No ischemia 59 ± 33 45 ± 38 63 ± 56 47 ± 41 Mild 61 ± 32 55 ± 48 65 ± 53 57 ± 51 Moderate 60 ± 29 48 ± 28 63 ± 41 55 ± 33 Severe 74 ± 54 54 ± 36 99 ± 48 67 ± 39 Abbreviations as Table3 Volumes are in ml
F values related to the study protocols as main effect
Figure 4. Kaplan-Meier survival estimates for patients grouped according to the study protocol.
over clinical variables; the addition of CAD information further improved the global v2regarding CR but not for hard events (Figure5).
DISCUSSION
This study evaluated the differential effects of 2 study protocols on the changes in LVEF (between post-stress and rest) and myocardial perfusion by
gated-SPECT MPI using a propensity matching model in a large cohort of patients in whom the coronary anatomy was also defined by invasive coronary angiography.
Severe ischemia were higher in patients undergoing the DD protocol, independently of the extent of CAD. The type of stressor employed did not seem to influence the relation-ship between the amount of ischemia and LVEF changes.
Differences in the time interval between the stress tracer injection and image acquisition, and between Table 5. Clinical and scintigraphic data according to the presence and type of events at follow-up
No Events
Hard Events
Revasc
P value
N (%) 198 (40.4) 52 (10.7) 240 (49)
Age (years) 64.4 ± 9.4 70.7 ± 8.5*$ 66.7 ± 8.8 * vs Revasc; $ vs No events Gender, M, n (%) 131 (66.1) 40 (76.1) 191 (79.6) 0.01 Study protocol §, n (%) 0.18 Single-day 109 (44.6) 23 (9.3) 113 (46.1) Dual-day 89 (36.1) 29 (12.0) 127 (51.8) Clinical findings, n (%) Previous MI 14 (6.9) 4 (8.1) 0 0.14 Multi-vessel disease 56 (28.2) 31 (69.6) 151 (63.0) \0.0001 Risk factors, n (%) Hypertension 128 (64.4) 37 (71.7) 149 (62.1) 0.46 Diabetes mellitus 38 (14.9) 20 (39.1) 44 (18.5) =0.001 Hypercholesterolemia 98 (49.4) 20 (39.1) 144 (60.2) =0.01 Stressor, n (%) =0.001 Exercise 94 (47.7) 26 (50.0) 158 (65.9) Dipyridamole 104 (52.3) 26 (50.0) 82 (34.1) Scintigraphic data SSS 5.9 ± 5.9 9.1 ± 6.1#* 7.6 ± 5.4$ #, $ vs no events; * vs Revasc.
SDS 3.4 ± 3.2* 5.4 ± 3.9 5.8 ± 3.9 * vs hard events and Revasc Rest LVEF (%) 52.3 ± 14.7 46.1 ± 16.9$* 56.0 ± 11.1 $ vs Revasc;
* vs No events. Post-stress LVEF (%) 50.5 ± 14.7 44.2 ± 17.2$* 52.6 ± 11.7 $ vs Revasc;
* vs No events.
Stress/rest LVEF changes -1.8 ± 5.6 -1.9 ± 5.5 -3.4 ± 6.3* * vs Hard events and No events Rest EDV (ml) 116 ± 63 122 ± 58$ 101 ± 37* $ vs Revasc;
* vs No events. Rest ESV (ml) 62 ± 54 73 ± 56$* 47 ± 29* $ vs Revasc;
* vs No events Post-stress EDV (ml) 120 ± 65 125 ± 59$* 106 ± 40* $ vs Revasc;
* vs No events. Post-stress ESV (ml) 67 ± 57 78 ± 58$* 54 ± 33 $ vs Revasc;
* vs No events.
§Proportion of events according to the study protocol
Revasc: Revascularization. Other abbreviations as Table3
For continuous variable, the ‘‘between groups’’ comparisons from ANOVA is shown. For categorical variables, the global Chi-square p value is reported
stress and rest evaluation, might provide partial expla-nation to the observed data. In our study, the post-stress LVEF in the SD and the DD was comparable across all degrees of ischemia, despite the average time-interval between the stress test and images acquisition were shorter in the SD than in the DD (16 vs 38 min).
However, rest LVEF in patients with severe ischemia in the DD group was higher than in the SD group, thus explaining the differences in the change in EF. The delay between the stress and rest imaging in the SD might be too short to ensure a complete functional recovery in patients with severe ischemia.
Despite these differences, all MPI variables were significantly associated with the events by univariate analysis; however, by logistic multinomial regression analysis, the post-stress EF and the SDS were indepen-dently associate with events, in both the SD or DD protocol. After correction for confounders, the change in EF was not independently predictive of the occurrence of events.
Clinical Implications
In the last decades, perfusion and function infor-mation obtained from stress/rest gated-SPECT MPI has provided powerful diagnostic and prognostic tool and has assumed a central role in the management of patients with known or suspected CAD.1,2,4,5Post-stress LVEF and end-systolic volumes have incremental prognostic value over perfusion data.16 The change in LVEF has been considered as a marker of stunning and large ischemia and has providing additional diagnostic and prognostic information.17–19
The delay between stress tracer injection and images acquisition has been documented to influence the severity of stress induced perfusion defects.20–22 Table 6. Multinomial logistic regression analysis results, assessing independent factors predisposing to hard events or revascularization during follow-up; patients with no events are the reference group
v
2Wald test
P value
OR
95% CI
Outcome: hard events Variable
Multi-vessel disease (y) 12.7 0.0004 4.45 1.93–10.12
Age* 10.8 0.001 1.08 1.03–1.14
Diabetes mellitus (y) 8.6 0.003 3.40 1.49–7.70 Summed difference score* 4.42 0.035 1.14 1.01–1.29 Outcome: revascularization
Variable
Multi-vessel disease (y) 17.9 \0.0001 2.92 1.78–4.81 Summed difference score* 16.82 \0.0001 1.23 1.11–1.35
Age (y)* 6.2 0.013 1.03 1.01–1.06
Gender, M 5.5 0.018 2.02 1.12–3.64 End–systolic volume* 5.4 0.021 0.987 0.975–0.998 Post-stress LV ejection fraction* 4.14 0.04 1.02 1.01–1.05
* As continuous variable y yes
Figure 5. Bar graph illustrating the incremental prognostic value (depicted by the global v2 values on the y-axis) of perfusional (Summed Stress Scores, SSS, and Summed Difference Scores, SDS) and functional (Stress LVEF and Stress/Rest LVEF) over clinical data for coronary revscular-ization (CR) and hard events. The presence of significant coronary stenoses has a further significant incremental prog-nostic for CR, but not for hard events. CAD coronary artery disease; LVEF left ventricular ejection fraction; MI myocardial infarction.
Moreover, LV volume and EF values were also influ-enced by the delay from tracer injection to images acquisition, when correlated to the amount of ische-mia.23In the study by Mut et al in the SD protocol group the rest evaluation was performed first, thus the possible effect of a prolonged stunning also affecting rest evaluation was not an issue.23 In conventional SD protocol, however, stress study is usually performed first, to allow for the possibility of a stress-only approach in the case of normal perfusion and function, thus requiring one tracer injection only. In our study, rest study in the SD protocol was performed on average 3 h after stress study and the possibility of a prolonged stunning in patients with severe ischemia, affecting rest LVEF, may explain the underestimation of the change in LVEF when compared to the DD protocol.21Our results are in agreement with those previously obtained in 1089 patients from a subgroup analysis of the J-ACCESS study, were a drop in LVEF greater than 5% did not predict events.19The selection of a SD or a DD protocol is related to local logistics and patients preferences; however, in terms of patients’ and operators’ radiation exposition, the SD protocol, requiring a 3:1 activity ratio between rest and stress studies6 seems unfavorable compared to the DD approach.
Limitations
The analysis and interpretation of gated-SPECT images were not centralized; however, this reflects a real-world snapshot, and the same approach was used in other multi-center studies.19,24
Randomized clinical trials are considered the gold standard in clinical evaluations. When properly conducted, randomization ensures that groups are com-parable; consequently, any difference detected is attri-butable to the intervention. Non-randomized data from observational studies can then be an alternative to randomized clinical trials, as they allow measuring the real-life practice and potentially producing more gener-alizable results. Unlike randomization, propensity matching could only remove overt (known) biases, but hidden biases cannot be excluded. As mentioned before the SD and DD protocols used different tracers which potentially could also be a confounder for the variability. Finally, since the group of patients undergoing ses-tamibi SD protocol was not included in the matching procedure, we are not able to make inference on the possible lack of differences between sestamibi SD or DD protocol.
CONCLUSIONS
In patients with severe ischemia, a possible under-estimation of myocardial stunning could be observed
with the SD protocol, in comparison to a propensity matched group of patients undergoing the DD protocol. The stressor employed and the severity of the underlying CAD do not seem to influence these results.
After correction for confounders, post-stress LVEF and the amount of ischemia, but not the change in EF, were the scintigraphic predictors of events; SD and DD protocols come out of equal value in predicting the occurrence of clinical events.
NEW KNOWLEDGE GAINED
Post-stress left ventricular ejection fraction and the amount of ischemia, obtained either with a SD or DD gated-SPECT protocol, provide comparable prognostic information. The change in EF (stress-rest) was not independent predictors of events. The change in EF is less in severe ischemia with SD than DD protocol.
Authors Contribution
CMarcassa contributed in conception, design and anal-ysis and interpretation of data; drafting of the manuscript; final approval of the manuscript. R. Giubbini contributed in conception, design and analysis and interpretation of data; revising the manuscript critically for important intellectual content and final approval of the manuscript. W. Acampa contributed in conception, design and interpretation of data; drafting of the manuscript; final approval of the manuscript. C. Cittanti contributed by active involvement in collecting data; revising the manuscript critically for important intellectual content. A. Gimelli contributed in conception, design and interpretation of data; drafting of the manuscript; final approval of the manuscript. G. Medolago contributed by active involvement in collection and analysis/interpretation of data. E. Milan contributed in revising the manuscript critically for important intellectual content, final approval of the manuscript. R. Sciagra` contributed in revising the manuscript critically for important intellectual content and final approval of the manuscript. O. Djepaxhija contributed by active involvement in collection and analysis of data. A. Kokomani contributed by active involvement in collection and analysis of data.
Disclosure
The authors have indicated that they have no financial conflict of interest.
References
1. Shaw LJ, Hendel R, Borges-Neto S, Lauer MS, Alazraki N, Burnette J, et al. Prognostic value of normal exercise and adeno-sine 99m Tc-tetrofosmin SPECT imaging: Results from the multicenter registry of 4,728 patients. J Nucl Med 2003;44:134–9.
2. Underwood SR, Anagnostopoulos C, Cerqueira M, Ell PJ, Flint EJ, Harbinson M, et al. Myocardial perfusion scintigraphy: The evidence. Eur J Nucl Med Mol Imaging 2004;31:261–91. 3. Cremer P, Hachamovicth R, Tamarappoo B. Clinical decision
making with myocardial perfusion imaging in patients with known or suspected coronary artery disease. Semin Nucl Med 2014;44: 320–9.
4. Hachamovitch R, Hayes S, Friedman J, Cohen I, Shaw L, Ger-mano G, et al. Determinants of risk and its temporal variation in patients with normal stress myocardial perfusion scans. What is the warranty period of a normal scan? J Am Coll Cardiol 2003;41:1329–40.
5. Hachamovitch R, Hayes SW, Friedman JD, Cohen I, Berman BS. Stress myocardial perfusion single-photon emission tomography is clinically effective and cost effective in risk stratification of patients with a high likelihood of coronary artery disease (CAD) but no known CAD. J Am Coll Cardiol 2004;43:200–8. 6. Verberne HJ, Acampa W, Anagnostopoulos C, Ballinger J, Bengel
F, De Bondt P, et al. EANM procedural guidelines for radionuclide myocardial perfusion imaging with SPECT and SPECT/CT: 2015 revision. Eur J Nucl Med Mol Imaging 2015;42(12):1929–40. 7. Hashimoto J, Kubo A, Iwasaki R, Iwanaga S, Mitamura H, Ogawa
S, et al. Gated single-photon emission tomography imaging pro-tocol to evaluate myocardial stunning after exercise. Eur J Nucl Med 1999;26:1541–6.
8. Ohtaki Y, Chikamori T, Igarashi Y, Hida S, Tanaka H, Hatano T, et al. Differential effects comparing exercise and pharmacologic stress on left ventricular function using gated Tc-99m sestamibi SPECT. Ann Nucl Med 2008;22:185–90.
9. Demir H, Tan YZ, Isgoren S, Gorur GD, Kozdag G, Ural E, et al. Comparison of exercise and pharmacological stress gated SPECT in detecting transient left ventricular dysfunction. Ann Nucl Med 2008;22:403–9.
10. Germano G, Kavanagh KB, Waechter P, Areeda J, Van Kriekinge S, Sharir T, et al. A new algorithm for the quantitation of myocardial Perfusion SPECT. I: Technical principles and repro-ducibility. J NucI Med 2000;41:712–9.
11. Germano G, Kiat H, Kavanagh PB, Moriel M, Mazzanti M, Su HT, et al. Automatic quantification of ejection fraction from gated myocardial perfusion SPECT. J Nucl Med 1995;36:2138–47. 12. Xu Y, Arsanjani R, Clond M, Hyun M, Lemley M, Fish M, et al.
Transient ischemic dilation for coronary artery disease in quanti-tative analysis of same-day sestamibi myocardial perfusion SPECT. J Nucl Cardiol 2012;19:465–73.
13. Rosenbaum PR, Rubin DB. The central role of the propensity score in observational studies for causal effects. Biometrika 1983; 70:41–55.
14. Ho Daniel E, Imai Kosuke, King Gary, Stuart Elizabeth A. MatchIt: Nonparametric preprocessing for parametric causal inference. J Stat Softw 2011;42(8):1–28.
15. R Core Team (2014). R: A language and environment for statis-tical computing. R Foundation for Statisstatis-tical Computing, Vienna, Austria. URLhttp://www.R-project.org/.
16. Sharir T, Germano G, Kavanagh PB, Lai S, Cohen I, Lewin HC, et al. Incremental prognostic value of post-stress left ventricular ejection fraction and volume by gated myocardial perfusion single photon emission computed tomography. Circulation 1999;100:1035–42. 17. Dona M, Massi L, Settimo L, Bartolini M, Giannı` G, Pupi A, et al.
Prognostic implications of post-stress ejection fraction decrease detected by gated SPECT in the absence of stress-induced perfu-sion abnormalities. Eur J Nucl Med Mol Imaging 2001;38:485–90. 18. Carvalho PA, Aguiar PM, Grossman GB, et al. Prognostic impli-cations of the difference between left ventricular ejection fraction after stress and at rest in addition to the quantification of myocardial perfusion abnormalities obtained with gated-SPECT. Clin Nucl Med 2012;37:748–54.
19. Usui Y, Chikamori T, Nakajima K, Moraes JF, Baptista IS, Hir-akata VN, et al. Prognostic value of post-ischemic stunning as assessed by gated myocardial perfusion single-photon emission computed tomography. A subanalysis of the J-ACCESS study. Circ J 2010;74:1591–9.
20. Giorgetti A, Rossi M, Stanislao M, Valle G, Bertolaccini P, Maneschi A, et al. Myoview Imaging Optimization Group. Fea-sibility and diagnostic accuracy of a gated SPECT early-imaging protocol: a multicenter study of the Myoview Imaging Optimiza-tion Group. J Nucl Med 2007;48:1670–5.
21. Sciagra` R, Sotgia B, Dona M, Pupi A. influence of the post-ex-ercise acquisition delay on the detection of functional abnormalities in Sestamibi gated-SPECT. J Nucl Cardiol 2007; 14:334–40.
22. Giorgetti A, Kusch A, Casagranda M, Tagliavia ID, Marzullo P. Myocardial imaging with 99mTc-Tetrofosmin: Influence of post-stress acquisition time, regional radiotracer uptake, and wall motion abnormalities on the clinical result. J Nucl Cardiol 2010;17:276–85.
23. Mut F, Giubbini R, Vitola J, Lusa L, Sobic-Saranovic D, Peix A, et al. Detection of post-exercise stunning by early gated SPECT myocardial perfusion imaging: results from the IAEA multi-center study. J Nucl Cardiol 2014;21:1168–76.
24. Nishimura T, Nakajima K, Kusuoka H, Yamashina A, Nishimura S. Prognostic study of risk stratification among Japanese patients with ischemic heart disease using gated myocardial perfusion SPECT: J-ACCESS study. Eur J Nucl Med Mol Imaging 2008;35:319–28.