R E S E A R C H A R T I C L E
A European proficiency test on thin-film tandem phot ovoltaic
devices
Elena Salis
1|
Andreas Gerber
2|
Jens Wenzel Andreasen
3|
Suren A. Gevorgyan
3|
Tom Betts
4|
Blagovest Mihaylov
4|
Ralph Gottschalg
4|
Alp Osman Kodolbas¸
5|
Okan Yilmaz
5|
Roman Leidl
6|
Marcus Rennhofer
6|
Shokufeh Zamini
6|
Maurizio Acciarri
7|
Simona Binetti
7|
Erwin Lotter
8|
Klaas Bakker
9|
Jan Kroon
9|
Wim Soppe
9|
Guillaume Razongles
10|
Lucia V. Mercaldo
11|
Francesco Roca
11|
Antonio Romano
11|
Jochen Hohl-Ebinger
12|
Wilhelm Warta
12|
José L. Balenzategui
13|
Juan F. Trigo
13|
Sebastian Neubert
14|
Diego Pavanello
1|
Harald Müllejans
1|
Iver Lauermann
141European Commission, Joint Research Centre (JRC), Ispra, Italy 2IEK5 Forschungszentrum Jülich, Jülich, Germany
–
3Department of Energy Conversion and Storage, Technical University of Denmark (DTU), Roskilde, Denmark 4Centre for Renewable Energy Systems Technology (CREST), Loughborough University, Loughborough, UK 5Materials Institute, TÜB_ITAK Marmara Research Center, Kocaeli, Turkey
6Austrian Institute of Technology (AIT), Vienna, Austria
7Solar Energy Research Center (MIB-SOLAR), University of Milano-Bicocca (UNIMIB), Milan, Italy 8Center for Solar Energy and Hydrogen Research Baden-Württemberg (ZSW), Stuttgart, Germany 9The Netherlands Organization for Applied Scientific Research (TNO), Petten, The Netherlands 10Commissariat à l'Energie Atomique Aux Energies Alternatives (CEA-INES), Le Bourget-du-Lac, France
11Italian National Agency for New Technologies, Energy and Sustainable Economic Development (ENEA) - Portici Research Centre, Portici, Italy 12Fraunhofer Institute for Solar Energy Systems ISE, Freiburg, Germany
13Centro de Investigaciones Energeticas Medioambientales y Tecnologicas (CIEMAT), Madrid, Spain 14PVcomB, Helmholtz-Zentrum Berlin für Materialien und Energie GmbH (HZB), Berlin, Germany
Correspondence
Elena Salis, European Commission, Joint Research Centre, Directorate C - Energy, Transport and Climate, Unit C2 - Energy Efficiency and Renewables, European Solar Test Installation (ESTI), via E. Fermi 2749 I-21027 Ispra (VA), Italy.
Email: [email protected] Present address:
Ralph Gottschalg, Fraunhofer Center for Silicon Photovoltaics (CSP), Halle, Germany; Faculty of Electrical Engineering,
Manufacturing and Economic Engineering (EMW), Hochschule Anhalt, Köthen, Germany
Abstract
A round-robin proficiency test (RR PT) on thin-film multi-junction (MJ) photovoltaic
(PV) cells was run between 13 laboratories within the European project CHEETAH.
Five encapsulated PV cells were circulated to participants for being tested at
Stan-dard Test Conditions (STC). Three cells were a-Si/ c-Si tandem PV devices, each of
which had a different short-circuit current ratio between the top junction and the
bottom one; the remaining two cells were single-junction PV devices made with
material representative of the individual junctions in the MJ cells. The RR PT's main
purpose was to assess the capability of the participating laboratories, in terms of
employed facilities and procedures, to test MJ PV devices. Therefore, participants
This is an open access article under the terms of the Creative Commons Attribution License, which permits use, distribution and reproduction in any medium, provided the original work is properly cited.
© 2020 European Union.Progress in Photovoltaics: Research and Applicationspublished by John Wiley & Sons Ltd.
1258 wileyonlinelibrary.com/journal/pip Prog Photovolt Res Appl. 2020;28:1258 1276.–
Funding information
European Union Seventh Framework Programme, Grant/Award Number: 609788
were requested to perform STC measurements of all cells according to their own
pro-cedure, which might not include external quantum efficiency measurements. The
European Solar Test Installation (ESTI) of the Joint Research Centre (JRC) provided
the reference calibrations against which the participants' results are compared. ESTI
made also a verification of the cells performance at STC at the end of the RR PT, in
order to allow a comparison between the initial stable state at which the cells were
calibrated (just before circulation) and the one they had reached at the end of the RR
PT. The overall results of the RR PT are here presented and discussed together with
some aspects of MJ PV testing that emerged as not adequately applied or largely
missing. Their full implementation is expected to improve the consistency of
future results.
K E Y W O R D S
amorphous/micromorphous silicon, interlaboratory comparison, round-robin proficiency test, STC characterisation, tandem a-Si/ c-Si, thin-film multi-junction PV solar cell
1
| INTRODUCTION
Characterisation of photovoltaic (PV) devices has expanded since some years also to study their performance under working conditions that represent the ones PV modules meet in real installations more accurately than Standard Test Conditions (STC). A milestone in this process has been achieved with the series of international standards on the energy rating of PV modules,1which was completed in August
2018 with the publication of the last two parts of the series.2,3
Still, testing PV devices at STC remains important in order to set a reference point (i) to compare different PV technologies under the same reference testing conditions, (ii) to evaluate different modules of the same technology (e.g., crystalline Si) as produced by various manufacturers and (iii) as prerequisite to assess the variation in PV module and PV technology performance with change of operating conditions.2
Testing and calibration of single-junction (SJ) PV devices usually follows the broadly applied procedures of the standard IEC 60904-1,4
with support of other standards by the International Electrotechnical Commission (IEC).5 8– The latter are necessary in order to adjust the
measurement conditions to STC or to correct the measurement results to values that have to be reported at STC. In particular, the measurement of the spectral responsivity (SR) according to IEC 60904-87 and the calculation of the spectral mismatch (SMM)
according to IEC 60904-76are crucial steps for reliable testing and calibration of any PV technology. This is valid in general for all mea-surement procedures, regardless of whether the correction for the SMM is applieda posteriorianalytically or, on the contrary, madea priori by adjusting the solar simulator's irradiance before the current– voltage (I V) measurement. The latter is indeed also a correction for– SMM, achieved by using a reference device to set the effective irradi-ance as per IEC 60904-7.6This procedure in turn involves the SR of
the reference device and of the device under test (DUT), the solar
simulator's spectral and total irradiances and the reference spectrum9
in the same way they are required for thea posterioricorrection. In the case of monolithic multi-junction (MJ) PV devices, the mea-surement procedure is more complex than for SJ, due to the intrinsi-cally complex nature of MJ PV devices.10 Monolithic MJ PV (from
now on named only MJ PV) cells are made by two or more PV junc-tions that are mechanically and electrically connected in series in one single stack, accessible only through two terminals. Thus, the individ-ual PV junctions cannot be directly accessed with non-destructive methods for electrical measurements. This constraint led to the devel-opment of more complex procedures to probe optical and electrical characteristics of MJ PV devices in order to test and calibrate them in a reliable way.
Although quite a recent introduction in the international stand-ardisation of PV, testing of non-concentrating MJ PV devices is sub-ject of two IEC standards that were published together in May 2017. The IEC 60904-1-111deals with the measurement of the I V charac-– teristics of a MJ PV device. The IEC 60904-8-112sets the
require-ments for their SR measurement, which involves on the one hand the use of specific bias light to activate the junction(s) not under test sig-nificantly more than the junction to be tested and, on the other hand, the use of a bias voltage to bring and keep the junction under test to short-circuit current conditions.
While the measurement procedures for most SJ PV devices were already well established and systematically applied in many laborato-ries, with a large variety of expertise levels and available facilities, MJ PV testing was still not fully integrated in the procedures of all labora-tories at the time of the organisation of the measurement comparison reported here. This was also partly due to the lack of an internation-ally agreed standardised procedure to test them, although pre-normative research had already produced scientific publications on the topic (see, e.g., other studies13 15– ). In addition, as good practice
for measurement and testing laboratories, and even required for
calibration laboratories accredited to ISO/IEC 17025,16 in the last 30 years several interlaboratory comparisons and round-robins have already been organised for SJ PV testing at STC.17 25– The World
Pho-tovoltaic Scale (WPVS) itself, which nowadays has become a sort of alias to refer to a solar cell with some standardised package, was in fact established in 1999 as measurement scale for PV starting from a dedicated world-wide intercomparison on calibration of PV cells.26 28–
Similar measurement comparisons are less numerous and less geo-graphically wide in the case of MJ PV devices.21,29 31– Also, a large
part of those available is mainly related to concentrated PV (with reference to a total irradiance larger than 1000 W/m2).29 31–
Due to the limited number of measurement comparisons specific for terrestrial non-concentrating MJ PV devices, a first round-robin (RR) test on thin-film MJ PV cells was organised within the FP7 infra-structure SOPHIA project.32 However, the test could not be
com-pleted due to technical issues with the circulated samples, which were not encapsulated and thus easily subject to mechanical damage.
Within the European FP7 project CHEETAH,33a second RR on
thin-film MJ (tandem) PV cells was organised between 13 testing lab-oratories, which partly differed from the participants to the SOPHIA testing. The RR was organised as much as possible in the form of a proficiency test (PT), taking the ISO/IEC 1704334as guideline espe-cially to assess the measurement results. The European Solar Test Installation (ESTI) of the Joint Research Centre (JRC), as laboratory accredited to ISO/IEC 17025 for SJ and MJ PV calibration,35provided
the reference measurements of the RR PT (RMPT). ESTI was also in charge of the RR PT overall data analysis.
The main purpose of this second RR PT was to assess the capability of the participating laboratories in terms of their testing facilities and measurement procedures specific for MJ PV devices. For the partici-pant laboratories, the technical competence of the personnel and the traceability to SI units were not evaluated separately from the assess-ment of the testing facilities and procedures, contrary to what usually happens in interlaboratory comparisons between testing and/or cali-bration laboratories that are all accredited to ISO/IEC 17025. The refer-ence laboratory of the RR PT, instead, is required by ISO/IEC 17043 to have and prove adequate level of competence of the personnel involved in the PT measurements as well as unbroken traceability chain to SI units for the measurements performed. ESTI carries all this via its accreditation to ISO/IEC 17025 as mentioned above.
The evaluation of the laboratories' capability was carried out by comparing their measurement results against ESTI RMPT values. All 13 participants as well as ESTI used indoor procedures involving solar simulators to measure the circulated devices. Only one laboratory cross-checked the short-circuit current measured indoor with the value measured under natural sunlight. Preliminary results were pres-ented at the EU PVSEC 2019,36where RR PT organisational aspects
still to be improved were also discussed. In this paper, we aim at dis-cussing in more detail all the RR PT results, not only in terms of com-parison of the participants' submitted values towards ESTI calibration, but also highlighting the main sources that could explain some of the largest deviations and that can originate from missing steps in the testing procedure.
2
| METHODOLOGY
2.1
|
Devices
Five PV devices were tested in the RR PT reported here. Among them, three were monolithic double-junction (or tandem) PV cells made of amorphous silicon (a-Si) deposited on top of micro-crystalline silicon ( c-Si). The other two devices were SJ PV cells made of a-Si and c-Si, respectively. The inclusion of SJ cells in this RR PT on tandem PV devices was driven by the fact that even testing thin-film SJ cells involves expertise and specific steps in the measurement procedure that may not be correctly or completely available at all laboratories. The additional request to test separately also SJ PV cells of the same technology as those composing the tandem cells seemed quite rea-sonable in this RR PT, because checking the participants' capabilities in testing thin-film PV technologies was one of the targets of the RR PT.
Regarding the three tandem cells, they were prepared in such a way as to have a different ratio (i.e., balance) of the short-circuit cur-rent of the top junction as compared to the bottom junction. As well known, every series-connected PV device is limited by the current produced by the cell that less effectively responds to the actual oper-ating conditions. From this point of view, a MJ PV device can be looked at as a special series-connected PV device, where one half of the cells (in the case of two junction types) is built and electrically contacted on top of the other half. However, contrary to series-connected SJ PV, in a MJ PV device the SR representative of one junction type is usually quite different from the other(s), with the result that the electrical limitation of the device is attributed generi-cally to one of the junctions (called thelimiting junction) rather than to a single cell. A currents' ratio or balance (CB) can then be calculated,11
conventionally taking the junctions in the order in which they see the incoming light (i.e., top towards bottom). Usually, this ratio is referred to STC in order to set the reference conditions in the same way it is done for the electrical performance of the DUT. When the top junc-tion is the limiting one, the CB value is smaller than 1. On the con-trary, when the bottom junction is limiting, the CB value is larger than 1. In the case both junctions (ideally) deliver the same current, the ratio equals 1, and the PV device is definedmatched.Of the three tan-dem cells included in this RR PT, one was identified by the producer as top-limited, one was nominally bottom-limited and the third was nominally matched. Table 1 lists the five PV cells together with the PV technology and the nominal junctions balance (where applicable) that characterise them. ESTI codes are used to identify them.
Each cell had a nominal active area of 1 × 1 cm2 and was mounted in a metallic robust case under a glass window of about 3 × 3 cm2, to ensure the mechanical protection of the cell during both
transportation and testing (Figure 1). In particular, the case was pro-vided with standard LEMO connectors (see Figure 1A) to make the connection operations easier and safer than with bare cells (used in the previous RR). The four-wire connection configuration (Kelvin probe) was used for them. Moreover, the solid-metal case assured good thermal conductivity between the cell and the external surface,
facilitating its temperature control during I V and SR measurements.– A Pt100 temperature sensor was also integrated inside the case close to the solar cell and was connected to the outside via a LEMO con-nector. In order to avoid misconnections, the LEMOs were labelled PV for the cell and RTD for the Pt100 (see Figure 1A). Some con-necting cables and adapters to banana connectors were provided as well, in order to improve the reproducibility of the measurements and broaden the connection options for the participants.
The five PV cells were made by Jülich Research Centre according to previously published procedures.37,38An initial pre-conditioning of the cells by light-soaking for 300 kWh in open circuit and at device temperature of 50C was made at Jülich prior to the shipping to ESTI.
However, as part of the standard procedure for thin-film PV device calibration at ESTI, all five cells were light-soaked once more at ESTI according to the IEC 61646 requirements39before the reference
mea-surements (see Section 2.4.2).
2.2
|
Organisation and protocol of the RR PT
As mentioned above, the purpose of the RR PT was to evaluate the capability of the participating laboratories in testing thin-film MJ PV cells (described in Section 2.1) by using their procedures and facilities. As the IEC standards for MJ PV devices11,12were not yet published at
the beginning of the RR (although under advanced stage in the approval process40,41), the RR also aimed at collecting information
about the possible improvements to be adopted in the measurement procedures as applied to MJ PV devices by laboratories active in European projects.
The RR was organised within the CHEETAH project33as a PT for
13 participating laboratories, also building on a failure analysis of the SOPHIA project's RR and on prior experience in interlaboratory comparisons.21 23,25– The reference measurements were
indepen-dently provided by ESTI, which calibrated all devices at the beginning of the PT (see Section 2.4). The devices were again shipped to ESTI at the end of the RR PT for a final verification and calibration. The
standard ISO/IEC 1704334was taken as guideline for the evaluation of the participants' results, as already done in previous similar exer-cises for PV.23,25
As initiator of the RR within the CHEETAH project, Helmholtz-Zentrum Berlin (HZB) acted as the coordinator (but not as the official provider in the sense of ISO/IEC 1704334) of the RR PT, although it
was also a PT participant. This double role of one participant is usually avoided in PTs organised by official PT providers for testing laborato-ries, in order to assure unbiased results assessment. However, two elements allowed considering HZB position not detrimental to the good development of this specific RR. First, HZB's double role had been taken into account within the CHEETAH project, with no objec-tion by any participant. Second, although the participants' results were submitted to both the coordinator and ESTI, the data analysis of the overall RR PT was made by ESTI, with no disclosure of the RMPT cali-bration value before the end of the project.
A guideline was circulated to the participants before the begin-ning of the RR, with instructions on how to handle the DUTs and which type of information was needed in order to compare each par-ticipant's results to the RMPT values by ESTI. The participants were required to test each DUT at STC according to their standard proce-dure for the specific type of DUT. In particular, they were asked to apply their usual procedure for testing MJ PV devices, with possibly incomplete or incorrect steps in the specific applied procedure. How-ever, identifying such insufficiencies was also part of the study, all-owing a realistic verification of the capability of the participants in terms of facilities and procedures and the identification of possible areas for measurement improvements and best practices sharing.
In addition, as not all laboratories could perform an adequate pre-conditioning of the PV cells before testing them, it was agreed that all participants should measure the DUTs without further stabilisation (other than the one performed at ESTI before the reference calibra-tion). This could affect the measurements at successive laboratories if changes related to metastability of the devices occurred, but at the time of the RR organisation it was considered a balanced approach to verify the measurement procedures at the laboratories without affect-ing the duration (and the cost) of the overall RR PT. To monitor possi-ble exposure to high temperatures during the shipments, which might alter the stabilisation state of the a-Si based PV cells, the devices were provided with irreversible thermal-sensitive labels attached to their case (see Figure 1B) in Section 2.1), and the participants were asked for reporting any indication of heat excess. No mechanical monitoring was used to identify mechanical shocks during transportation, because the latter was considered a less likely threat for these robustly encapsulated thin-film cells.
In general, the procedure to attain STC for I V measurement can– be done eithera priori, by adjusting both intensity and spectrum of the solar simulator with a spectrally-matched reference cell (RC) (in this case, necessary for all types of DUTs regardless of the number of junctions), ora posteriori, by applying the SMM correction,6 which in the case of MJ PV has to be the one calculated for the limit-ing junction (defined in Section 2.1). In the case of ana posteriori cor-rection, the SMM had to be submitted, too. It was also requested to T A B L E 1 List of the measured DUTs, including for each of them
the PV technology and the device limitation (where applicable) as declared by the manufacturer
Device ID PV technology of the solar cell Nominal junction limitation RR81 Amorphous silicon (a-Si) Not applicable RR82 Micro-crystalline silicon
( c-Si)
Not applicable
RR83 Tandem (a-Si/ c-Si) Nominally top-junction limited
RR84 Tandem (a-Si/ c-Si) Nominally bottom-junction limited
RR85 Tandem (a-Si/ c-Si) Nominally matched
Note: For the junction-limitation certified by ESTI, see Table S1 in the supporting information.
Abbreviation: PV, photovoltaic.
indicate which junction was found limiting for the tandem cells. Beside I V curve measurements, SR data were required in the case SR– measurement was part of the laboratory's procedure. For the MJ PV cells, the information to be submitted for SR measurements included the bias voltage applied to the DUT as well as the bias light spectrum. Finally, all the four main I V parameters, namely, short-circuit current– ISC, open-circuit voltage VOC, maximum power Pmaxand fill factor FF
had to be reported together with a measurement uncertainty (UC) estimate.
The guideline included also a description of the devices to be measured (see Section 2.1) with their nominal characteristics as assigned by the producer. In this way, a suitable voltage limitation could be used during the I V measurements in order to avoid damag-– ing the thin-film cells by reverse overcurrent.
2.3
|
Participants
The laboratories participating in the RR PT were 13 (see Appendix A). Each of them had its own facilities and expertise to test MJ PV devices. All of them used a solar simulator to measure the I V curves.– Some of them did not adjust the solar simulator other than for total irradiance as read by a c-Si RC. Three quarters of the laboratories measured the external quantum efficiency (EQE) (or the SR) of the DUTs, but only very few of them corrected spectral deviations from STC in the I V measurements by considering the measured actual SR– of the DUT. Finally, about only one third of those who measured EQE applied a bias voltage to the EQE measurement of the MJ PV DUTs. A more detailed summary of the facilities and procedures available at the time of the RR PT is given for each participant in Appendix A.
2.4
|
ESTI measurements
Before the start of the RR, the STC calibration of the five cells was performed at ESTI in January 2016. These five calibrations were the reference measurements of the RR PT(RMPT); against their values, the results submitted by every participant to the RR PT were compared. A verification at the end of the RR was also made at ESTI in the form of a calibration, although those measurements were not used to assign the RMPT value but just to verify the actual stability of the devices. Indeed, reliable measurements, repeated at the same laboratory at least at the beginning and at the end of a RR, can help explaining pos-sible deviations of the participants' results if related only to their posi-tioning within the temporal sequence of the RR PT.
2.4.1
|
ESTI setups
ESTI used a Wacom steady-state solar simulator42 for the I V
– measurement of the cells. The RC used for the DUTs was an unfiltered c-Si calibrated RC (ESTI code: PX305C), except for RR81 for which a filtered c-Si calibrated RC was used (ESTI code: PX301A). Both RCs are secondary references at ESTI, under the meaning of the traceability chain, and traceable to the WPVS.28 Their
absolute SR is shown in Figure 2. The vertical positioning of the temperature-controlled plate used to thermalise the devices was adjusted in relation to the device mounted (RC or DUT) to maintain the same test plane for both. The ESTI procedure to measure I V– curves at the Wacom requires keeping its shutter closed in order to allow for stabilisation of the DUT's temperature. When the latter is achieved, the shutter is opened to illuminate the DUT for 3 to 5 seconds before the I V curve (made of 100 points) is acquired in 1 s.–
For the SR of the five DUTs, the ESTI's semi-automatic home-built setup named Oriel (after the solar simulator providing the light source) was used.43In short, the white light of its Xenon source is fil-tered by interferential bandpass filters (typical FWHM between 10 nm and 20 nm) and reaches the DUT and the RC after passing a chopper and an optics that ensure that both devices are fully over-illuminated. The wavelength associated to each filter is periodically
F I G U R E 1 One example of the encapsulated PV solar cells, with connectors for temperature (RTD) and electrical (PV) characterisation (A) and thermal-sensitive labels (B) [Colour figure can be viewed at wileyonlinelibrary.com]
F I G U R E 2 Absolute SR data of the five PV DUTs as certified by ESTI calibration at the beginning of the RR PT. The error bar drawn for each measured point represents its stated combined expanded UC ( = 2) in absolute units. Lines drawn to connect the individualk measured points of the DUT SRs are merely shown to help the reader's eye and do not represent neither measured data nor actual interpolation between them. The interpolated SR of the RCs (PX305C and PX301A) used to calibrate them is shown, too. [Colour figure can be viewed at wileyonlinelibrary.com]
verified at ESTI by a double-beam spectrophotometer. The wave-length calculated from the measured transmissivity is used as the actual abscissa value for the SR data point. The filters are mounted on several wheels, each of which hosts 16 positions. Depending on the PV device and technology to measure, two or more wheels are mounted in the setup sequentially, and the signal corresponding to each wavelength is measured by a lock-in technique for both DUT and RC simultaneously. While the SR measurement proceeds, each measured data point is added to the SR graph shown to the operator on the screen. In this way, an immediate qualitative check can be made and the operator can select the more appropriate filters to fill the gaps in the SR curve, especially where steep features occur. The wavelengths are always selected to adequately cover the entire wavelength range of the DUT's SR as well as to allow an appropriate interpolation (with 1-nm step) of the measured data points by Hermite polynomial; the interpolated data set is then used for further calculations, e.g. for the SMM estimate. For SJ PV cells, broadband dichroic halogen lamps were used as bias light. For the three MJ PV cells, a pair of LEDs was used to bias the junction not under test, and a power supply was used to apply the bias voltage. More detailed description of the setup and measurement procedure is given in Section 2.4.3.
2.4.2
|
Pre-conditioning before calibration
Before the actual calibration measurements, the cells went through the ESTI procedure for their pre-conditioning, which was carried out according to IEC 6164639 between December 2015 and January
2016. Such a procedure is based on international standards developed at the IEC. In particular, at the time of the start of the RR, the standard IEC 6164639for design qualification of thin-film PV technologies was
in place and therefore applied before the RMPT. As first step, STC measurements at the Wacom steady-state solar simulator of ESTI were performed to set the initial state of each DUT. Although it was not required by the pre-conditioning procedure according to IEC 61646,39the SR before the pre-conditioning was measured as well in order to (i) calculate the SMM to be applied to the I V measurements,– (ii) identify the limiting junction of the tandem DUTs before pre-conditioning and (iii) verify if any change to the limiting junction could occur due to the light-soaking procedure. Each DUT was then con-nected to a resistor, which was sized to keep the DUT approximately at the maximum power point as calculated from the initial I V curves.– The DUTs were finally mounted on a dedicated holding structure and put in a ventilated light-soaking chamber for a total of about 234 kWh, divided in three steps. The temperature of each DUT was constantly monitored by a calibrated Pt100 sensor attached to the DUT case and connected to a calibrated temperature reader. The tem-perature was maintained at (45 ± 5)C for the whole pre-conditioning.
The first pre-conditioning step had to be particularly long (about 133 kWh) due to temporary unavailability of the Wacom solar simula-tor. The second and the third lasted about 50 kWh each. At the end of each light-soaking step, the five DUTs were disconnected from their
load, tested at STC at the same solar simulator and with the same RC as in the initial measurements and finally repositioned in the light-soaking chamber to continue the pre-conditioning. As these interme-diate measurements are only relative measurements and the Wacom irradiance is known to be stable from periodic characterisation, no SMM correction was applied to them, and the criterion for stability check39was verified by comparing the maximum power values as
cal-culated directly from the measured I V curves.–
For the sake of completeness and guidance to the reader, it is worthy to note that the CB value for a MJ DUT can generally be expected to change whenever the SRs of the junctions of which it's composed change relatively to each other during the pre-conditioning. However, the relevance of this possibility and the need for its verifica-tion should always be evaluated in relaverifica-tion to the purpose of the mea-surements to be performed. On the basis of the SR meamea-surements made by ESTI and of the spectra of the Wacom solar simulator, all measured before and after the pre-conditioning of the DUTs, the cal-culated CB values showed changes due to pre-conditioning in a range from about 14.6% to about 7.5%, depending on the DUT and on the− spectrum (i.e., AM1.5 or Wacom's) considered. The summary of the CB values and the relevant information used to calculate them is reported in Table S2 of the supporting information together with the Zifactor defined in IEC 60904-1-1.11The absolute SR of the stable
DUTs is shown in Figure 2; the normalised EQEs of the DUTs calcu-lated from ESTI SR measurements before and after the pre-conditioning are reported in Section 3.2 (Figures 8, 9 and 10), which is specifically dedicated to the SR results of the RR PT. The two spectra of the Wacom and the AM1.5 reference spectrum are shown in Figure S1 of the supporting information. Finally, it must be noted that no attempt was made to improve the balance of the Wacom's spec-trum beyond what was already its status in the case of the measure-ments before the pre-conditioning, as the I V measuremeasure-ments on the– as-received DUTs were just used for stabilisation purposes and ESTI did not issue any calibration certificate on the basis of those measurement results.
2.4.3
|
Reference measurements of the RR PT
Once the DUTs were deemed electrically stable, their calibration at STC was performed. The latter was based on I V curve measurements– carried out at the Wacom solar simulator against a calibrated WPVS-traceable c-Si RC (ESTI code: PX305C) for all devices but the a-Si RR81, for which a calibrated WPVS-traceable filtered c-Si RC (ESTI code: PX301A) matched to the DUT was used.
Each device was mounted in turn on a Peltier temperature-controlled plate to keep it thermally stable at (25.0 ± 0.5)C. The
device was let stabilise with the plate and in the dark before proceed-ing with the measurements. As no traceability to SI units could be assured by ESTI for the internal temperature sensor of the RR cells, the device temperature was measured by a calibrated Pt100 sensor attached to the side of the case and as close as possible to the cell. The Pt100 sensor was in turn connected to a calibrated temperature
reader, whose reading was recorded together with the electrical char-acteristics of the DUT. The inevitable small but not negligible temper-ature rise after the DUT exposure to irradiance and the tempertemper-ature gradient between the measurement point and the junction are included in the combined expanded UC ( = 2) stated with the ESTIk calibration value of each DUT.
The total irradiance was set beforehand to be as close as possible to 1000 W/m2, with a deviation of 4 W/m
−
2for all DUTs but the a-Si
one, for which a maximum deviation of 25 W/m−
2was achieved, as
measured by the relevant calibrated RC before and after the I V– measurements. The spectral content of the Wacom's beam between [300; 2500] nm is periodically checked at ESTI by a traceably calibrated spectroradiometer and, if necessary, readjusted to AM1.5 by balancing the component beams produced by its double-lamp sys-tem. However, in the case of this RR PT, the spectral irradiance mea-surement was also specifically performed in the limited wavelength range [300; 1200] nm by means of the calibrated spectroradiometer (OL750, traceable to SI units via a calibrated standard FEL lamp, which is traceable via the UK's National Physical Laboratory (NPL)) immedi-ately before the calibration of the cells.
In order to complete the set of measurements necessary for the calibration of the five DUTs, a SR measurement was performed for each of them according to the specific ESTI procedures, which make use of the lock-in technique. ESTI procedures follow the relevant standard for SJ SR7or MJ SR12measurements, depending on the case.
In particular, although the IEC 60904-8-1 was not yet published at the beginning of this PT, ESTI procedure was covered by the laboratory's ISO/IEC 17025 accreditation; also, it already reflected one of those now included in the IEC 60904-8-1, because ESTI con-tributed pre-normative work to the standard and led the development of both IEC standards for testing of MJ PV devices.
The SR of the SJ DUTs was measured against a calibrated c-Si RC (ESTI code: PX302C, whose absolute SR is traceable via PTB) by applying white bias light produced by halogen lamps and no bias volt-age.43The SR of the double-junction DUTs was measured at the same facility and against the same RC, but by applying bias light from two pairs of LEDs with emission lines around 860 nm to measure the top junction (i.e., bottom-junction activation) and around 410 nm to mea-sure the bottom junction (i.e., top-junction activation). A specific level of bias voltage, necessary to bring and keep the junction under test to short-circuit current conditions during SR measurement of MJ PV,12
was applied to each junction of each MJ DUT. According to ESTI pro-cedure, the value of the bias voltage was determined for each junction of each tandem DUT separately. First, the voltage at the terminals of the electric circuit consisting of the DUT plus a dedicated stable power supply (set initially at 0 V) was measured with a calibrated digi-tal voltmeter. This voltage measurement was carried out while the DUT was kept under bias-light condition only (i.e., no AC component from the chopped quasi-monochromatic light of the SR system). In general, such a voltage accounts for the actual voltage as produced by the junction(s) not under test, plus an insignificant contribution due to the actual connections involved. The voltage measured in this way was then brought to zero by adjusting the output of the power supply,
while keeping the latter connected to the DUT and the voltmeter. Once the balance condition between the voltage from the DUT and the opposite one from the power supply was achieved, the two termi-nals of the above-mentioned electric circuit were disconnected from the voltmeter and connected to a calibrated precision shunt across which the DC + AC signal was then measured. A final check was made by connecting the voltmeter in parallel to the precision shunt in order to verify that the voltage drop across the shunt itself was less than 3% of the initial voltage as previously measured under bias light con-ditions only. For all SR measurements, the DUTs as well as the RC were mounted on a dedicated temperature-controlled plate in order to keep them at (25.0 ± 1.0)C. The absolute SR data used for the RMPT
cali-bration are shown in Figure 2 for all five DUTs. The error bar drawn for each measured point represents its stated UC in absolute units. Lines drawn to connect the individual measured points of the DUT SRs are merely shown to help the reader's eye and do not represent neither measured data nor actual interpolation between them. Interpolated SR curves of the unfiltered (PX305C) and filtered (PX301A) c-Si RCs used to calibrate the DUTs are shown as well, in order to give a visual com-parison of the difference between the RCs and the DUTs.
The calibration of each DUT was then completed by correcting the measured I V curves with the relevant SMM. In the case of a MJ– DUT, the SMM calculated for the limiting junction was applied to cor-rect the I V curves and issue the calibration value. Corcor-rection for– series resistance was not performed, as the I V measurements were– made at (25.0 ± 0.5)C and at 1000 W/m2± 30 W/m2, which at ESTI
is taken as boundary for mandatory correction for series resistance on the basis of experience. The calibration results, which represent the RMPT values for each device, are summarised in Table S1 (in the supporting information) together with the SMM applied to the mea-sured I V curves and the limiting junction for each of the tandem– cells. One example of the measured I V curves for each DUT is also– shown in Figure S2. The curves reported in Figure S2 are those as measured directly on the solar simulator and corrected to a total irra-diance of 1000 W/m2according to IEC 60891.5There is no correction point-by-point for irradiance fluctuations of the data in the I V curve,– because the solar simulator has a stabilised output (using an optical sensor and electrical feedback circuit). The variation of total irradiance between its measurement by the RC just before the I V curve acquisi-– tion and its values during the actual I V curve is considered as an UC– component, which however gives a minor contribution to the expanded combined UC ( = 2).k
For the sake of completeness, it has to be noted that the SR of the c-Si device (RR82) is significantly different from both the one that the c-Si bottom junction presents inside the tandem DUT and the one of an unfiltered c-Si RC, as clearly visible in Figure 2. The major difference with the bottom junction of the tandem DUT is due to the filtering effect that the top junction of the tandem devices has on the incoming irradiance. Consequently, one cannot assume that the c-Si bottom junction has a SR similar to the SJ c-Si device and a specific spectral correction has to be made in order to correctly cali-brate the MJ PV device that includes a c-Si junction. The same is valid when testing the SJ c-Si device against a c-Si RC.
2.4.4
|
Verification and calibration at the end of
the RR PT
At the end of the RR PT, the cells were returned to ESTI for a final verification of their stability state (as they arrived) and for an addi-tional calibration after a further pre-conditioning of 170 kWh. A full set of measurements was carried out as for the RMPT, except for the SR measurements before the new stabilisation, which were not per-formed. It was assumed that no significant change in the relative SR could have been introduced to the DUTs after the initial stabilisation and during the RR PT. Both sets of ESTI measurements performed at the end of the RR PT served mainly as comparative measurements with respect to the RMPT. The verification made when the cells ret-urned to ESTI was considered useful to set a freshly and indepen-dently verified state of the DUTs, which for example could give additional information to explain part of the deviations from the RMPT value if a systematic trend were to be observed in the temporal sequence of the results. After the initial measurements, all five DUTs went through the same light-soaking procedure as explained in Sec-tion 2.4.2, with the excepSec-tion that the standard IEC 61215-1-344was
used as reference instead of the IEC 61646. Indeed, in December 2016, the latter was withdrawn and replaced by most of the parts of the new IEC 61215 series45; in particular, a-Si PV devices are now
subject of the IEC 61215-1-3.44
2.5
|
Methodology for results assessment
As mentioned above, the methodology used to assess the participants' results against the reference value was based on the standard ISO/IEC 1704334and on previous experience.21 23,25– The comparison of each
result to the RMPT value was originally meant to be done by consid-ering the UC of the measurements for each measurand, as stated by each laboratory according to its own method to estimate it. Ideally, the assessment of the PT results would be carried out by calculating— for each measurand and submitted value one— Ennumber as defined
in ISO/IEC 17043 and explained for example in freely accessible refer-ences.23,25,46 However, this advanced methodology could not be
applied to this RR PT due to the lack of any UC statement for 7 labora-tories out of 13 participating, regardless of their level of expertise or quality of their facilities. Therefore, only simple percentage deviation from the RMPT value was calculated and is reported here for results as submitted by each laboratory.
3
| PT RESULTS AND DISCUSSION
3.1
|
Electrical parameters assessment
For each laboratory and device, the percentage deviations in ISC, VOC,
PmaxandFFfrom the relevant RMPT value were calculated; they are
reported in one graph per device in the following subsections. In the graphs, the UC of the RMPT value is shown as a shaded area
symmetrically drawn around the -axis. The RMPT's UC is shown onlyx for Pmax(light-grey area) andFF(dark-grey area) to limit the
complex-ity of the graphs while preserving the relevant information. Indeed, in the graph, the area of the ESTI UC for ISCwould be slightly narrower
than that of Pmax, and the one for VOCwould almost disappear within
the -axis line.x
In addition, also the measurement UC stated by each laboratory, when available, is reported for each measurand as error bar around the submitted value. In this way, for those who reported a measure-ment UC, a better representation of the agreemeasure-ment of their submitted value to the RMPT value is presented. In few Pmaxcases, the error
bars are hidden by the size of the marker. However, these occur-rences can be usually and easily spotted because the error bars of the other parameters are reported by the same laboratory. When the result's error bar does not overlap the UC bar of the corresponding RMPT value, the submitted result has to be carefully reconsidered together with its UC and measurement procedure. However, also UC bands slightly overlapping might be not enough, as only the actual cal-culation of the Ennumber can assess whether a result agrees or not
with the reference value within its stated UC.
As general rule applicable to this RR PT (where only some labo-ratories have submitted UC with their results), a full agreement to the RMPT value is obtained either when the submitted result is within the UC band of the RMPT value or when the Ennumber that
can be calculated with the UCs is within [ 1; 1]. Considering the− variety of expertise and facilities involved in this RR PT, in the assessment of the results, we have considered a deviation's thresh-old of ±5% as representing still a reasonable UC for the majority of the laboratories. A submitted result falling within this threshold would be considered still satisfactory in this RR PT, although it might be beneficial for the laboratory to revise the UC and/or the procedure to improve the agreement with the RMPT value. Any value outside of this threshold requires careful evaluation and revi-sion of both the UC calculation and the measurement procedure, including the equipment.
To keep anonymity of the results, each laboratory is represen-ted in the graphs by one number on the -axis, which scales fromx 1 to 13. It has to be noted, though, that the number identifying one laboratory is not necessarily always the same for all five figures. Indeed, in order to ensure the highest level possible of anonymity, the ranking criterion chosen to sort the laboratories is given by the percentage deviation of the submitted Pmax value from the RMPT
value. Since such a deviation can vary for the same laboratory from DUT to DUT, it also makes the sorted list vary for each DUT. In fact, this is to be expected when no systematic errors affect the measurements of the participants. In addition, the sign of the devia-tions is explicitly considered. As consequence of all this, position 1 on the -axis of each graph is assigned to the laboratory with thex largest negative (or smallest positive) percentage deviation of Pmax
from the RMPT Pmaxvalue for that DUT; equally, position 13 is
assigned to the largest positive (or smallest negative) percentage deviation from the RMPT Pmaxvalue for that DUT. The positions in between are assigned in order of increasing deviation.
3.1.1
|
RR81 (a-Si SJ DUT)
Figure 3 shows the percentage deviations of the submitted results from the RMPT values for the DUT RR81 (a-Si). The EU and ES values correspond to the ESTI measurements made at the end of the RR PT before and after the pre-conditioning, respectively. The light-blue-shaded area helps in separating them from the results of the RR PT participants, too. Only three laboratories (#8, #9 and #10) out of 13 participants have submitted a result for Pmax,
consid-ered together with its UC, that is within the UC of the RMPT value. If we set an arbitrary threshold at ±5% of the RMPT value, only two additional Pmaxvalues (#11 and #12) are within that threshold.
Among the remaining participants, the results of four laboratories (#1, #3, #5 and #6) were biased by an electrical issue occurred at #1, which affected the DUT and therefore the measurements of all the following participants to the PT. For these four laboratories, it is clearly visible that the large deviation in Pmaxis correlated to a similar
large deviation in FF.AlthoughFFis just a derived parameter, that is, calculated from a ratio of the measured maximum power to the ideal one, it is also strongly affected by bad electrical connections to the DUT and/or by bad collection of charges inside it. The ISC and VOC
deviations, instead, are generally much smaller for all four and within −2.7% for the three laboratories following the accident. Therefore, it is reasonable to deduce that the agreement of their Pmaxresults with
the RMPT value could have been much better if the electrical issue had not occurred.
For the remaining four laboratories (i.e., #2, #4, #7 and #13), which were not affected by the mentioned electrical issue, the devia-tion in Pmaxis strongly connected to the deviation in ISC, which is well
beyond ±5% of the RMPT value. This is likely related to issues with SMM correction. They can originate from two sources. The first is the use of non-spectrally matched RC together with no or insufficient SMM correction (e.g., due to the test spectrum used to calculate SMM). The second is the incorrect or incomplete adjustment of the solar simulator spectrum, which in turn can be linked again to issues with the RC(s) used to adjust it. Laboratory #2 did not measure the EQE and did not adjust the spectral irradiance of the solar simulator used for the I V curve measurements. Therefore, no spectral correc-– tion was applied neither a priori nor a posteriori. Laboratory #4 pro-vided UCs, which are however so small that they are not visible in the graph. At this laboratory, there seems to be no issue neither with VOC
nor withFF, so the large deviation inPmaxand ISCis extremely likely to
be due to SMM correction (eithera prioriora posteriori) or incorrect calibration of the RC. Laboratories #7 and #13 corrected (either a priori or a posteriori) the I V curve measurements for SMM, but it is– clear that the procedure to achieve the SMM correction, the RC calibration value or a combination of these two did not lead to a satisfactory result.
Finally, for the sake of completeness, it has to be noted that no pre-conditioning of the DUT was done at the participants' premises because not everybody could do it. As a-Si is intrinsically unstable and the RR lasted more than 1 year, it could also be expected that the degradation of the a-Si stable state achieved at ESTI at the beginning of the RR partially affected the results of some of the last laboratories in the RR progression. A deviation of 3.6% in− Pmaxfrom the RMPT
value was measured at ESTI (EU in Figure 3) at the end of the RR, when the DUT returned there, and before any further pre-conditioning to take it back to a stabilised state. The additional stabilisation brought this DUT to a Pmaxvalue 10.9% (ES in Figure 3)− smaller than the RMPT value, showing a significant change in the elec-trical performance of the device. However, the long-term degradation before any additional stabilisation ( 3.6%), which also accounts for− the mentioned electrical issue, cannot explain the deviation of the lab-oratories beyond the ±5% threshold (excluding those affected by the issue at laboratory #1), because laboratories #2, #4, #7 and #13 per-formed their measurements quite early in the RR. Thermal issues to the cells during the several shipments can also be excluded as possible source of the deviation of these laboratories, because the thermal sensitive labels attached to the cells were still unaltered when the DUTs arrived at laboratory #1. Therefore, a possible spectral issue should be investigated and a more complete UC analysis performed at laboratories #2, #4, #7 and #13.
3.1.2
|
RR82 ( c-Si SJ DUT)
Figure 4 shows the results for RR82, which is the c-Si DUT. The EU and ES values correspond to the ESTI measurements made at the end of the RR PT before and after the pre-conditioning, respectively. The light-blue-shaded area helps in separating them from the results of the RR PT participants, too. For four laboratories (from #4 to #7), the submitted value for Pmaxagrees with the RMPT value either within
F I G U R E 3 Percentage deviations from ESTI RMPT value for ISC,
VOC, PmaxandFFof RR81 (a-Si). RMPT value is represented by the
x-axis, and its combined expanded UC ( = 2) is shown for simplicityk only for Pmax(light-grey-shaded area) andFF(dark-grey-shaded area).
The error bars shown represent the UC of the submitted result as stated by the participant. The EU and ES values correspond to the ESTI measurements made, respectively, before and after the pre-conditioning at the end of the RR PT. An inset is shown for the points falling outside the main range of the deviations. Note that the laboratory identification number may be different for the DUTs [Colour figure can be viewed at wileyonlinelibrary.com]
their own UC (as for #4) or because the value itself, although submit-ted without UC, is within the UC band of the RMPT value (as for #7).
Among the other participants, seven out of 13 are beyond the RMPT UC for Pmaxbut within the arbitrary threshold of ±5% of the
RMPT value. Due to lack of UC information, no additional comment can be made except that the value submitted by laboratory #8 is 0.2% above the UC band of the RMPT value and that the submitted ISC value is within the UC of the RMPT value (UC band not shown
in the graph). Therefore, it is reasonable to assume that, including realistic UC for the submitted results, laboratory #8 would also agree with the RMPT value. The last two laboratories out of 13 are beyond ±5% but within ±10% of the RMPT value, and their stated UCs clearly show that the procedure and/or the UC estimate should be reanalysed. For most laboratories, though, there seems to be in general some inaccuracy or incompleteness in the spectral correc-tion of the measurement (achieved either a priori or a posteriori) and/or in the calibration value of the RC(s) used to set the solar simulator. It is difficult to say for which laboratory this is fully valid and for which this is only a matter of missing UC information. How-ever, apart from the four above-mentioned laboratories that agree with the RMPT value and for laboratory #8 whose ISCleads to
con-sidering sensible a possible agreement if reasonable UC were pro-vided, for all others the deviation of ISC from the RMPT value is
beyond ±3% and its causes should be carefully analysed by the individual participants.
The change in Pmaxmeasured at ESTI at the end of the RR PT was
+3.9% (EU in Figure 4), which after further stabilisation went down to +0.5% (ES in Figure 4). The latter value is well within the UC of ESTI measurement. However, from the temporal sequence of the laboratories (not shown here), none of them submitted a deviation
that can be explained by such a degradation in relation to their temporal positioning.
Finally, it is worthy to note here that this DUT has SR closest to the SR of a typical c-Si RC in comparison to all other DUTs (see RR82 in Figure 2). However, it would be wrong to assume that no SMM cor-rection were needed, as SMM is a measurement of both how far the SR of the DUT is from that of the RC as well as how much the test spectrum differs from the reference AM1.5. This is evident for labora-tory #1, which did not correct for spectral deviations from STC nei-ther a priori nor a posteriori and whose measurement UCs are not sufficient to explain the deviation from the RMPT value for neither Pmaxnor ISC.
3.1.3
|
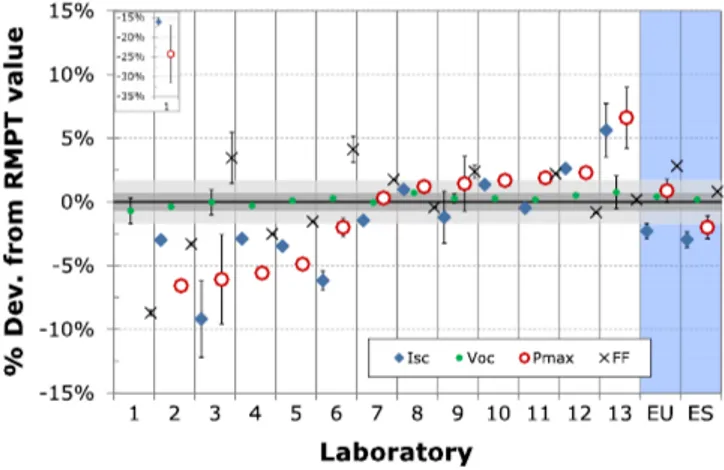
RR83 (a-Si/ c-Si MJ DUT)
Figure 5 reports the results for RR83, which was nominally labelled as the top-limited DUT (see Table 1) and certified by ESTI as such at the beginning of the RR (see CB in Table S2 in the supporting informa-tion). The EU and ES values correspond to the ESTI measurements made at the end of the RR PT before and after the pre-conditioning, respectively. The light-blue-shaded area helps in separating them from the results of the RR PT participants, too. Among the participants, only three laboratories (#4, #5 and #6) agree with the RMPT Pmax
value: the first two directly because they are within the UC band of the RMPT value; the third one because its UC almost intersects the RMPT value and the Ennumber is 0.87, which represents agreement
with the RMPT value (one can refer for example to open-access peer-reviewed references23,25,46 for the E
n number calculation). The
F I G U R E 4 Percentage deviations from ESTI RMPT value for ISC,
VOC, Pmax andFFof RR82 ( c-Si). RMPT value is represented by the x-axis, and its combined expanded UC ( = 2) is shown for simplicityk only for Pmax(light-grey-shaded area) andFF(dark-grey-shaded area).
The error bars shown represent the UC of the submitted result as stated by the participant. The EU and ES values correspond to the ESTI measurements made, respectively, before and after the pre-conditioning at the end of the RR PT. Note that the laboratory identification number may be different for the other DUTs [Colour figure can be viewed at wileyonlinelibrary.com]
F I G U R E 5 Percentage deviations from ESTI RMPT value for ISC, VOC, PmaxandFFof RR83 (a-Si/ c-Si). RMPT value is represented by the -axis, and its combined expanded UC ( = 2) is shown forx k simplicity only for Pmax(light-grey-shaded area) and FF
(dark-grey-shaded area). The error bars shown represent the UC of the submitted result as stated by the participant. The EU and ES values correspond to the ESTI measurements made, respectively, before and after the pre-conditioning at the end of the RR PT. An inset is shown for the points falling outside the main range of the deviations. Note that the laboratory identification number may be different for the other DUTs [Colour figure can be viewed at wileyonlinelibrary.com]
agreement in ISC(for #5 because it is within the UC band of the RMPT
value for ISC) fully confirms this.
Of the other 10 participants, 5 (from #7 to #11) are within the arbitrary threshold of ±5% of the RMPT Pmaxvalue. If we analyse their
deviation of ISCin addition to the one for Pmax, we find that both
labo-ratories #7 and #8 have submitted ISCvalues that deviate from the
rel-evant RMPT value less than its UC. Therefore, they do agree for ISC
with it. While laboratory #8 did not submit any UC for Pmax,
labora-tory #7 did submit a PmaxUC that seems to be somehow
under-estimated. Within the same group of five laboratories, #9 and #11 might benefit from a reanalysis of the procedure for the (a prioriora posteriori) spectral correction because the deviation of their submitted value of ISC is just above the UC band of the relevant RMPT value
(0.6% and 0.3%, respectively). For the remaining laboratory (#10) of this group as well as (and especially) for those beyond the ±5% thresh-old, the results show the necessity to carefully reconsider their proce-dure for MJ testing, with clear evidence that the correction for spectral effects (either from the SR of the DUT or from the spectrum of the solar simulator) is not adequately performed.
The Pmax change for this cell during the RR PT was of +4.5%
(EU in Figure 5), which returned to +0.0% after the final stabilisation (ES in Figure 5). None of the laboratories that show deviations beyond ±5% can relate them to this because of their positioning in the RR PT temporal sequence.
3.1.4
|
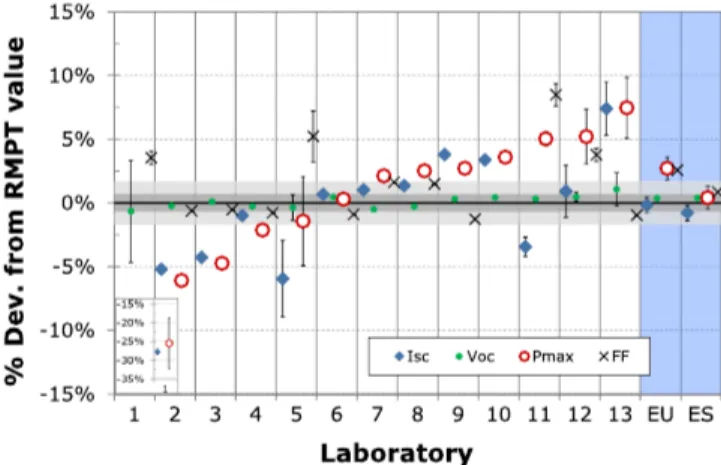
RR84 (a-Si/ c-Si MJ DUT)
Figure 6 gives the results for RR84, which was nominally labelled as bottom-limited (see Table 1) and certified by ESTI as such at the beginning of the RR (see CB in Table S2). However, this cell showed CB closest to unity among the three MJ DUTs and even a change in the limiting junction at the end of the RR according to ESTI final verification (not shown here). This might have influenced some of the laboratories' results, especially in those cases where a complete correction for all spectral contributions to the I V measurement was– either not accurately or not at all performed. The EU and ES values in Figure 6 correspond to the ESTI measurements made at the end of the RR PT before and after the pre-conditioning, respectively. The light-blue-shaded area helps in separating them from the results of the RR PT participants, too.
Coming to the results, four participants out of 13 (from #7 to #10) submitted results for Pmax that agree with the RMPT value
because the submitted value itself is within the RMPT value's UC band. Of the other nine laboratories, laboratory #6 submitted a Pmax
value that is beyond the UC band of the RMPT value and whose stated UC intersects that band. However, the overlap of the UCs is not enough to achieve agreement with the RMPT value because the Ennumber that can be calculated is 1.1. Moreover, as the disagree-− ment of #6 in ISCis significant ( 6.2%) and only partly compensated− by the opposite disagreement inFF, it is strongly recommended that this laboratory verifies the correctness of the MJ testing procedure as applied here. Laboratory #11 submitted a value for Pmaxthat is 0.2%
above the UC band of the RMPT value, but it did not submit any UC. However, looking at the agreement ( 0.5%) of the submitted− ISC
with respect to the relevant RMPT value, there seem not to be signifi-cant issues with the spectral components at ISCconditions, but rather
some cause that influenced theFFmeasurement. For MJ PV devices, though, it has to be noted that theFFis also connected to a correct balancing of the spectral components of the solar simulator's light and this is even more relevant if no check is done on the basis of the actual spectrum used for the I V measurement and of the actual SRs– of the DUT and RC. Two other laboratories (#5 and #12) are within the arbitrary threshold of ±5% of the RMPT Pmaxvalue, but they also
show significant deviation in ISC, which may identify the need to check
the measurement procedure and/or the calibration value of the RC(s). The remaining five laboratories submitted results that fall outside the ±5% threshold, although for most of them a reasonable UC estimate would make the submitted value of Pmaxcross it, as it happens for #3
and #13. However, for all of them, the strong deviation in Pmaxis
either directly connected to a similar significant deviation in ISCor to a
combination of the latter with an important deviation in FF. This requires a careful analysis of the SR of the actual devices involved in the testing, especially if the DUT shows current limitation of one junc-tion less pronounced than expected, as might have been the case here. Finally, the Pmaxchange for this cell during the RR PT was of
+0.9% (EU in Figure 6), on the basis of the measurements performed at ESTI when the cells returned there at the end of the RR PT and before further stabilisation. The Pmaxvalue measured at ESTI after the
additional stabilisation was 2.0% of the RMPT value (ES in Figure 6),− which can be partly related to the change found in the F I G U R E 6 Percentage deviations from ESTI RMPT value for ISC,
VOC, PmaxandFFof RR84 (a-Si/ c-Si). RMPT value is represented by the -axis, and its combined expanded UC ( = 2) is shown forx k simplicity only for Pmax(light-grey-shaded area) and FF
(dark-grey-shaded area). The error bars shown represent the UC of the submitted result as stated by the participant. An inset is shown for the points falling outside the main range of the deviations. The EU and ES values correspond to the ESTI measurements made,
respectively, before and after the pre-conditioning at the end of the RR PT. Note that the laboratory identification number may be different for the other DUTs [Colour figure can be viewed at wileyonlinelibrary.com]
limiting-junction for this DUT. This value is indeed at the limit of the agreement with the RMPT value according to the Ennumber
calcula-tion (En= 1.0).−
3.1.5
|
RR85 (a-Si/ c-Si MJ DUT)
Figure 7 shows the results for RR85, which was nominally a matched cell (see Table 1) and certified by ESTI as top-limited at the beginning of the RR (see CB in Table S2). The EU and ES values correspond to the ESTI measurements made at the end of the RR PT before and after the pre-conditioning, respectively. The light-blue-shaded area helps in separating them from the results of the RR PT participants, too. For this cell, only two laboratories (#5 and #6) out of 13 partici-pants submitted results that agree with the RMPT Pmaxvalue and its
UC band. However, among these two, laboratory #5 shows a signifi-cant deviation ( 6.0%) in− ISCwhich is just compensated by an
oppo-site deviation in FF, thus resulting in the agreement in Pmax. This
laboratory should analyse whether the causes for this deviation can be traced back to an incorrect procedure in the (eithera posterioriora priori) spectral correction for this DUT. Among the remaining laborato-ries, six submitted results for Pmaxthat are within the arbitrary
thresh-old of ±5% of the RMPT value. If we look at them jointly with the deviation in ISC, laboratories #4, #7 and #8 are outside the UC band of
the RMPT Pmaxvalue ( 0.4%, +0.4% and +0.8%), but also have sub-− mitted ISCvalues that are within the UC band of the relevant RMPT
value. In addition, the submittedFFvalues do not fall within the UC
band of the relevant RMPT value, but it is reasonable to assume that in all cases a sensible UC estimate associated with both Pmaxand FF
might make these results agree with the RMPT value. A similar rea-soning might be partly applicable to laboratory #9 and partly to labo-ratories #3 and #10; however, for all of them, the deviation in Pmaxis
accompanied by a similar deviation in ISC, which might be sign of
incorrect or incomplete evaluation of the spectral correction. The last five laboratories are all outside the arbitrary threshold of ±5% of the RMPT value, although laboratory #11 is just across it (+5.0%). However, this laboratory submitted UC together with the results (UC of Pmaxhidden by the marker's size), and they are not
suf-ficient to cover the deviations from the RMPT values. Therefore, it should analyse in more detail the causes at the origin of the resulting deviations, as they could likely derive from incomplete or incorrect spectral correction (eithera posterioriora priori), also looking at the deviation in ISC and FF. The deviation of laboratory #12 in Pmax,
instead, is not connected to a similar deviation in ISC, which shows
good agreement with the RMPT value, but essentially to the one in FF, which might indicate issues with the connections together with an incorrect balancing of the two relevant components of the spectral irradiance. For the remaining three laboratories (#1, #2 and #13), the deviation in Pmax is evidently associated to a similar deviation in ISC,
thus suggesting that these laboratories, as others to minor extent, should carefully evaluate their procedures and/or calibration value of the RC(s) for MJ testing.
The change in Pmax of this DUT during the RR PT was +2.7%
(EU in Figure 7), on the basis of the measurements performed at ESTI when the cells returned there at the end of the RR PT and before fur-ther stabilisation. The Pmaxvalue measured at ESTI after the additional
stabilisation was +0.4% of the RMPT value (ES in Figure 7), well within the UC of the measurement. Again, no laboratory of those outside the ±5% threshold can sensibly explain the deviation from the RMPT value in relation to its positioning within the temporal sequence of the RR PT.
3.2
|
SR measurements
Only a qualitative comparison was made for the SR of the DUTs because of the absence of results for some participants and, more importantly, because most of those available were submitted without UCs. The comparison is shown in the following as normalised EQE plots. The latter do serve to compare the qualitative agreement of the shape of the measured EQE (or SR) to the ESTI SR reference measure-ment, but they cannot be used to derive quantitative information on the SR of the DUTs in terms of absolute units. The shape of the EQE is enough, though, to evaluate the SMM correction of the I V curve– measurements for SJ PV DUTs; it is only one piece of the necessary information for MJ PV DUTs, for which the limiting junction should be also determined by quantitative assessment. In the same way, they cannot show on their own whether the SR of the DUT was affected in absolute terms by the pre-conditioning or by the long-term degrada-tion of the cells during the entire RR PT. For the MJ PV cells, though, F I G U R E 7 Percentage deviations from ESTI RMPT value for ISC,
VOC, PmaxandFFof RR85 (a-Si/ c-Si). RMPT value is represented by the -axis and its combined expanded UC ( = 2) is shown forx k simplicity only for Pmax(light-grey-shaded area) andFF
(dark-grey-shaded area). The error bars shown represent the UC of the submitted result as stated by the participant. An inset is shown for the points falling outside the main range of the deviations. The EU and ES values correspond to the ESTI measurements made, respectively, before and after the pre-conditioning at the end of the RR PT. Note that the laboratory identification number may be different for the other DUTs [Colour figure can be viewed at wileyonlinelibrary.com]
they can give a visual representation of the relative ratio between the two junctions. Where the laboratory originally measured SR data (as it is the case for ESTI, too) and submitted them as such, the data were converted to EQE values as per:
EQE λð Þ =SR λð Þ λ ×
hc q
whereλis the wavelength,his the Planck's constant,c is the light speed and is the elementary charge.q
In all the graphs, ESTI measured data points are displayed in the same way as in Figure 2 and after conversion to EQE values. The lines between ESTI measured points are just connecting straight lines to help the reader's eye and do not represent any interpolation or any real data. On the contrary, the EQE results from the participant labo-ratories are shown as lines, because the step in wavelength of the submitted EQE (or SR) results was too short (in some cases even down to 1 nm) to have them represented as discrete points.
The comparison of the normalised EQE data for the SJ PV cells is shown in Figures S3 (RR81, a-Si) and S4 (RR82, c-Si) in the supporting information. In general, the agreement is good for SJ PV, with only few laboratories that show large deviations from the ESTI measurements in a restricted range of wavelengths. It has to be noted, though, that a quantitative evaluation of these deviations and their effect on the DUT calibration through the SMM correction is not possible here.
In the case of the MJ PV cells, the EQE values of the two junc-tions have been normalised to the reported maximum value for the bottom junction, so this always reaches 1 while the top junction has a varying intensity, depending on the measured ratio between the values of the two junctions for the three MJ PV DUTs. This choice has been driven by the following considerations:
1. the information on the ratio between the EQE of the two junctions is correctly preserved as submitted by the participants, as opposed to if both individual EQEs were normalised separately;
2. the possible metastability of the c-Si junction is deemed to be less significant than the one the a-Si junction could have. Therefore, it is used as the relative reference between the two junctions.
Figures 8, 9 and 10 show the comparison for the DUTs RR83, RR84 and RR85, respectively. The graphs also report the results of the mea-surement performed at ESTI at the beginning of the RR PT before the pre-conditioning of the DUTs (labelled with 2015) in order to give a broader overview of the RR PT results. Indeed, any change in the rela-tive data from ESTI measurements before the start of the RR can highlight possible changes (if any) in the junctions' ratio related only to the pre-conditioning. This information has already been partly discussed in Sections 2.4.2 (DUTs' pre-conditioning at ESTI) and Section 3.1 in terms of the CB values obtained before and after the pre-conditioning; those values are reported in Table S2. Here, the change is shown visual in terms of the EQE shape.
For all MJ PV DUTs, large deviations from the EQE data calcu-lated from the ESTI reference measurement are visible. As the normalisation of the EQE data is based on the bottom-junction's maxi-mum value, the bottom-junction EQEs show in general a better agree-ment than the top-junction ones to the ESTI measureagree-ment. The agreement in the shape of the bottom-junction EQE is generally observed to be better for RR84 and RR85, while for RR83 the devia-tion of one laboratory is particularly evident. Another laboratory shows deep holes in the rising slope of the bottom junction, which could be due to enhancement of the interference pattern visible in F I G U R E 8 Normalised EQE of RR83 (nominally top-limited) for the laboratories that submitted the results. ESTI reference and the data measured before the DUTs pre-conditioning in 2015 are shown, too. The lines connecting ESTI measured points are only shown to help the reader's eye and do not represent any interpolation nor real data [Colour figure can be viewed at wileyonlinelibrary.com]
F I G U R E 9 Normalised EQE of RR84 (nominally bottom-limited) for the laboratories that submitted the results. ESTI reference and the data measured before the DUTs pre-conditioning in 2015 are shown, too. The lines connecting ESTI measured points are only shown to help the reader's eye and do not represent any interpolation nor real data [Colour figure can be viewed at wileyonlinelibrary.com]