1
Alma Mater Studiorum – Università di Bologna
DOTTORATO DI RICERCA IN
Biologia Cellulare e Molecolare
Ciclo XXX
Settore Concorsuale di afferenza: 05/E2 Settore Scientifico disciplinare: BIO/11
TITOLO TESI
Cadherin 6 regulates Epithelial Mesenchymal Transition by restraining
autophagy and controlling metabolism in metastatic thyroid cancer
Presentata da: Mila Gugnoni
Coordinatore Dottorato Supervisore
Prof. Giovanni Capranico Prof. Davide Carlo Ambrosetti
Co-supervisore
Dott.ssa Alessia Ciarrocchi
Esame finale: aprile 2018
Co-supervisore
3
Index
ABSTRACT ... 1
INTRODUCTION ... 3
Thyroid Cancer ... 5
Papillary Thyroid Cancer (PTC) ... 7
Epithelial-Mesenchymal Transition (EMT) ... 8
Cadherins ... 11
Cadherin 6 ... 15
AIM OF THE STUDY ... 19
RESULTS ... 21
CDH6 expression in PTC patients ... 23
CDH6 silencing changes cells morphology and architecture ... 31
CDH6 silencing reverts EMT program in PTC cell lines... 33
CDH6 silencing affects cell proliferation, invasion and migration ... 35
CDH6 controls autophagy ... 35
CDH6 silencing affects mitochondrial dynamics and metabolism ... 40
CDH6 interaction with autophagic proteins is mediated by non-redundant LIR domains ... 43
CDH6 membrane localization is needed for its function ... 45
Genome-wide analysis of H3K27ac profile during TGFβ-mediated EMT ... 46
DISCUSSION ... 53
MATERIALS AND METHODS ... 63
Cell cultures ... 65
Cell transfection ... 65
4
Immunohistochemistry ... 66
Membrane Yeast Two Hybrid screening ... 67
GST Pull-Down ... 68
RNA extraction, Reverse Transcriptase Reaction and quantitative real time-PCR ... 69
Scratch wound healing assay ... 70
Cell proliferation ... 70
MTT assay ... 71
Invasion Chamber Assay ... 71
Western Blot and Immunofluorescence ... 71
ChIP-seq ... 72
Lactate production assay ... 75
Seahorse Mitostress assay ... 76
Statistical analysis ... 77
Plasmid constructs ... 77
1
Abstract
The transdifferentiation of epithelial cells toward a mesenchymal phenotype (EMT) is a multi-step process fundamental for tumor cells to leave the primary lesion and colonize ectopic sites. Cadherins are structural proteins that play a pivotal role in transducing extracellular signals, regulating many cellular pathways. The molecular mechanisms which guide these signaling functions are far to be fully characterized. Cadherin-6 (CDH6) is a type-2 cadherin known to drive EMT during development and it is aberrantly re-expressed in some tumors. In thyroid cancer, CDH6 is a target of the TGFβ signaling and a marker of EMT, suggesting a role for this protein in the progression of this type of tumor. Papillary thyroid carcinomas (PTCs) are mostly indolent lesions, but in the 2-5% of cases this tumor metastasize. The identification of molecular markers that allow to distinguish, at the early stages of diagnosis, which tumors will behave aggressively, would be strategic to develop more specific anticancer approaches. In this work, we assessed the role of CDH6 in the metastatic progression of thyroid cancer and evaluated the transcriptional re-programming following TGFβ signaling. We observed that CDH6 knock-down changes cellular morphology and cell-cell interaction structures, partially reverting the EMT program in thyroid cancer cells. Searching for CDH6 interactors using a yeast two-hybrid screening approach based on a thyroid cancer patients library, we found GABARAP, BNIP3 and BNIP3L/Nix. Through these direct interactions, CDH6 restrains autophagy and induces DRP1-mediated mitochondrial fission. CDH6 not only affects mitochondrial structure but also controls cell metabolism. Indeed, CDH6-mediated mitochondrial fission is required to provide spared mitochondria to promote a highly energetic profile, needed for cell motility and invasion. Analysis of CDH6 cytoplasmic LIR domains suggests that many cadherin family members could associate to autophagic machinery regulating the process. The analysis of CDH6 expression in a cohort of human PTCs showed that CDH6 expression is strongly associated
2 with metastatic behavior and worse disease free survival probability of the patients. Moreover, CDH6 expression is up-regulated specifically in the cells undergoing EMT and leaving the primary site of the tumor. Finally, we attempted to discover new coding and non-coding regulatory elements mediating TGFβ-induced EMT in thyroid cancer cells.
3
5
Thyroid Cancer
Thyroid cancer is the most frequent malignant disease of the endocrine system. Incidence rate varies by geographic area, age, and sex, generally it is three to four times higher in women than in males, and very low in children under 15 years old (1,2). The massive increase in newly diagnosed cases in the last decades is largely due to new sophisticated screening technologies which identify asymptomatic and indolent lesions not detectable with previous methods, indeed mortality rates remained unchanged (3).
Most thyroid cancers originate from the transformation of thyrocytes, epithelial cells which secrete the thyroid hormone, while medullary thyroid carcinomas are rare and originate from the transformation of the calcitonin hormone-secreting C cells (4).
The three mayor histotypes in thyrocytes-derived cancer are defined by the level of cell differentiation, which is a classical parameter to distinguish aggressiveness at the time of the diagnosis. Well-differentiated thyroid tumors maintain morphological features of cells of epithelial origin and are usually characterized by slow proliferation and low metastatic spreading, and a 5-year survival higher than 95% (1). By contrast, anaplastic tumor cells are morphologically undifferentiated, tend to form widely infiltrative masses and spread to regional and ectopic sites, with a median 1-year survival rate inferior to 10-20% (Figure 1) (5,6).
It has been established that activating mutations in the proteins of Mitogen-activated protein kinase (MAPK) pathway favor thyroid tumorigenesis. In the recent years, a lot of studies tried to establish if mutations within this pathway (like BRAF V600E) could be used as prognostic factors (6,7). However, the association of these mutations with the metastatic behavior of these tumors has not clearly been demonstrated (7). Exploring the molecular differences between low and high aggressive
6
thyroid tumors would be of great importance to understand the basis of thyroid tumorigenesis and likely to improve patients’ treatment and management.
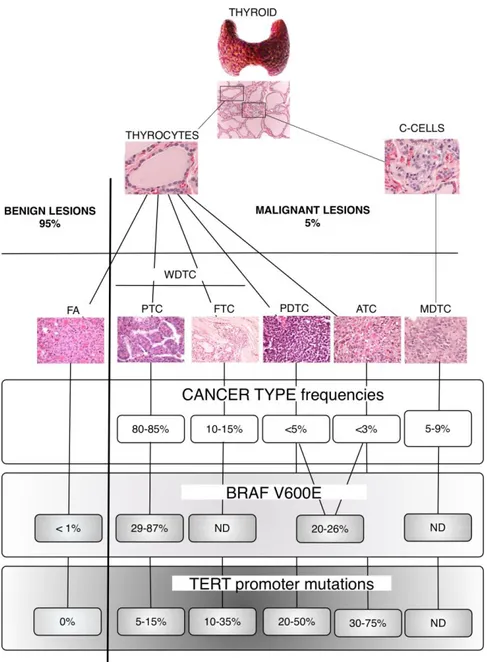
Figure 1. Schematic representation of thyroid tumor histotypes and BRAF V600E and TERT promoter
mutations frequency in benign and malignant lesions. Most thyrocytes-derived lesions are benign follicular adenomas (FA). The malignant lesions, based on cell differentiation, can be divided into well-differentiated (WDTC), poorly differentiated (PDTC) and anaplastic (ATC) thyroid carcinomas. Among the WDTCs, papillary thyroid carcinomas (PTC) and follicular thyroid carcinomas (FTC). From C cells transformation originates medullary thyroid carcinoma (MDTC). IHC images magnification 200X. ND= not detected.
7
Papillary Thyroid Carcinoma (PTC)
Figure 1 shows the major histotypes of thyroid cancer. Among the well-differentiated lesions, the papillary thyroid carcinoma (PTCs) is the most common, accounting for 65-93% of all thyroid tumors, depending on the geographic area (1). PTC is generally an indolent lesion. However, 2-5% of these tumors present distant metastases leading to negative outcome of the patients (8,9). Diagnosis and prognosis for these tumors are based exclusively on morphological characteristics, which reflects the limited knowledge of the molecular mechanisms that control cell transformation and tumor progression in thyroid tumors.
Indeed, due to the lack of markers which can discriminate between aggressive and indolent forms of PTCs, the great majority of patients are surgically treated with total thyroidectomy, lymph node neck dissection and, in some cases, with radioiodine ablation (RAI) (10).
The role of genetic factors in this type of tumor is not completely clear (2,7). Based on the tumor cancer genome atlas (TCGA) results, PTCs present the lowest incidence of mutations among all solid cancers (11). Several mutually exclusive genetic alterations which lead to MAPK pathway activation have been described as frequent in this tumor (12,13). Point mutations (mainly in BRAF and NRAS) are found in more than 75% of PTCs, gene fusions in 15% and copy number variations in 7% of cases (11). The most common chromosomal rearrangement in PTCs involves the Rearranged During Transfection (RET) (gene and results into fusions RET-PTC) involving Neurotrophic Receptor Tyrosine Kinase 3 (NTRK3), Neurotrophic Receptor Tyrosine Kinase 1 (NTRK1), Anaplastic lymphoma kinase (ALK) and other kinases of the MAPK pathway.
PTC progression has been associated with mutations in genes as Tumor Protein p53 (TP53), Phosphatidylinositol-4,5-Bisphosphate 3-Kinase Catalytic Subunit Alpha (PIK3CA), AKT Reverse
8
Transcriptase (TERT) have been described as largely associated with high grade thyroid cancer (ATC and metastatic PTCs) (2,11,13).
Recently, a signature composed by the duplication of Chr1q, the duplication of TERT locus and the mutation on the TERT promoter, called Thyroid TERT Chr1q (THYT1), has been proposed as a predictive marker of distant metastases and reduced patients’ survival probability (14).
To date, the discovery of new markers associated with aggressiveness of PTC is still a major challenge.
Epithelial to Mesenchymal Transition (EMT)
To leave their original site and spread to adjacent or distant tissues, epithelial tumor cells must undergo a profound molecular reorganization to modify their epithelial characteristics, including cell-cell adhesion, polarity, lack of structures for motility, and acquire mesenchymal features which allow migration, invasiveness and resistance to apoptosis (15). This complex and reversible process is fundamental in cancer metastasization and in non-pathological processes, like embryonic development, and it is known as epithelial-mesenchymal transition (EMT). The reverse of this program, the mesenchymal-epithelial transition (MET), is equally important in the subsequent migration phases, to allow cells to re-differentiate and colonize ectopic sites (16).
During EMT, polarized and non-motile epithelial cells, embedded in a well-organized and interconnected network, must dramatically change their molecular profile, starting from the adhesion molecules present on the plasmatic membrane which guide cell-cell interaction and cytoskeleton asset.
Following a driving signal (e.g. TGFβ or other growth factor), EMT initiation leads to the activation of a transcriptional program which involves the up-regulation of many transcription factors (Figure
9
2). This results in the inhibition of epithelial proteins expression, including those participating to cell-cell interaction and to the induction of mesenchymal proteins, which potentiate the ability of the cell-cells to interact with the extracellular matrix favoring cell movement (Figure 2b) (17,18).
Even though variations in EMT-associated gene expression program are dependent on cell and tissue type, the switch from epithelial to mesenchymal cadherins on cell surface is one of the main hallmarks of the process (17).
10
Figure 2. Representation of EMT process. a. Changes in cellular polarity, cell-cell interaction and cell
morphology following EMT induced by growth factors signaling like TGFβ, Fibroblast Growth Factor (FGF) and Epidermal Growth Factor (EGF). b. Schematic illustration of SMAD and Non SMAD-mediated TGFβ cascade in cancer. TGFβ receptors (TGFR1/TGFR2) are activated and phosphorylate SMAD2/3, which associate to SMAD4.The complex translocate into the nucleus to control the expression of a network of mesenchymal genes. The MAPK and Phosphatidylinositol-3-Kinase (PI3K)-class I pathways can be directly activated by TGFβ and regulate EMT-related transcription factors (TFs) like Snail Family Transcriptional Repressor 1 and 2 (SNAI1 and 2), Zinc Finger E-Box Binding Homeobox 1 and 2 (ZEB1 and 2), Twist Family BHLH Transcription Factor (TWIST), E-proteins (E12/E47) and the repressor Inhibitor of DNA Binding 1 (Id). The reorganization of genome transcription is at the base of the change in the organization of adhesion molecules on the cell membrane, which dictates the rules of cell-cell adhesion and influences cytoskeleton structure and stress fibers formation.
a
11
Cadherins
The cadherin superfamily is composed by over 100 transmembrane proteins involved in the organization of cell-cell adhesion junctions which dictate the specificity of cellular interactions (19,20). E-cadherin (CDH1, E-CAD) and N-cadherin (CDH2, N-CAD) are the prototypes and by far the most studied members of the cadherin family (Table 1, Figure 3). During EMT, epithelial cadherins such as E-CAD, are displaced by the multiprotein complexes at the adherent junctions and are substituted by mesenchymal cadherins, such as N-CAD (21). This switch relapses on the protein complexes which connect cadherins to the cytoskeleton and triggers its rearrangement and the formation of lamellipodia and filopodia, actin protrusions for cell movement. It is reported that metastatic cells are enriched in filopodia-like structures and that their presence correlates with invasiveness (22).
Identified as cell membrane-associated Ca2+-dependent glycoproteins, cadherins’ role is not confined to cell-cell recognition and adhesion, but extends to signal transduction to regulate cell growth, fate and behavior (21).
Evidence indicates that different cadherins play non-redundant roles and it is commonly believed that such large variability originates from the need of complex organisms to specifically differentiate intercellular interactions. Despite this, the potential role of cadherins other than the E- and N-CAD in cancer development and progression is a topic of great interest not yet fully explored.
12
Table 1
Family Subfamily Genes Names
Cadherins Type I CDH1, CDH2, CDH3, CDH4, CDH15
Type II CDH5, CDH6, CDH7, CDH8, CDH9, CDH10, CDH11, CDH12, CDH18, CDH19, CDH20, CDH22, CDH24
7D CDH16, CDH17
Desmosomal DSC1, DSC2, DSC3, DSG1, DSG2, DSG3, DSG4
Flamingo/CELSR CELSR1, CELSR2, CELSR3, CDH13, CDH26
Figure 3. Schematic representation of the human cadherin family. The proteins’ structure is aligned at
transmembrane domain and shown to scale. The numbers displayed on the right refer to the total number of amino acid residues. Domains legend: CBD: cadherin-specific catenin binding domain; CD: cytoplasmic domain; CE: cysteine-rich EGF repeat-like domain; EC: extracellular repeat; FB: Flamingo box; GPI: glycosyl phosphatidyl inositol anchor; GPS: latrophilin/CL-1-like GPS domain; HRD: hormone receptor domain ; IA: intracellular anchoring domain; JMD: juxta membrane domain; LAG: laminin A globular domain; LEGF: laminin-type EGF-like domain; Pro-d: prodomain; RUD: intracellular repeated unit domain; TD: terminal domain.
13
The expression of specific cadherins is tightly regulated during embryogenesis, cell differentiation and maintenance of different tissues and organs. Given the broad spectrum of their functions, it is not surprising that their aberrant expression and function have been linked to cancer progression and metastasization (23,24).
In many epithelial cancers, loss of E-CAD is correlated to increased invasiveness and is usually accompanied by the up-regulation of N-CAD, underlying the EMT program activation (25). N-CAD can associate with fibroblast growth factor receptor (FGFR) and promote the translocation and activity of β-catenin in the nucleus, sustaining tumor progression. Nevertheless, it would be misleading to think that N-CAD is always correlated with bad prognosis, indeed, in neuroblastoma, its down-regulation is associated with metastases (26). Cadherin3 (P-CAD) activity is tumor type-specific. In some cancer cells, it plays a tumor suppressor role, replacing E-CAD (27). In other contexts, it can bind to insulin-like growth factor 1 receptor (IGF1R) activating p120-catenin promoting cell migration and invasion (28). Cadherin17 (LI-CAD) promotes gastrointestinal tumors metastasization while cadherin5 (VE-CAD), following N-CAD up-regulation, promotes tumor spreading (29,30). Cadherin13 (T-CAD) loss enhances epidermal growth factor receptor (EGFR) signaling, thus promoting carcinoma progression (31). Protocadherin’s loss is common in some types of tumor, and considered a hallmark of increased aggressiveness, while in breast cancers the expression of protocadherin7 (PCDH7) is correlated to cell proliferation and migration (Figure 4) (32).
14
Figure 4. Molecular interaction of some representative cadherin superfamily members in cancer. Putative mechanisms not yet established are signaled with question marks.
Legend: FAK: focal adhesion kinase; GPI: glycosylphosphatidylinositol anchor; NAP1: NCK-associated protein 1; NF-κB: nuclear factor-κB; TCF/LEF: T-cell transcription factor/lymphoid enhancer-binding factor; TJ: tight junction.
15
Cadherin 6
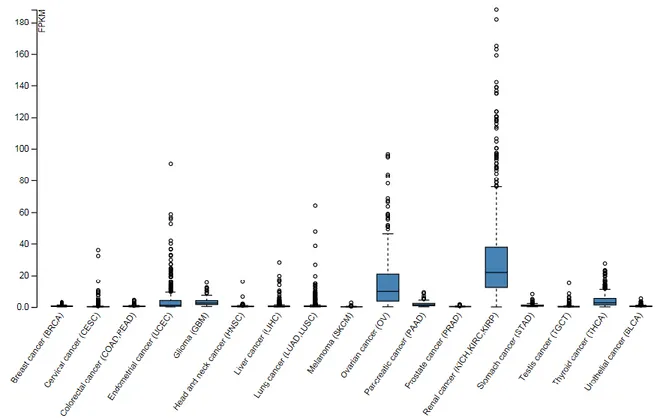
Cadherin 6 (CDH6, K-CAD) is a member of the Type II cadherin family, which partakes in the morphogenesis of central nervous system and kidneys during embryogenesis. In renal development, CDH6 controls the conversion of mesenchymal precursors into the epithelium of the developing nephrons (34-36). It is known that crucial players during embryogenesis are often re-expressed in cancer progression and CDH6 confirms this paradigm. Indeed, CDH6 overexpression has been described in ovarian cancer and renal carcinoma (37-40). In the latter, CDH6 expression strongly correlates with aggressive behavior and poor patient outcome. Analysis of the gene expression profiles available through The Cancer Genome Atlas (TCGA, portal website http://cancergenome.nih.gov) confirmed that CDH6 expression is tumor type dependent and enriched in these two types of cancer (Figure 5).
Figure 5. Cadherin6 expression in different cancer types from The Cancer Genome Atlas (TCGA)
16
Previous data from our laboratory demonstrated that in thyroid cancer cells, CDH6 is up-regulated following TGFβ oncogenic signaling. CDH6 in human is encoded by cdh6 gene located on the short arm of chromosome 5, in cluster with other cadherins, in two main isoforms (long:L and short:S) (41). Both isoforms are highly expressed in PTC-derived cell lines BCPap and TPC1, compared to the thyrocytes-derived Nthy-ori-3.1 cell line (Figure 6a). Following TGFβ treatment, both isoforms are transcriptionally induced, in all three cell lines tested, but in a higher extent in thyrocytes-derived cell line, in which CDH6 basal expression is very low (Figure 6b) (42). The ID1-RUNX2 transcriptional axis partakes to the TGFβ-mediated CDH6 regulation during EMT (Figure 6c) (42,43). Given the highly specific and fundamental role of cadherins during cancer metastasization,
17
Figure 6. a. Relative expression of CDH6 main
isoforms long (L) and short (S) in thyrocyte-derived cell line Nthy-ori-3.1 and PTC-derived cell lines BCPap and TPC1. b. TGFβ-mediated CDH6 isoforms up-regulation in Nthy-ori-3.1, BCPap and TPC1 cell lines c. Representation of TGFβ-dependent activation of epithelial mesenchymal transition in thyroid cells. Oncogenic cascade mediated by TGFβ induces the expression of early responsive transcription factors as ID1 and RUNX2 which enhance the transcription of mesenchymal markers as N-CAD, Fibronectin1 (FN1), Vimentin (VIM), Tenascin (TNC) and CDH6. The late responsive transcription factors as SNAI1 and SNAI2 mediate the downregulation of epithelial markers as E-CAD and Cadherin16. *P=0.05, **P=0.01, ***P=0.001.
a
b
19
Aim of the study
Regulatory factors selectively involved in tumor progression are promising candidates as molecular markers of aggressiveness at the time of diagnosis. The identification of these prognostic markers would provide clinicians with new tools to design the most appropriate approaches to thyroid tumor management. Based on our preliminary data, we hypothesize that CDH6 is a major determinant of the aggressive behavior of thyroid cancer and a crucial mediator of metastatic spreading. Thus, the goal of this project is to characterize the functional role of CDH6 in the progression of thyroid tumors and to dissect the signaling network centered on this protein. This project should also define whether CDH6 can be proposed as a new molecular marker of thyroid tumor aggressiveness in a clinical setting.
21
23
Figure 7. Diagram representing patients selection.
CDH6 expression in PTC patients
Well-differentiated PTCs rarely develop distant metastases leading to negative patients outcome. The rarity of these lesions has so far limited the characterization of specific molecular mechanisms and the discovery of reliable markers to distinguish the aggressive PTCs from the indolent ones. To date, the presence of distant metastases at the time of diagnosis is the only prognostic factor of a negative outcome of the patients. Thus, to define whether CDH6 expression was associated with metastatic behavior of PTCs, a nested case-control
study starting from the Thyroid tumor archive of our Institution was designed. It comprised over 2900 cases collected in the last 30 years, among which well differentiated PTC that developed distant metastasis (DM-PTCs) were searched. 50 DM-PTCs samples were recovered and 44 were available for the analysis. This represented one of the largest cohort of DM-PTCs ever analyzed. As control, 42 PTCs which did not metastasized (nm-PTCs), based on a minimum follow-up of 7-years, were selected (Figure 7). In these samples CDH6 expression was analyzed by IHC.
24 A strong correlation between CDH6 protein expression and the presence of distant metastasis was found. 43.2% of DM-PTCs (19/44) showed CDH6 positivity while only 16.7% (7/42) of non-metastatic, control PTCs were positive for CDH6 (p = 0.001) (Table 2). Furthermore, correlation of CDH6 expression with morphological and clinical variables showed that the expression of this cadherin within this cohort was strongly associated with reduced disease-free survival probability (Table 4, Figure 8a). Intriguingly, the same analysis limited to the DM-PTCs group indicated that CDH6 expression did not affect follow-up, indeed its expression was not associated with a worse course of the disease among the patients who developed distant metastases (Figure 8b). These results suggest that this cadherin is required specifically during the initial phases of metastatic spreading. Indeed, once tumor cells have reached the metastatic site, the mesenchymal features acquired through the EMT have to be reverted (through the mesenchymal-to-epithelial transition- MET) in order to allow metastatic cells to proliferate and colonize the site. Interestingly, in DM-PTCs, CDH6 expression was not homogeneous within the tumor, but restricted to clusters of cells interfacing the connective tissue at the invading front of the tumoral mass (Figure 8c-e). Morphologically, the CDH6-positive were completely different from the CDH6-negative tumor cells, displaying lengthened shape and not organized cell-cell adhesion structures, reminding of mesenchymal-like phenotype (Figure 8c-e). Noticeably, the analysis of the epithelial marker E-CAD showed that CDH6 positive cells retained E-CAD expression indicating that these cells have undergone a partial but not complete EMT (Figure 8c-e). All together, these features recall a well-known phenomenon, very important for cancer invasiveness and metastasization, named collective cell migration. Per se E-cadherin expression was highly homogenous within the samples analyzed without significant difference between DM- and control-PTC and did not correlate with any of the clinical and morphological features taken into consideration (Table 3, 5).
25 TABLE 2. CDH6 staining in PTC 0 (Negative) 1 (<5 % positive cells) 2 (5-10% positive cells ) 3 (>10% positive cells) Chisq test DM-PTC 25 (0.57) 0 7 (0.16) 12 (0.27) 0.001 Control-PTC 35 (0.83) 2 (0.05) 5 (0.12) 0 LNM-PTC 19 (0.95) 0 1 (0.05) 0 0.13 noMet-PTC 16 (0.73) 2 (0.09) 4 (0.18) 0 TOTAL 60 (0.70) 2 (0.02) 12 (0.14) 12 (0.14)
Legend: DM-PTC = papillary thyroid cancer with distant metastases; LNM-PTC = PTC with local lymphnodal metastases; noMet-PTC = PTC without metastases
TABLE 3. ECAD staining in PTC 0 (Negative) 1 (<50% positive cells) 2 ( 50-80% positive cells ) 3 (>80% positive cells) Chisq test DM-PTC 0 2 (.05) 3 (.06) 41 (.89) 0.47 Control-PTC 0 2 (.05) 6 (0.15) 33 (.80) LNM-PTC 0 2 (.10) 3 (.15) 15 (.75) 0.15 noMet-PTC 0 0 3 (.14) 18 (.86) TOTAL 0 4 (.05) 9 (.10) 74 (.85)
Legend: DM-PTC = papillary thyroid cancer with distant metastases; LNM-PTC = PTC with local lymphnodal metastases; noMet-PTC = PTC without metastases
26
Figure 8. a,b. Kaplan-Meier curves showing disease-free survival probability correlated with CDH6
expression, on the complete PTC cohort analyzed (n=86, a) and among the DM-PTC samples (n=44, b).
c-e. Immunohistochemistry detection of CDH6 and E-CAD expression in three DM-PTCs samples.
Lower cases represent magnification of the upper images. Scale bar 100 μm.
a b
c d
27 TABLE 4. Association between CDH6 staining and clinical features in DM-PTCs
CDH6 Negative CDH6 Positive P-value DM PTCs n=25 n=19 Age at diagnosis, y 60.3 ± 16.1 50.0 ± 21.1 0.07 Sex 1 Females 15 (.60) 12 (.63) Males 10 (.40) 7 (.37) Histological Diagnosis 0.86 CPTCs 13 (.52) 11 (.58) TCV-PTCs 6 (.24) 5 (.26) FV-PTCs 5 (.20) 2 (.10) ST-PTCs 1 (.04) 1 (.05) pN 0.46 0 2 (.08) 1 (.05) 1a 4 (.16) 6 (.31) 1b 19 (.76) 12 (.63) pT 0.30 1b 1 (.04) 0 2 1 (.04) 2 (.10) 3 20 (.80) 12 (.63) 4a 2 (.08) 5 (.26) 4b 1 (.04) 0 Pathologic Stage at Presentation 0.44 I 1 (.04) 0 (.0) II 3 (.12) 6 (.31) III 3 (.12) 3 (.16) IVa 14 (.56) 7 (.37) IVb 4 (.16) 3 (.16) Follow Up Status 0.08
28 NED 2 (.10) 2 (.12) AWD 5 (.25) 10 (.59) DOD 13 (.65) 5 (.29) NA 5 2 Lymph Node metastases present 23 (.92) 18 (.05) 1 absent 2 (.08) 1 (.95) Distant metastasis main site lung 21 (.84) 15 (.83) bone 2 (.08) 1 (.06) mediastinum 2 (.08) 2 (0.11) Timing of Distant Metastases 0.31 Synchronous 7 (.28) 9 (.47) Metachronous 18 (.72) 10 (.53) ECAD staining 0.11 Heterogeneous (<80% positive cells) 5 (.20) 0 (0) Homogeneous (>80% positive cells) 20 (.80) 19 (1.0)
CPTC: classic PTC, TCV-PTC: PTC, tall cell variant, FV-PTC: PTC follicular variant, ST-PTC: PTC solid trabecular, NED: no evidence of disease, AWD: alive with disease, DOD: dead of disease, NA: not available.
29 TABLE 5. Association between ECAD staining and clinical features in DM-PTCs
Heterogeneous ECAD staining <80% positive Homogeneous ECAD staining >80% positive P-value DM PTCs n=5 n=41 Age at diagnosis, y 59.6 ± 20.1 55.7 ± 18.9 0.67 Sex 1 Females 3 (.60) 25 (.61) Males 2 (.04) 16 (.39) Histological Diagnosis 0.91 CPTCs 3 (.60) 21 (.51) TCV-PTCs 1 (.20) 6 (.15) FV-PTCs 0 2 (.05) ST-PTCs 1 (.20) 12 (.29) pN 0.25 0 0 5 (.12) 1a 0 10 (.24) 1b 5 (1) 26 (.64) pT 0.74 1b 0 1 (.025) 2 0 3 (.07) 3 5 (1) 29 (.71) 4a 0 7 (.17) 4b 0 1 (.025) Pathologic Stage at Presentation 0.83 I 0 1 (.02) II 1 (.20) 8 (.20) III 0 8 (.20) IVa 3 (.60) 18 (.44) IVb 1 (.20) 6 (.14) Follow Up Status 0.60 NED 1 (.20) 3 (.08)
30 AWD 2 (.40) 13 (.34) DOD 2 (.40) 22 (.58) NA 0 3 Lymph Node metastases 0.94 present 0 5 (.12) absent 5 (1) 36 (.88) Distant metastasis main site 0.54 lung 5 (1) 32 (.80) bone 0 3 (.08) mediastinum 0 5 (.12) Timing of Distant Metastases 1 Synchronous 2 (.04) 14 (.34) Metachronous 3 (.06) 27 (.66)
CPTC: classic PTC, TCV-PTC: PTC, tall cell variant, FV-PTC: PTC follicular variant, ST-PTC: PTC solid trabecular, NED: no evidence of disease, AWD: alive with disease, DOD: dead of disease, NA: not available.
31
CDH6 silencing changes cells morphology and architecture
Given the data obtained on patients samples, to define the relevance of CDH6 in the progression of PTC, its expression was selectively targeted with small-interference RNAs (siRNAs) on two cellular models of PTCs: TPC1 and BCPap cell lines. Transfection of CDH6 siRNA in both cell lines determined a profound downregulation of CDH6 expression both at mRNA and protein level (Figure 9a-c).
Noticeably, CDH6 silencing profoundly affected cell morphology and cytoskeleton architecture (Figure 10a-c). Cell shape changed from well-defined to flat and blurred, with increased size
Figure 9 a. CDH6 silencing in TPC1 cell line. Relative expression of CDH6 in cells transfected with three
different CDH6-targeting oligos alone or in combination compared to cell transfected with scramble oligos (siCTRL) ± s.d. b. Relative expression of CDH6 isoforms in TPC1 cell line transfected with control siRNA or CDH6 siRNAs c. Immunohistochemistry analysis of CDH6 expression in TPC1 and BCPap cell lines transfected with siCTRL or siCDH6. Magnification 40X. *P=0.05, **P=0.01, ***P=0.001.
a b
32 compared to control cells. Thus, in silenced cells plasmatic membranes were no longer distinguishable and cells resembled a uniform monolayer (Figure 10a). β-catenin staining unraveled a roof tile-like organization in cells silenced for CDH6, which is absent in control cells (Figure 10c). Actin filaments staining also revealed a profound effect on cytoskeleton organization upon CDH6 knock-down. Actin fibers running parallel to the membrane in control cells were rearranged forming thick fibers which crossed the cells and changed the structure of cell junctions, in CDH6 silenced samples (Figure 10b).
TPC1 BCPAP
Figure 10. a. Optical microscope images of siCTRL or siCDH6 TPC1 and BCPap cell lines. Arrowheads
indicate cell membrane cell-cell interaction. Scale bars, 100 μm. b. Phalloidin immunofluorescence staining to highlight actin filaments in siCTRL or siCDH6 cells. c. β-Catenin immunofluorescence staining to highlight cell membrane and cell-cell interactions in siCTRL or siCDH6 TPC1 and BCPap cell lines.
a b
33 Moreover, in CDH6 silenced cells the density of cytoskeleton protrusions capable to sustain cell movement, like lamellipodia and filopodia, drastically diminished (Figure 10b). This kind of well-organized stress fibers were described in literature as a feature of non-migrant cells (44). This observed cytoskeleton rearrangement also affected cell-cell adhesion properties. Indeed, staining of phosphorylated-Focal adhesion kinase (p-FAK), a tyrosine kinase implicated in Integrin-mediated adherent junctions, showed a re-localization of this protein. p-FAK distribution changed from disperse and homogenous along the plasmatic membrane in control cells, to localized at the level of cell-cell junction in correspondence of the actin fibers nucleation centers in siCDH6 cells (Figure 11a). The involvement of cell junctions in the rearrangements induced by CDH6 knock-down was confirmed by the staining for the tight junction component ZO1 (45). Upon CDH6 silencing, ZO1 specifically relocated at the interconnection between adjacent cells, co-localizing with actin filaments (Figure 11b). In addition, FAK phosphorylation was profoundly inhibited by CDH6 silencing while ZO1 protein levels remained stable (Figure 11d).
CDH6 silencing reverts EMT program in PTC cell lines
Next, the potential role of CDH6 in defining the EMT phenotype of thyroid cancer cells was assessed. CDH6 silencing caused a significant down-regulation of the mesenchymal N-CAD but did not lead to changes in the classical epithelial E-CAD, which was not expressed in either siCDH6 or siCTRL cells (Figure 11c,d). By contrast, the epithelial CDH16 was transcriptionally up-regulated following CDH6 knockdown (Figure 11c). CDH16 was first discovered as a kidney-specific cadherin but was then found expressed in thyroid cells during development and down-regulated, in a higher extent compared to E-CAD, in thyroid transformed cells (46).The phenotype observed suggested that
34 CDH6 ablation was capable of partially revert the EMT phenotype of PTC-derived cell lines, influencing the expression and stability of genes and proteins involved in the process.
Figure 11. a. Phalloidin and p-FAK immunofluorescence staining of actin filaments in TPC1 and
BCPap siCTRL and siCDH6 cells. b. Phalloidin and ZO1 immunofluorescence staining in TPC1 siCTRL and siCDH6 cells. Scale bars, 100 μm. c. qRT-PCR analysis of E-CAD, CDH16 and N-CAD expression in TPC1 and BCPap siCTRL and siCDH6 cells. d. Western blot analysis of total and p-FAK, N-CAD (quantification shows the percentage of N-CAD normalized on actin levels in siCDH6 compared to siCTRL cells ±s.d), ZO1 and ECAD in TPC1 and BCPAP cells. N° of replicates =3
*P=0.05, **P=0.01, ***P=0.001. a b c d c
35
CDH6 silencing affects cell proliferation, invasion and migration
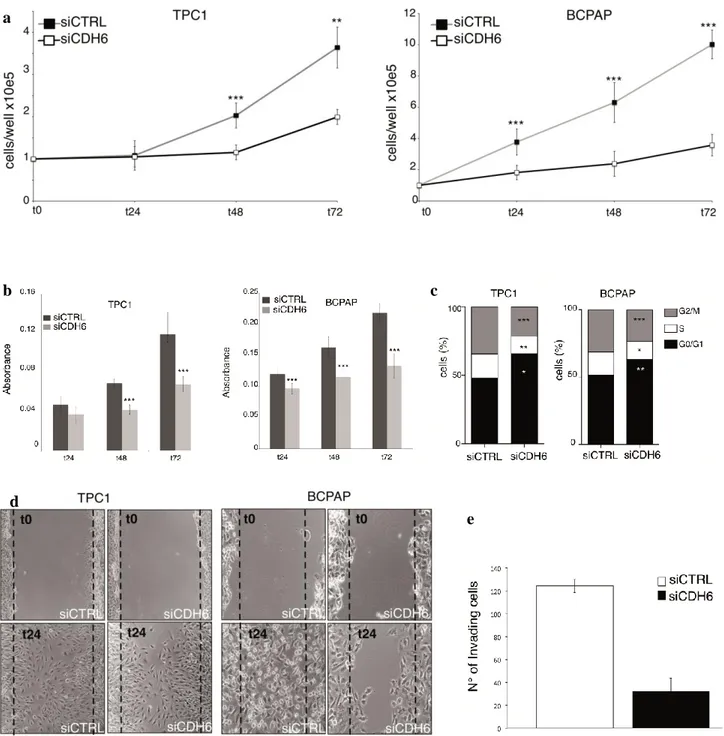
Strikingly, CDH6 silencing significantly inhibited cell proliferation, measured by growth curve (Figure 12a) and cell vitality (Figure 12b) in both cell lines tested. Accordingly, cell cycle evaluation with Propidium Iodide (PI) flow-cytometry staining showed a reduced number of cells in G1/S transition and a block in G0/G1, confirming an arrest in cell proliferation (Figure 12c).
Wound-healing and matrigel invasion chamber assays were used to evaluate CDH6-mediated cell migration and invasion. CDH6 silencing restrained the capacity of cell to migrate in both TPC1 and BCPap cell line and to invade the matrigel chambers in BCPap cell line (Figure 12d,e).
CDH6 controls autophagy
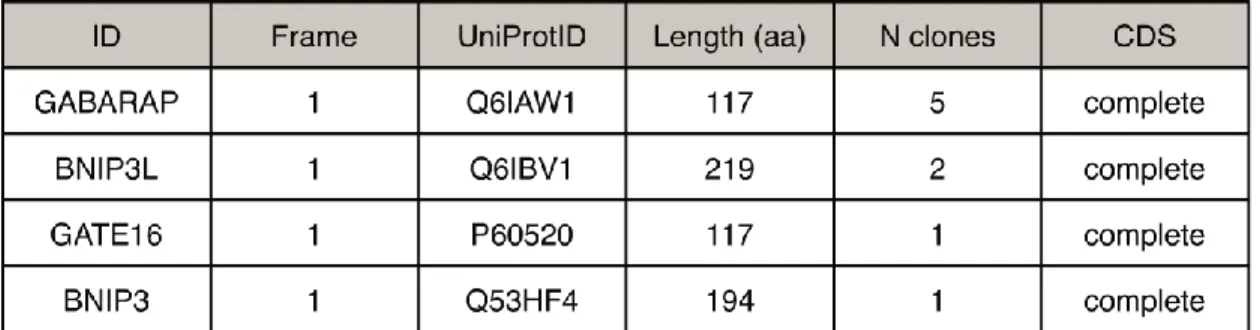
To get deeper knowledge on CDH6 molecular function, its interactors in human PTC samples were searched using a Membrane Yeast Two Hybrid assay. The full length CDH6 transmembrane protein was used as bait to search new interactors by screening a cDNA library obtained from 5 PTC patient samples. Before the screening, the library was normalized to allow the detection also of less represented protein that potentially interact with CDH6. From this analysis twelve proteins were identified. Unexpectedly, the most representative CDH6 interactors were the autophagy-related proteins Gamma-aminobutyric acid receptor-associated protein (GABARAP) and GABA Type A Receptor Associated Protein Like 2 (GATE16/GABARAPL2), and the outer mitochondrial membrane proteins BCL2 Interacting Protein 3 (BNIP3) and BCL2 Interacting Protein 3 Like (BNIP3L/Nix) (Figure 13).
36
Figure 12. a. Cell proliferation assay in siCTRL and siCDH6 TPC1 and BCPap cell lines. b. MTT assay to
evaluate cell vitality in siCTRL and siCDH6 TPC1 and BCPap cell lines. c. Cytofluorimeter PI staining to evaluate cell cycle in siCTRL and siCDH6 TPC1 and BCPap cell lines. d. Wound-healing assay to evaluate cell migration in siCTRL and siCDH6 TPC1 and BCPap cell lines. e. Matrigel-invasion chamber assay to evaluate cell invasion in siCTRL and siCDH6 BCPap cell line. N° of replicates =3 *P=0.05, **P=0.01, ***P=0.001. b a c d e
37 GABARAP and GATE16/GABARAPL2 are ubiquitin-like proteins, part of the Microtubule-associated proteins 1A/1B light chain 3B (MAP1LC3B, LC3)/GABARAP protein family, orthologs of the yeast Autophagy Related 8 (ATG8) protein, and participate to the autophagosome formation the during the initial phases of autophagy (47).
BNIP3 and BNIP3L/Nix are implicated in apoptosis and mitophagy processes. BNIP3 binds and inhibits the anti-apoptotic Bcl2 proteins while it activates mitophagy through the interaction with
LC3 and GABARAP (48).
CDH6 direct interaction with GABARAP, BNIP3 and BNIP3L was confirmed in vitro with a GST pulldown assay, while the interaction with GATE16 was not (Figure 14a).
Next, the significance of CDH6/GABARAP interaction in PTCs was investigated. First the effect of CDH6 silencing on autophagy activation was evaluated. To this end, the expression and localization of LC3 and GABARAP, markers of autophagy, was analyzed by western blot and immunofluorescent analysis (49). In the early phases of autophagy, LC3 and GABARAP are lipidated and loaded on autophagosome membrane to trigger its invagination. Later, after the fusion between autophagosome and lysosome, these proteins are degraded with the cargo.
In TPC1 cell line, western blot analysis showed that CDH6 silencing led to a significant endogenous LC3 and Flag-GABARAP down-regulation, suggesting autophagy induction (Figure 14b).
38
This hypothesis was investigated by chloroquine treatment and immunofluorescence staining. Chloroquine is a drug that interferes with the fusion between autophagosomes and lysosomes, thus impeding cargo degradation. Accumulation of LC3 following chloroquine treatment indicated that its degradation was due to autophagy activation enhancement and not to other biological processes (Figure 14c). Immunofluorescence staining for LC3 and GABARAP confirmed that upon CDH6 silencing autophagy is activated. These proteins, diffused in the cytoplasm in control cells, in silenced cells localized and co-localized into well-defined dots which are the newly formed autophagosomes (Figure 14d,e).
The PI3K-classI guides one of the most known anti-autophagic pathway and its inhibition, or the inhibition of its downstream targets like AKT and Mammalian Target Of Rapamycin Kinase (mTOR) provokes autophagy activation (50). Western blot analysis of the phosphorylated, active form of AKT showed that upon CDH6 silencing p-AKT is drastically down-regulated compared to control cells, in accordance with autophagy activation.
On contrast, the activation of the MAPK component Extracellular signal–Regulated Kinase (ERK) by AMP-activated Protein Kinase (AMPK) is reported to disassemble mTOR complexes 1 and 2 and enhance Beclin1-mediated autophagy (51). Thus, p-ERK levels were evaluated. p-ERK slightly increased upon CDH6 silencing, underling that other mechanisms were involved in the regulation of this process (Figure 14f).
All together, these data demonstrated that the binding of CDH6 and GABARAP is functional to control autophagy activation in thyroid cancer and that, when expressed, CDH6 restrains the activation of this process.
39
Figure 14. a. GST pull-down assay of cytoCDH6 with GABARAP, GATE16, BNIP3 and BNIP3L.
Representative of four replicates. b. Western blot of endogenous LC3 and exogenous Flag-GABARAP in TPC1 cell line. The quantification refers to the percentage of LC3 and Flag-GABARAP normalized on actin levels in siCDH6 compared to siCTRL ±s.d. c. Western blot of LC3 in siCTRL and siCDH6 in not treated or chloroquine 20 or 80 µM treated TPC1. d. Immunofluorescence staining of EGFP-LC3 or Flag-GABARAP in siCTRL and siCDH6 TPC1. Quantification refers to the number of dots per cell ±s.e.m. e. Immunofluorescence showing the co-localization of EGFP-LC3 and Flag-GABARAP in siCTRL and siCDH6 TPC1 cells. f. Western blot analysis of pAKT, AKT, pERK and ERK in siCTRL and siCDH6 TPC1 cells. Quantification refers to the percentage of phosphorylated bands normalized on total protein levels in siCTRL compared to siCDH6 samples ±s.d. All the quantifications are calculated on the values obtained in three independent experiments ±s.d. N° of replicates =3 *P=0.05, **P=0.01, ***P=0.001.
a b
c
d
40
CDH6 silencing affects mitochondrial dynamics and metabolism
The possible involvement of CDH6 in the regulation of mitochondria structure and function was also investigated. Mitochondrial network status following CDH6 silencing was assessed by mitotracker staining in TPC1 cell line. Immunofluorescence images showed a massive mitochondrial reorganization upon CDH6 silencing. In control cells, a hyper-fixed status was observed, while upon the silencing, massive mitochondrial fusion led to the establishment of a highly-interconnected network (Figure 15a,b). These morphological changes were accompanied by a strong down-regulation of exogenous BNIP3 and endogenous Dynamin-Related Protein1 (DRP1), the master regulator of mitochondrial fission (Figure 15c). Expression level of mitochondrial dynamics regulators was assessed by q-RT-PCR. Except for PINK1, no significant difference between control and CDH6-silenced cells was observed (Figure 15d). PINK1 was discovered in Drosophila
melanogaster as a mitochondrial fission-promoting protein (52). Further studies on mammals
revealed that its role is much more complicated and related to mitochondrial maintenance, biogenesis, transport and calcium homeostasis, and it is context dependent (53).
This observation indicates that CDH6 controls mitochondrial dynamics. Whether this effect is direct, or the consequence of autophagy activation remains to be determined.
Changes in mitochondrial morphology and shape not always reflects modifications of cell metabolism. However, inhibition of DRP1 has been shown to enhance mitochondrial fusion and promote oxidative phosphorylation (OXPHOS)-dependent ATP production, protecting mitochondria from degradation (54).
41
BCPap siCT BCPap siCDH6 Nthy-3.1-ori 0 500000 1000000 1500000 Lactate production R L U a b c d e
Nthy-ori-3,1 BCPap siCT BCPap siCDH6
42
To assess if CDH6-mediated DRP1 modulation reflected a change in cell metabolism, Lactate production, Oxigen Consumption Rate (OCR) and Extracellular Acidification Rate (ECAR) were assessed in TPC1 cells treated with CDH6 siRNAs or scramble oligos and normal thyrocytes-derived Nthy-ori-3.1 cell line.
Since lactate is the main product of glycolysis, its measurement is a common and reproducible way to measure the glycolytic rate of a cell line in different conditions. Upon CDH6 silencing, lactate production diminished up to 50% in BCPap cell line reaching the levels measured in Nthy-ori-3,1 cells (Figure 15e).
To determine if the down-regulation of glycolysis following CDH6 silencing was due to a metabolism switch toward mitochondrial respiration, Seahorse assay was performed. OCR evaluates OXPHOS rate, while ECAR is a measure of the acidification of the cellular medium due to glycolysis-dependent protons extrusion. An energetic map was derived for Nthy-ori-3,1and for control or CDH6-silenced BCPap cells. While BCPap control cells showed a highly energetic profile, taking advantage of both glycolysis and OXPHOS, in accordance with their highly proliferative profile, CDH6-silenced cells displayed lower ECAR and OCR, according to their low proliferating
Figure 15. a,b. Immunofluorescence mitochondria staining with mitotracker red in siCTRL(a,a1,a2) and
siCDH6 (b,b1,b2) TPC1 cell line. a1,a2,b1,b2 represent magnification of the upper images. c. Western blot analysis of exogenous BNIP3 and endogenous DRP1 in siCTRL and siCDH6 TPC1 cells. Quantification refers to the percentage of protein bands normalized on actin levels in siCDH6 compared to siCTRL ±s.d. quantifications are calculated on the values obtained in three independent experiments ±s.d. d. qRT-PCR analysis of relative expression of Tafazzin (TAZ), DRP1, PTEN-Induced putative Kinase 1 (PINK1), Mitochondrial Dynamin Like GTPase (OPA1), Cardiolipin Synthase 1 (CRLS1), Mitofusin 1 and 2 (MFN1-2), Fission 1 (FIS1) and CDH6 in siCDH6 and siCTRL TPC1 cells. e. Lactate production assay in BCPap siCTRL and siCDH6 and in Nthy-ori3,1 cells expressed in Relative Luminescence Units (RLU). Representative of three replicates. f. Energetic map of BCPap siCTRL, siCDH6 and in Nthy-ori3,1 cells. Representative of three replicates.
43
potential and quiescent state. Nthy-ori-3,1 as non-tumoral derived cell line whose metabolism relies mainly on OXPHOS, presented higher OCR and lower ECAR compared to BCPap cell line (Figure 15f). These results indicate that CDH6 not only affected mitochondrial morphology, but also participated to the regulation of cell metabolism. Since metastatic cancer cells that have undergone EMT are exposed to highly stressful condition, the ability of CDH6 to control cell metabolism unveiled a novel cadherin-mediated mechanism to sustain cancer metastasization.
CDH6 interaction with autophagic proteins is mediated by non-redundant LIR domains
The specific binding among autophagic machinery and other proteins involved in the process is usually mediated by the LC3-interacting region (LIR) motif. The LIR motif is constituted by a series of negatively charged residues followed by the sequence WxxL (55). In the cytoplasmic domain of CDH6 (cytoCDH6), 4 putative LIR motives (LIR 1-4) were found (Figure 16a). Deletion mutants for each LIR domain were obtained to assay by GST pull-down their role in the binding with CDH6 interactors. Absence of LIR2 completely abrogated the interaction between cytoCDH6 and GABARAP, while the binding between cytoCDH6 and BNIP3 and BNIP3L was mediated by LIR3. Interestingly, deletion of LIR3 also increased cytoCDH6 affinity for GABARAP, suggesting a structural impedance (Figure 16b).
These data indicated that multiple LIR domains were needed for CDH6 interaction with GABARAP, BNIP3 and BNIP3L/Nix and that these motives did not have a redundant role. Next, the possibility that other cadherins may play the same functions of CDH6 in other tissues was taken into consideration. The sequences of the members of the cadherin family were aligned. Intriguingly, 18
44
Figure 16. a. Illustrated representation of CDH6 structure highlighting the 4 LIR motives in the cytoplasmic
domain and the respective aminoacidic sequence. b. GST pull-down of cytoCDH6 or its LIR deleted mutants with CDH6 interactors GABARAP, BNIP3 and BNIP3L/Nix. c. Alignment of cytoplasmic domains of cadherin family members highlighting the conservation of the four LIR domains found in cytoCDH6.
a b
45
Figure 17. Western Blot analysis of N-CAD, pFAK, DRP1 and LC3 in control or transfected with
Flag-cytoCDH6 TPC1 cells.
cadherins presented conserved LIR 1, 2 and 3 motives on their cytoplasmic domain, suggesting that other members of the cadherin family could interact with autophagic proteins and have a role controlling the process. In contrast, LIR 4 was only present in CDH6 sequence (Figure 16c). Remarkably, the epithelial CDH16, whose expression was enhanced in absence of CDH6, did not present any LIR motives, lacking the cytoplasmic domain. This observation suggested that switch between CDH16 and CDH6 in thyroid cancer functions as a crucial event in blocking autophagy, promoting the acquisition of an EMT phenotype in this tumor.
CDH6 membrane localization is needed for its function
To try to revert the phenotype observed upon silencing experiments previously performed, CDH6 over-expression in TPC1 cell line was carried out. Since it was not possible to over-express the full-length protein, only the cytoplasmic domain of CDH6, which contains
LIR motives and can interact with BNIP3, BNIP3L and GABARAP was used. The effects of the transfection of cytoCDH6 were assessed by western blot to check the levels of the key protein found altered in the CDH6-silencing experiments. cytoCDH6 overexpression did not alter the control cells phenotype (Figure 17). This result may imply that the whole CDH6, and particularly its transmembrane domain which allows its localization on the plasma membrane, is necessary to induce cytoskeleton reorganization and to restrain autophagy.
46
Genome-wide analysis of H3K27AC profile during TGFβ -mediated EMT
The recent systematic functional analysis of noncoding genome by the ENCODE project has revealed that gene expression is far more complicated than expected and that the precise spatiotemporal expression of a gene needs a continuous and widespread regulatory landscape involving a specific genomic architecture and the hierarchical interactions of multiple interspersed regulatory elements (56). Furthermore, the ENCODE project demonstrated that chromatin exists in multiple functional states, which correlate with the extent of gene expression. This implies the possibility to predict gene expression variations by picturing the overall landscape of chromatin functional status. TGFβ-mediated EMT is sustained by the activation of a complex transcriptional program. However, the genome-wide effect of TGFβ on the transcriptional activation status of the chromatin has not yet been described. Furthermore, it was demonstrated that also CDH6 expression is controlled at the transcriptional level by TGFβ during EMT and that the transcription factor RUNX2 partially mediates this activation, even though the exact mechanism of this regulation is still to be defined. Acetylation of lysine 27 of histone 3 (H3K27ac) is commonly used to map transcriptionally active regulatory elements (57,58).
In the attempt to mark TGFβ responding transcriptional elements adding information on the regulatory network during EMT, and to find CDH6 regulatory regions, analysis of genome-wide changes in the profile of H3K27ac upon TGFβ stimulation was performed.
Chromatin Immuno-Precipitation followed by sequencing (ChIP-seq) analysis for H3K27ac on Nthy-ori-3,1 cells treated with TGFβ or not treated was performed. 22775 peaks were called in this analysis. Peak to target assignment was used to associate each detected peak with the nearest Transcription Starting Site (TSS). The distribution of the peak distances to the nearest TSS is displayed in Figure 18a.
47
Figure 18b shows the Venn Diagram representing the total number of TSS-associated regions that were defined by this analysis. 8604 TSS-associated regions presented the same peaks in both experimental conditions, 48 had enriched peaks only in condition 1 (NT) and 1025 had enriched peaks only in condition 2 (TGFβ). Of these, 164 regions were specific of one condition, 10 were exclusive of NT cells while 154 were detected solely in TGFβ-treated condition (Figure 18c). Alignment of the detected peaks to the human reference genome (GRCh38/hg38) showed no peaks in either condition (NT or TGFβ) within the CDH6 locus (Figure 19a). This could be determined either by the fact that the TGFβ effect on CDH6 is not mediated by changes in the chromatin transcriptional status of the gene locus, or by the fact that some regions were not correctly covered by the sequencing. However, also the analysis of the ENCODE annotation data for the CDH6 locus, in non-thyroid derived cell lines, did not evidenced any relevant H3K27ac peak.
By contrast, analysis of well-known TGFβ target genes, like N-CAD and SNAI1, showed a significant peak enrichment in TGFβ-treated cells (Figure 19b,c) coherently with the gene expression induction of these transcripts (Figure 19d).
48 TGFβ NT a c Distance from TSS a b d
Figure 18. a. Density vs distance from Transcription Starting Site (TSS) of the peaks called in the ChIP-seq
analysis for the two conditions (NT and TGFβ). b. Venn diagram showing all genes correlated to enriched H3K27ac peaks resulted from ChIP-seq analysis in not treated, TGFβ treated or in both conditions. c. Venn diagram showing genes correlated to enriched H3K27ac peaks from ChIP-seq analysis only present in NT or TGFβ condition. d. Pie chart representing the different typologies of transcripts distribution among the TSS-associated regions enriched in TGFβ condition. e. Pie chart displaying the distribution of non-coding RNAs typologies among the non-coding TSS-associated regions enriched in TGFβ condition.
49
CDH6
N-CAD
SNAI1
Next, we focused on the 1025 TSS-associated regions detected upon TGFβ treatment.
Among these, 70,5% (723/1025) were protein-coding genes, 28% (287/1025) were regions transcribing for non-coding RNAs and 1,5% (15/1025) were pseudogenes (Figure 18d). Among the non-coding elements, 38,7% (106/287) were non-coding or antisense RNAs, 28,8% (79/287) were long non-coding RNAs (LncRNAs), 28,1% (77/287) were micro RNAs (miRNAs) and 4,4% (12/287) were small-nucleolar RNAs (snoRNAs) (Figure 18e). These results were very interesting
Figure 19. a-c. Evaluation of H3K27ac peaks enrichment in CDH6 (a), N-CAD (b) and SNAI1 (c) loci.
Peaks found in both conditions (NT and TGFβ treated), or unique regions found in condition 2 (TGFβ) are shown. d. Relative expression of N-CAD, CDH6 and SNAI1 in Nthy-ori-3,1 not treated or treated with 5 or 100 ng/ml of TGFβ. N° of replicates =3 *P=0.05, **P=0.01, ***P=0.001. c d a b ** ** ***
50
since nc-RNAs control gene expression from transcription to protein stability, localization and function (59). Indeed, the role of non-coding RNAs as regulatory molecules and key regulators in physiological and pathological contexts is opening new perspective in this field of study (60).
Afterwards, Gene Ontology enrichment analysis was performed to define pathways significantly affected by TGFβ signaling in thyroid cells (Table 6).
TABLE 6 Gene Ontology analysis
Pathway ID Pathway description Gene count False discovery rate
GO.0009653 anatomical structure morphogenesis 150 4.16e-18
GO.0009966 regulation of signal transduction 146 1.08e-11
GO.0048869 cellular developmental process 181 1.08e-11
GO.0048518 positive regulation of biological process 245 1.26e-11
GO.0030154 cell differentiation 173 2.25e-11
GO.0048646 anatomical structure formation involved in morphogenesis 80 6.16e-11
GO.0009893 positive regulation of metabolic process 186 6.65e-11
GO.0007165 signal transduction 227 1.19e-10
GO.0044700 single organism signaling 238 1.19e-10
GO.0007154 cell communication 241 1.83e-10
GO.0010646 regulation of cell communication 159 1.83e-10
GO.0023051 regulation of signaling 153 1.97e-10
GO.0048731 system development 186 2.18e-10
GO.0048856 anatomical structure development 206 3.6e-10
GO.0048519 negative regulation of biological process 209 7.68e-10
GO.0048522 positive regulation of cellular process 212 1.29e-09
GO.0050793 regulation of developmental process 124 2.39e-09
GO.0048523 negative regulation of cellular process 195 3.16e-09
GO.0051716 cellular response to stimulus 265 3.39e-09
GO.0007399 nervous system development 119 3.47e-09
GO.0032502 developmental process 221 4.76e-09
GO.0051128 regulation of cellular component organization 124 1.07e-08
GO.0051270 regulation of cellular component movement 59 2.56e-08
GO.1902531 regulation of intracellular signal transduction 90 3.06e-08
GO.0040011 locomotion 81 3.54e-08
GO.0022008 neurogenesis 90 5.14e-08
GO.0030198 extracellular matrix organization 38 8.94e-08
GO.0031325 positive regulation of cellular metabolic process 147 8.94e-08
GO.0048729 tissue morphogenesis 50 1.16e-07
GO.0030334 regulation of cell migration 51 1.46e-07
GO.0042060 wound healing 55 1.9e-07
GO.2000145 regulation of cell motility 52 3.61e-07
GO.0040012 regulation of locomotion 54 6.57e-07
GO.0006950 response to stress 161 6.07e-06
GO.0006935 chemotaxis 48 6.29e-06
GO.0007155 cell adhesion 63 1.02e-05
GO.0016477 cell migration 52 2.55e-05
GO.0008284 positive regulation of cell proliferation 54 3.08e-05
GO.0090287 regulation of cellular response to growth factor stimulus 25 3.64e-05
GO.0000902 cell morphogenesis 60 3.84e-05
GO.0030155 regulation of cell adhesion 43 3.84e-05
GO.0030029 actin filament-based process 35 4.52e-05
GO.0032270 positive regulation of cellular protein metabolic process 75 4.54e-05
GO.0030036 actin cytoskeleton organization 33 4.97e-05
GO.0042221 response to chemical 167 5.19e-05
GO.0019222 regulation of metabolic process 254 6.03e-05
GO.0051674 localization of cell 54 6.09e-05
51
Furthermore, protein-protein network analysis was performed using STRING database. Several gene modules were predicted from this analysis (Figure 20). Among the discovered modules, in accordance with the pathways found in the GO analysis, proteins involved in structure, morphogenesis and cell motility were found. This is in line with the fact that TGFβ-mediated EMT massively relies on the re-organization of cell structure and on the reactivation of morphology-related genes (Figure 20a). These modifications also involve the up-regulation of genes which promote cell motility, to sustain cell migration (Figure 20b). Noticeably, several genes networks were detected, including endocytosis related genes and components of the PI3K–pathway respectively (Figure 20c,d). This further underlines the involvement of autophagy in TGFβ-mediated EMT and supports our data.
In conclusion, these data are in accordance with the role of TGFβ in mediating EMT also in thyroid cancer cells, but, most importantly, sustain the hypothesis that EMT activation in these cells is related to a massive re-organization of the transcriptional program which involves pathways that regulate autophagy and cell metabolism.
52
Figure 20. Examples of STRING protein-protein interaction prediction of the genes enriched in
TGFβ-treated cells, based on ChIP-seq data. a. Anatomical structure morphogenesis. b. Cell migration. c. Endocytosis
d. PI3K pathway a d c b
53
54
Cadherins are transmembrane proteins which major function is to organize cell and cell-microenvironment interactions. However, cadherins are not just structural proteins, but they also act like hubs for the intracellular signaling transduction controlling many cellular processes. The way cadherins mediate biological processes, including transcriptional regulatory pathways, still needs to be characterized.
In this study, we showed for the first time that CDH6 supports EMT and interferes with autophagy and mitochondrial dynamics, highlighting a previously unknown function of cadherins in cancer. Based on our data, we proposed the following model: CDH6 expression is up-regulated following pro-metastatic signals like TGFβ. CDH6 substitutes epithelial cadherins like CDH16 on cell membrane, leading to changes in cytoskeleton architecture and loosening of cell-cell interactions, promoting cell migration and invasiveness. CDH6 direct interaction with GABARAP restrains autophagy, overcoming the negative effect of this process on EMT completion. Finally, CDH6-mediated autophagy repression promotes DRP1-CDH6-mediated mitochondrial hyper-fission, which in turn provides faster ATP production necessary for cytoskeleton rearrangement and for the development of movement structures (Figure 21). Finally, we proved that CDH6 expression is a highly specific marker of metastatic well-differentiated PTCs, laying the basis for its possible use for risk-based stratification in the clinical setting of thyroid cancer patients.
We demonstrated that autophagy activation is regulated by CDH6 direct interaction with GABARAP but the process is also affected by the regulation of the activation state of the autophagy-modulator protein AKT. Thus, we hypothesize that CDH6 restrains autophagy both directly, binding GABARAP, and indirectly, through a signal transduction regulation which affects the activation of the PI3K-classI pathway. In accordance with our hypothesis, a recent work showed that GABARAP
55
expression negatively correlates with AKT phosphorylation inhibiting prostate cancer proliferation and metastasization (61).
EMT and autophagy are biological processes with a pivotal role in cancer development and progression. The catabolic function of autophagy aids cancer cells to overcome the great variety of stresses to which they are exposed during tumor progression, including deprivation of oxygen and nutrients. On the other side, EMT transdifferentiation allows cancer cells to acquire mesenchymal features that support cell proliferation and migration (18).
Recently, several studies addressed the complex relationship between EMT and autophagy, demonstrating that the interplay between these processes in cancer is tissue and phase-dependent. On one hand, cells in which the EMT program is activated require autophagy to survive during the metastatic spreading. On the other hand, during the early phases of cancer metastasization, autophagy acts as oncosuppressive process degrading crucial EMT-driving transcription factors (62-64).
To date, the molecular mechanisms that regulate the interplay between autophagy and EMT is far to be fully characterized. However, several observations suggest that the functional interaction between cytoskeleton and mitochondria is a regulatory center connecting these two processes (65,66).
Cytoskeleton controls mitochondrial dynamics, cooperating to dictate mitochondria availability along the cell. This process controls the number and structure of mitochondria, regulating cancer cells energy production, which in turn is necessary to re-organize cytoskeleton and to sustain EMT-induced cell movement (18). Our data is in agreement with this model, indeed, CDH6 silencing can partially revert EMT program, changing cytoskeleton organization and modifying both mitochondrial structure and function (Figure 21).
Differently from what usually assumed, EMT is not a single-step process but cancer cells must undergo through series of progressive stages to fully accomplish this transdifferentiation. Recently,
56
Klymkowsky and Savagner debated about the erroneous use of the general term EMT to describe all these intermediate stages, clarifying that it would be more appropriate to talk of EMT-related processes (67).
We showed that CDH6 positive cells, localized at the invading front of the tumor mass, still retained E-CAD expression. This suggests that these cells reside in a partial EMT state, recalling of a phenomenon called collective cell migration.
During collective cell migration, cells undergo a partial EMT, changing their morphology toward a spindle like phenotype and re-organizing cell cytoskeleton and cell-cell adhesions (68). In these invading cells, E-CAD expression is an advantage to maintain cell cohesiveness, that in turn facilitate migration, protecting single cells from external mechanical stresses (69). Several studies, indeed, demonstrated that collective cell migration is the main modality of tumor cells invasiveness and significantly contributes to epithelial cancer metastatic spreading (70,71).
Autophagy activation may affect mitochondrial dynamics in two opposite ways. On one side, autophagy as catabolic process can target mitochondria to degrade them. This process, called mitophagy, requires mitochondrial fission in order to allow autophagosomes to engulf and degrade single mitochondria. On the other side, the massive activation of autophagy has been reported to promote mitochondrial fusion to protect these organelles from massive degradation. Noticeably, the autophagy-related mitochondria hyper-fusion has been associated with cell migration inhibition (72,73).
The complex interplay between autophagy and mitochondrial dynamics is crucial to determine cell fate and behavior, and cytoskeleton is a fundamental player in this crosstalk. Indeed, cytoskeleton acts like a mechanical regulator of mitochondrial morphology and localization. Whether these changes also reflect a modification in mitochondrial function is still to be defined. Unbalance