€
BY NCLessons Learnt, Evaluation and
Revision of the LED Process
Lezioni imparate, valutazione e
revisione del processo LED
Keywords: survEy, AnAlysis, fEEdbAck, dEmocrAtic AttitudE, sociEtAl Groups Parole chiave: indAGinE, AnAlisi, fEEdbAck, AttEGGiAmEnto dEmocrAtico, Gruppi sociAli
According to analytical methods the LED project conducts a comprehensive survey about the online seminar and the intensive study program. The study based on the students aspect and examining their preferences and usage patterns. In order to get relevant results the survey has to consider the cultural diversity and the various ways of attendance that the project allows for the participants.
For the comparison of process improvement the LED team carried out a pre and a post survey at each program. The sections of the survey were about individual information, objectives and motivations, general statements related to democratic attitude, skills, expectations, experiences with virtual working or participation. As the project has finished, we can draw the conclusions of the process by comparing the results of the three years.
Secondo i metodi analitici, il progetto LED conduce un'indagine completa sul seminario online e sul programma di studio intensivo. Lo studio si basa sull'aspetto studenti ed esamina le loro preferenze e i loro modelli di utilizzo. Per ottenere risultati significativi, l'indagine deve considerare la diversità culturale e le diverse modalità di partecipazione che il progetto consente ai partecipanti.
Per confrontare il miglioramento del processo, il team LED ha effettuato un'indagine pre e post in ciascun programma. Le sezioni dell'indagine riguardavano informazioni, obiettivi e motivazioni individuali, dichiarazioni generali relative all'atteggiamento democratico, alle competenze, alle aspettative, alle esperienze di lavoro virtuale o alla partecipazione. Al termine del progetto, possiamo trarre le conclusioni del processo confrontando i risultati dei tre anni.
Appendix
Appendice
Albert Fekete
Anita Reith
Ádám Weiszer
A
ccording to analytical methods the LED project conducts a comprehensive survey about the online seminar and the intensive study program. The study was based on the students aspect examining theirfilled out the final form (Fig. 1).
For the comparison between the student’s expectation and experience the LED team carried out a pre- and a post-survey at each program.
The purpose of the pre-post surveys
were to test people’s transformation with regard to values and attitudes about participation, their understanding of the professional responsibility as planners and designers to engage in landscape democratic work. Their improvement in terms of skills and knowledge required to be effective in resolving landscape democracy challenges internationally. The sections of the survey were the following:
•
personal datain order to get knowledge (such as gender, nationality, participation type, and current activity) about the spectrum of the participants
•
objectives and motivationsto get information about the differences and similarities of the participants’ background knowledge preferences and (usage) patterns. In
order to get relevant results the survey has to consider the cultural diversity and the various ways of attendance that the project allows for the participants. We wanted to reflect on and keep the pulse of the shifts and transformations of the students as they engaged with the seminar activities, both online and during the intensives. Important to declare that we examined the survey as landscape architects, we did not used statistical trials.
During the online seminars and the intensive programmes, different statistics were made based on the actual number of the active or passive students. In this chapter we are just analyzing the survey based on only those participants who
Democratic attitude
1 = total disagreement / 6 = total agreement
Number of participants in the survey,
online seminar (OS):
Number of participants in the survey,
intensive programme (IP):
Pre-survey Post-survey Pre-survey Post-survey Pre-survey Post-survey
n
n
94 66
23 15
57 51
15 12
71 44
22 11
2016 2017 2018SECTIONS OF THE pre-survey SECTIONS OF THE post-survey
•
PERSONAL DATA•
OBJECTIVES AND MOTIVATIONS•
DEMOCRATIC ATTITUDE•
SKILLS•
EXPECTATIONS•
PREVIOUS EXPERIENCES•
EXTRA FEEDBACK•
PERSONAL DATA•
DEMOCRATIC ATTITUDE•
SKILLS•
EXPECTATIONS•
PREVIOUS EXPERIENCES•
EXTRA FEEDBACKto the project goals and the harmony to each other
•
democratic attitudegeneral statements related to the students approach towards the basic principles of the educational
method
•
skillspersonal statements related to the tools and communication capabilities that needed to work effectively and adapt themselves towards the project method
•
expectationsto get information on how the teaching content correlates to their lack of knowledge
•
previous experiencesboth active and passive participants with virtual working, wiki editing and participation
•
opportunity to leave extra feedback The questionnaire contained different types of questions – some had checklists, some had Likert scale. Also some open questions were asked so students could explicate their opinion on several subjects and leave valuable feedback in order to improve the programme. Standard deviation were used to analyze the results, mostly descriptive statistics and average response rates for Likert scale questions.ONLINE SEMINAR
In 2016 the survey of the online seminar Figure 1
had 160 records from 35 countries (pre-survey:94 records, post-survey:66 records) (Fig. 2).
In 2017 the survey of the online seminar had 108 records(pre-survey: 57 records, post-survey: 51 records) from 27 countries (Fig. 3). In 2018 the pre-surveys of the online seminar HAD 71 RECORDS FROM 30 COUNTRIES (Fig. 4).
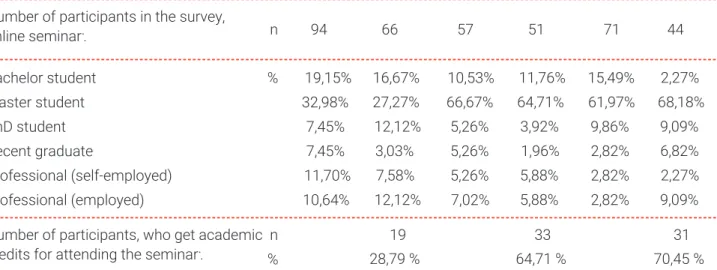
The maps indicate the countries where the seminar participants were from. This information is based on the results of the surveys which means that it only contains the students who have filled out the questionnaires in the different year. The majority of the participants in the first two years of the LED program were master students, however in 2016 master’s students accounted for only one third of the participants, while in 2017 and 2018 the number of master’s students increased to two out of three participants. Interesting result that the number of landscape architect decreased from 43% to 35% in the program which means that other professions were engaged, too – such as: urban planners and designers, architects, and other social or engineering professionals. Post-survey results revealed that two third of the students got academic credits for attending the seminar (Fig. 5). Based on the results (Fig. 6) of the pre-surveys, the objectives for the participants haven’t changed through the years: the most relevant objective was to understand how democracy, access to landscape and participation are related. The second and third highest rated answer was regarding inclusion of diverse societal groups in planning and design and to be able to identify and approach landscape democracy challenges. The main motivation for participation were interaction with others with the same interest all around the world and extending knowledge. Getting credits were not a priority for the majority. The students were certainly
Figure 2: Participants of the online seminar in 2016 Figure 3: Participants of the online seminar in 2017 Figure 4: Participants of the online seminar in 2018
Figure 5: Personal datas Figure 6: Objectives and motivation
Personal datas
100% = the number of the those who filled the survey
Number of participants in the survey, online seminar:
Pre-survey Post-survey Pre-survey Post-survey Pre-survey Post-survey
n 94 66 57 51 71 44
Number of participants, who get academic credits for attending the seminar:
n % 19 33 31 28,79 % 64,71 % 70,45 % 2016 2017 2018 Bachelor student Master student PhD student Recent graduate Professional (self-employed) Professional (employed) % 19,15% 32,98% 7,45% 7,45% 11,70% 10,64% 10,53% 66,67% 5,26% 5,26% 5,26% 7,02% 15,49% 61,97% 9,86% 2,82% 2,82% 2,82% 16,67% 27,27% 12,12% 3,03% 7,58% 12,12% 11,76% 64,71% 3,92% 1,96% 5,88% 5,88% 2,27% 68,18% 9,09% 6,82% 2,27% 9,09%
Objectives and motivation
100% = the number of the those who filled the survey Pre-survey Post-survey Pre-survey Post-survey Pre-survey Post-survey n=94 n=66 n=57 n=51 n=71 n=44 2016 2017 2018 54,54% * 27,27% * 18,18% * 0% * 27,50% * 47,50% * 22,50% * 2,50% * 44,74% * 44,74% * 5,26% * * % 6 2 , 5 I want to understand how democracy, access to
landscape and participation are related.
Most relevant objectives for participants:
I want to learn more about methods and tools of public participation.
I want to be able to identify and approach land -scape democracy challenges in my environment. I want to include diverse societal groups in planning and design.
34,04 % 24,56 % 33,80 %
25,53 % 17,54 % 18,31 %
9,57 % 14,04 % 15,49 %
6,38 % 19,30 % 12,68 %
My working group has met the objectives of the seminar assignments:
-absolutely -mostly
-met the minimum requirements -no we did not
interested in the virtual environment and intercultural group work according to the pre-survey in all years. Expectations before the online seminar were also more or less the same through the years: gaining new experience in collaboration (intercultural groups, online surface, virtual communication). Also it was significant that in 2017 more students emphasized that they expected to learn a new approach in design and improve
Skills
100% = the number of the those who filled the survey Pre-survey Post-survey Pre-survey Post-survey Pre-survey Post-survey
2016 2017 2018
Percentage of the students already used collaborative mapping as a working tool:
Percentage of the students already used field workshop as a working tool: Percentage of the students already used surveys/questionnaires as a working tool:
Percentage of the students already used round table as a working tool:
Percentage of the students already used design game as a working tool:
Percentage of the students already used community planning a working tool:
Percentage of the students already used future search conference as a working tool: Percentage of the students already used design workshop/charrette as a working tool:
Percentage of the students already used open space workshop as a working tool: Percentage of the students already used reconnaissance trips as a working tool: Percentage of the students that do not have working experience any of these tools:
22.34 % 25.53 % 38,60 % 56,14 % 30,99 % 49.30 % 56.38 % 36.17 % 61,40 % 45,61 % 63.38 % 43.66 % 28.72 % 37.23 % 33,33 % 36,84 % 35.21 % 35.21 % 9.57 % 4.26 % 23.40 % 12.77 % 6.38 % 15,79 % 7,02% 33,33 % 22,81 % 10,53 % 9.86 % 7.04 % 38.03 % 18.31 % 11.27 % n=94 n=57 n=71 Working experience with tools:
professional skills. In 2018, more than two third of the students mentioned they wanted to learn about landscape democracy or democratic design. During the online seminar, the virtual classroom was a pioneer aspect of the collaboration. In the pre-surveys of 2016 and 2017 half of the participants declared that they had already worked in a virtual team and that they had attended lectures
in a virtual classroom before.
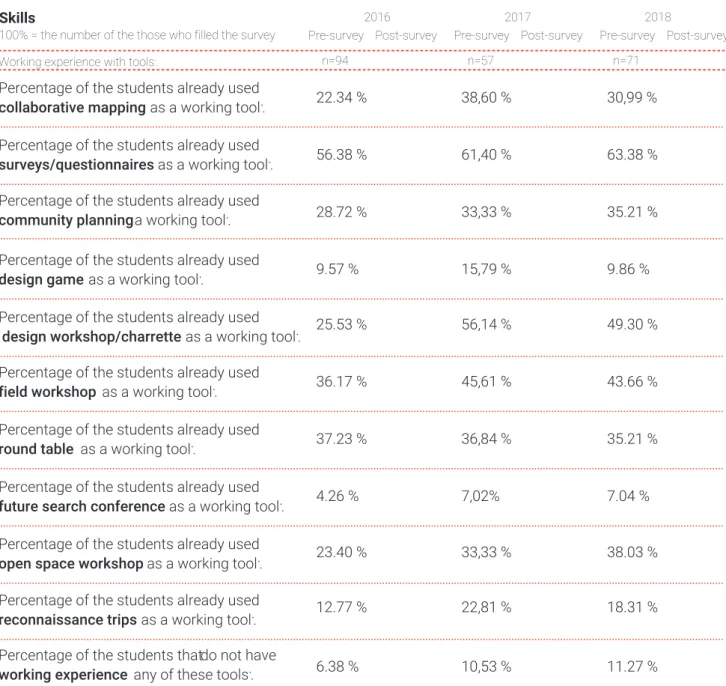
To acquire the democratic design attitude, the participants learned different methods for mapping the community needs. For this process they could utilize the tools in (Fig. 7).
Survey/questionnaires are a well-known method among the participants. Only a small number of attendees were unfamiliar with community engagement
Skills
100% = the number of the those who filled the survey Pre-survey Post-survey Pre-survey Post-survey Pre-survey Post-survey
2016 2017 2018
n=94 n=57 n=71
Experience of working with children (kindergarden):
Experience of working with people with special needs:
Experience of working with children (primary school):
Experience of working with unemployed: Experience of working with young adults: Experience of working with children (secondary education):
Experience of working with immigrants: Experience of working with elderly people:
Experience of working with refugees:
Do not have working experience any of these societal groups: 25,53 % 23,40 % 26.32 % 40,35 % 18,31 % 21,13 % 40,43 % 20,21 % 36.84 % 28,07 % 32,39 % 22,54 % 27,66 % 7,45 % 29,82 % 12,28 % 22,54 % 15,49 % 45,74 % 12,77 % 7,45 % 8,51 % 63,16 % 15,79 % 10,53 % 12,28 % 66,20 % 16,90 % 9,86 % 19,72 %
Societal groups with whom you have already worked:
Figure 8: Skills
research tools. Thus, during the teamwork meetings, we facilitated them in order to improve these as well as other necessary skills.
In the pre-surveys students were also asked to specify societal groups with whom they had previously worked (FIG. 8).
The chart reveals that most of the students had experience working peers primarily within their age group. That said, it turned to be beneficial and
necessary that students were informed and prepared on how to approach societal groups that typically did not encounter such as immigrants, refugees and the unemployed (FIG. 9).
In a ranking system from 1 to 6, students were asked to evaluate the lectures. For both year, 2016 and 2017, lectures scored higher than 4, this means that lectures were:
•
clear and easy to follow (4,8 and 4,5)•
engaged well with the audience (4,6and 4,5)
•
logical sequence between the individual lectures (4,7 and 4,2) In both years, students chose the topic of Engaging communities: theories and tools for participation as the most valuable seminar topic. With regards to the assignments, students were very satisfied - all the positive statements were ranked higher than 4 (out of 6):•
the length of the session (4,7 and 4,3)•
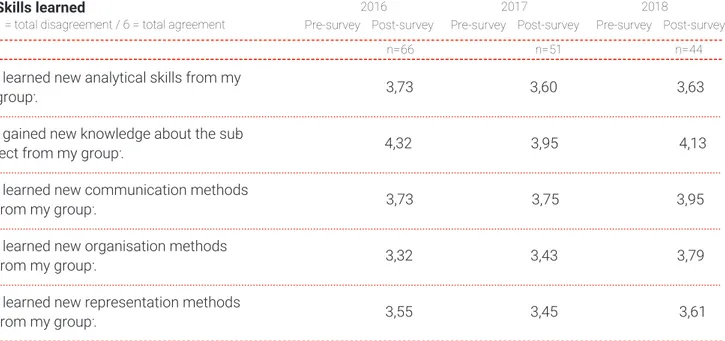
assignments fitting into the structure of the seminar (4,7 and 4,3)Skills learned
1 = total disagreement / 6 = total agreement
I learned new analytical skills from my group:
I gained new knowledge about the sub-ject from my group:
I learned new communication methods from my group:
I learned new organisation methods from my group:
I learned new representation methods from my group:
Pre-survey Post-survey Pre-survey Post-survey Pre-survey Post-survey
3,73 4,32 3,73 3,32 3,55 3,60 3,95 3,75 3,43 3,45 3,63 4,13 3,95 3,79 3,61 2016 2017 2018 6 6 = n n=51 n=44 Skills learned
1 = total disagreement / 6 = total agreement
We struggled with different disciplinary backgrounds and understandings: I am more confident about working in an intercultural team:
It is now easier for me to express myself in English:
I think the cultural diversity improved the outcomes of our team:
Pre-survey Post-survey Pre-survey Post-survey Pre-survey Post-survey
2,32 2,18 4,32 4,68 3,59 4,63 4,45 4,13 4,36 4,55 2,73 4,38 4,38 4,30 4,23 2016 2017 2018 6 6 = n n=51 n=44
I think working in an intercultural team requires more effort than working in a culturally homogeneous group:
•
chat moderation (4,6 and 4,3)•
received sufficient feedback duringpresentations and assignments (4,6 and 4,2)
•
interactive polls (4,5 and 4,2)•
assignment presented clearly (4,2and 4,1)
Students were fairly neutral (3-4) with resepct to the question of having more engagement with the lecturers and other students. Results showed that students liked more or less equally the different assignments throughout the seminar. Overall, students were very satisfied with the virtual environment provided
and indicated that they learned a lot in this field as well.
In order to compare the pre- and post-surveys and measure the students’ development, we introduced 29 statements, each reflecting a particular attitude toward landscape democracy
Figure 9: Skills learned Figure 10: Skills learned
Experiences
1 = total disagreement / 6 = total agreement
A virtual seminar can be as interactive as a face-to-face seminar.
I like to learn by collaborating in a group. A virtual seminar allows me to work at my own place.
I feel confident collaborating in a virtual environment.
I feel confident when expressing myself in English.
Pre-survey Post-survey Pre-survey Post-survey Pre-survey Post-survey
3,72 4,00 4,73 4,95 4,20 4,14 4,04 4,38 4,54 4,79 3,81 3,73 4,98 4,47 4,16 3,96 4,39 4,20 4,25 4,49 3,45 3,61 4,51 4,52 4,15 4,18 3,75 4,11 4,41 4,70 2016 2017 2018 n=94 n=66 n=57 n=51 n=71 n=44 Most relevant objectives for participants:
Personal datas
100% = the number of the those who filled the survey
Number of participants in the survey, intensive programme:
Pre-survey Post-survey Pre-survey Post-survey Pre-survey Post-survey
n 23 15 15 12 22 11
Number of participants, who expecting
academic recognition for attending IP: % 54,17 % 66,67 % 68,18 %
2016 2017 2018
Bachelor student Master student PhD student Recent graduate
Regarding the online seminar that pre-ceeded the intensive programme:
-attended as active participant -attended as passive participant -did not attend the online seminar -attended last year
% % 16,67 % 79,17 % 0 % 0 % 46,64 % 26,67 % 26,67 % 6,67 % 20,00 % 73,33 % 0 % 6,67 % 83,33 % 0 % 16,67 % 0 % 22,73 % 72,73 % 4,55 % 0 % 45,45 % 18,18 % 18,18 % 18,18 % Figure 11: Experiences Figure 12: Personal datas
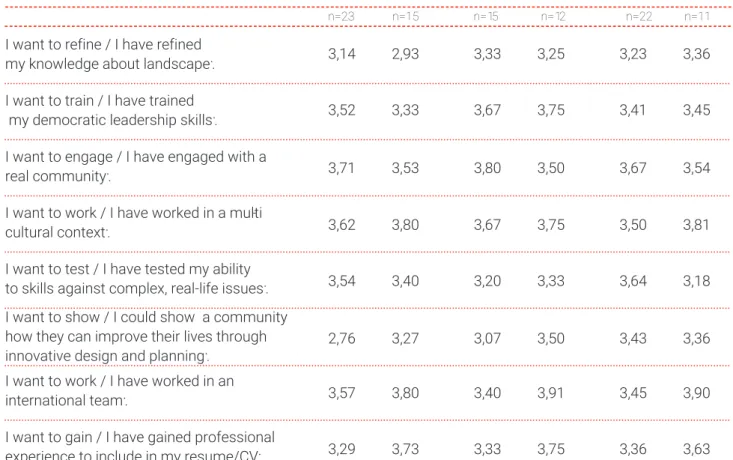
Expectations
1 = total disagreement / 4 = total agreement
I want to refine / I have refined my knowledge about landscape: I want to train / I have trained my democratic leadership skills:
I want to engage / I have engaged with a real community:
I want to show / I could show a community how they can improve their lives through innovative design and planning:
I want to work / I have worked in a multi -cultural context:
I want to work / I have worked in an international team:
I want to gain / I have gained professional experience to include in my resume/CV: I want to test / I have tested my ability to skills against complex, real-life issues:
Pre-survey Post-survey Pre-survey Post-survey Pre-survey Post-survey
3,14 2,93 3,52 3,33 3,71 3,53 2,76 3,27 3,62 3,80 3,57 3,80 3,29 3,73 3,54 3,40 3,33 3,25 3,67 3,75 3,80 3,50 3,07 3,50 3,67 3,75 3,40 3,91 3,33 3,75 3,20 3,33 3,23 3,36 3,41 3,45 3,67 3,54 3,43 3,36 3,50 3,81 3,45 3,90 3,36 3,63 3,64 3,18 2016 2017 2018 n=23 n=15 n=15 n=12 n=22 n=11
in design and planning or a particular set of skills that could the students could develop significantly through the seminar.
Looking at the chart (Fig. 10) the number of participants from 2016 (18%) to 2017 (37%) who answered the question: working group of his/ hers has mostly met the objectives of the seminar assignments, increased. Students reported that through the seminar they gained significant new knowledge about the subject from their group. According to the data, the most positive aspects for students were mentioned; the ‘assimilation of different point of views’, ‘get experience in virtual communication’, and the ‘possibility to get to know people from far away’. The data also indicated that, in all years, there were inequalities with the groups –
some people contributed much less than others. They mentioned reasons such as ‘mixing students who need grades with other who are only interested in the topic’, ‘managing the different time zones’, ‘finding good tool to communicate and share work that fits all the members’. Despite of the difficulties in both years, participants reported that they feel more confident about working in intercultural teams (FIG. 11). Participants of each year agreed that working in an intercultural team requires more effort but that the cultural diversity improved the outcomes of the team. Students in 2016 enjoyed learning by collaboration in a group more once they had experienced the seminar, whereas in 2017, this number decreased slightly but still ranked high.
Working in an international and intercultural group within a virtual
platform is always a challenge (Fig. 11). By the chart as we can see this working mThe chart reveals that this method of working was accepted by the participants because the answers and the values are still positive and mostly increased in the post-surveys..
Comparing the pre- and post-survey for 2016 and 2017, the following changes were determined as the most significant from the students’ view: (ranking from 1-6)
•
Students were less likely to learn individually after the seminar.•
They answered they felt more confidentwhen expressing themselves in English after the seminar.
Expectations
1 = total disagreement / 4 = total agreement
I received constructive and sufficient support from my supervisors:
Pre-survey Post-survey Pre-survey Post-survey Pre-survey Post-survey
3,80 3,75 3,18
2016 2017 2018
n=23 n=15 n=15 n=12 n=22 n=11
For me the door to landscape democracy is... -slightly open -half open -wide open -not displayed % 4,17% 58,33% 25,00% 12,50% 13,33% 33,33% 53,33% 0 % 13.64% 54.55% 31.82% 0 % 13,33% 46,67% 40,00% 0 % 0 % 33,33% 66,67% 0 % 18,18% 45,45% 36,36% 0 % INTENSIVE PROGRAMME (THEREAFTER: IP)
The students received questions before and also after the Intensive Programme, they ranked their expectations and experiences on a 1-4 scale.
In 2016 the survey of the intensive programme had 36 records overall (pre-survey: 21 records, post-(pre-survey: 15 records). In 2017 the survey of the intensive programme had 27 records overall (pre-survey: 15 records, post-survey: 12 records).
In 2018 the survey of the intensive programme had 33 records overall (pre-survey: 22 records, post-survey: 11 records).
The majority were master students in both years (70-80%), with an academic in landscape architecture (approximately 55% in 2016, and more than 66% in 2017). An Architecture background was also significant, representing approximately 40-45% in both years (Fig. 12).
Students stated very clearly in the pre-surveys that they want to refine their knowledge about landscape democracy, with a ranking from 1-4 of how important the previously mentioned statement was, the average response was 3.5 in both years, which means it was statistically
significant. With regards to the IP and whether it was useful and refined their knowledge, the second year responses in the pre-survey averaged 3.67 and 3.75 in the post survey. (Fig. 13)
It can also be strongly stated that, according the they pre-survey data, students wanted to engage with a real community (scoring 3.8) however, after the IPs this record declined in both years and scored 3.5. They wanted to gain a better understanding of how participatory design is implemented (3.6). In addition, another indicative statement was whether students wanted to experience landscape democracy in a culture different than their own (ranking 3.4-3.5) and working in a multicultural context (this response increased after the IP in both years from 3.7 to 3.8). An objective for many students was to apply their academic training in design/ planning to work for the benefit of a community that was in need (score of 3.4). In addition, they also wanted to partner with a community to envision better futures (score of approximately 3.2).
Based on the IP, more students said that they tested their ability to skills against complex, real-life issues (around 3.4), as previously expected or to prior to the IP (approximately 3.2).
Training democratic leadership skills were also important for students, although this scored much lower (around 2-3.3). More relevant was the possibility to promote democratic decision making in landscape changes, especially for the 2017 group. In this year, the average rank was around 3.6, however in 2016, it was only around 3.2.
The Intensive Programme revealed that one of the most significant changes for students were the change in their desire to show a community how they can improve their lives through innovative design and planning. Before the IP, in both years, the students ranked this statement at 2.8-3.0, yet in the post survey this statement scored to 3.3-3.5. This means that after the IP they could show a community how they could improve their lives through innovative design and planning.
The students ranked the importance of improving their skills in designing sustainable cities and neighbourhoods, which scored between 3.2-3.3. However, this was not the highest ranked issue. The desire to work with an international team was scored both before and after the IP and resulted in scores of 3.4-3.5 and 3.8, respectively. The increased score following the IP can be interpreted that after the course experience, students
Most relevant objectives for participants:
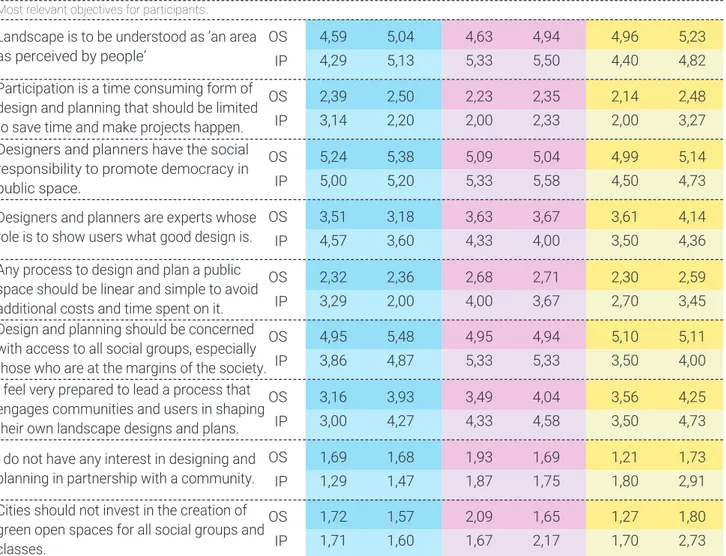
Democratic attitude
1 = total disagreement / 6 = total agreement
Landscape is to be understood as ‘an area as perceived by people’
Designers and planners have the social responsibility to promote democracy in public space.
Designers and planners are experts whose role is to show users what good design is. Any process to design and plan a public space should be linear and simple to avoid additional costs and time spent on it. Design and planning should be concerned with access to all social groups, especially those who are at the margins of the society. I feel very prepared to lead a process that engages communities and users in shaping their own landscape designs and plans. I do not have any interest in designing and planning in partnership with a community. Cities should not invest in the creation of green open spaces for all social groups and classes.
Participation is a time consuming form of design and planning that should be limited to save time and make projects happen.
Pre-survey Post-survey Pre-survey Post-survey Pre-survey Post-survey
OS IP OS IP OS IP OS IP OS IP OS IP OS IP OS IP OS IP 4,59 5,04 5,24 5,38 3,51 3,18 2,32 2,36 4,95 5,48 3,16 3,93 1,69 1,68 1,72 1,57 2,39 2,50 4,63 4,94 5,09 5,04 3,63 3,67 2,68 2,71 4,95 4,94 3,49 4,04 1,93 1,69 2,09 1,65 2,23 2,35 4,96 5,23 4,99 5,14 3,61 4,14 2,30 2,59 5,10 5,11 3,56 4,25 1,21 1,73 1,27 1,80 2,14 2,48 4,29 5,13 5,00 5,20 4,57 3,60 3,29 2,00 3,86 4,87 3,00 4,27 1,29 1,47 1,71 1,60 3,14 2,20 5,33 5,50 5,33 5,58 4,33 4,00 4,00 3,67 5,33 5,33 4,33 4,58 1,87 1,75 1,67 2,17 2,00 2,33 4,40 4,82 4,50 4,73 3,50 4,36 2,70 3,45 3,50 4,00 3,50 4,73 1,80 2,91 1,70 2,73 2,00 3,27 2016 2017 2018
had a stronger willingness to work within an international team. We could say that it became apparent to students that cooperation is a key element to a successful project.
The importance of professional experienced gained from the IP scored approximately 3.3 prior to the actual IP. However, following the IP, scores increased to more than 3.7 and students stated that they had received a kind of professional experience that could added to their resumes.
Considering the programme, students in both years, stated that they received
limited timeframe and could not always guarantee extended meetings with stakeholders. Nevertheless, this score of 3.0, is sufficient and reveals that students did, in fact, have some opportunities to engage with locals and stakeholders. Regarding the workload of the programme, students agreed that it was fair and it scored between 3.0-3.2. In the 2016 IP, the most successful activities according to the students were; meetings with local experts; the final presentation; chairs/transforming; supervisions; and SWOT analysis. In the constructive and sufficient support from
their supervisors (score of 3.8) and found the supervisors to be competent with regards to their role. In 2017 they ranked that the organisers provided ample background materials and maps and had provided an appropriate working place with a score of 3.83. The IP in 2017 also ranked very high, a score of 3.83, for students with regards to receiving sufficient and useful information from local experts.
Time allotment and the possibility to engage with local stakeholders ranked at 3.0. This may be due to the fact that the Intensive Programme has a very
Pre-survey Online Seminar LED, 2016 Post-survey Online Seminar LED, 2016 Pre-survey LED Intensive Programme Zingonia, 2016
Post-survey LED Intensive Programme Zingonia, 2016
Pre-survey Online Seminar LED, 2017 Post-survey Online Seminar LED, 2017
Pre-survey LED Intensive Programme Kassel, 2017 Post-survey LED Intensive Programme Kassel, 2017 Pre-survey Online Seminar LED, 2018
Post-survey Online Seminar LED, 2018 Pre-survey LED Intensive Programme Budapest, 2018
Post-survey LED Intensive Programme Budapest, 2018
Bibliography
2017 IP, it was the interviews with local actors; photovoice; go-along walks; art intervention and supervision; and field work, mapping and visioning chairs.. The recommendations they made related to the programme were mostly in connection with organisational issues. Students were asked if the door for landscape democracy is open for them. The question was asked both years, before and after the Intensive Programme (Fig. 14).
The most significant finding in 2017 was that after the Intensive Programme the sentence “For me the door to landscape democracy is (...)” was finished with “open” (it differs from half open to wide open). None of the students stated in the post-survey that this door was only slightly open (in contrast with the pre-survey). In 2016, two students in the post-survey responded that their door was “only” slightly open.
For a final conclusion of the project it is worth examining the chart that compares the improvement of the participants with respect to their democratic attitude. The chart compares the different years by online seminars and intensive programmes.
Agreeing with the democratic landscape planning aims, it is urgent that we fill the gap in our educational systems in order to promote equal opportunities for everyone to participate in public space design processes. Designers and planners ought to embrace this method and support participation activities for non-professional persons. The survey data reveals that as planners and educators, we need to give voice to those who are at the margins of the society (Fig. 15). The participants of the LED project were influenced during the online seminars and the intensive programme. They received the necessary training, skills and practical experience to represent the LED values in democratic design processes. The method of the participatory design seems easier to understand during the
intensive programme than the online seminar, however theoretical knowledge proved to be important to participate in the intensive programmes.
The participants feedback through the three years, outline the high quality of the educational standards maintained throughout the years of the LED programme The structure of the intensive programme offers flexible working methods that matches to the diverse knowledge and background of the participants.