O R I G I N A L A R T I C L E
I
n trauma patients continuous cardiac output (CO) monitoring is crucial to detect abrupt hemodynamic changes and to avoid low out-put syndrome and tissue hypoperfusion.1Ther-modiluition (ThD) by means of a pulmonary artery catheter (PAC) is considered the gold standard method for the measurement of CO in clinical practice.2 However, the lack of
beat-to-beat analysis does not allow to measure any sudden hemodynamic changes with this tech-nique.3 Furthermore, the use of PAC has been
questioned, due to possible complications asso-ciated with right heart catheterization.4
Consid-ering these two major concerns, thermodilution CO monitoring has been restricted in trauma patients only to selected conditions.4
Echocardiography is a validated and non-invasive technique, which has lately emerged as a first-line CO diagnostic device in trauma patients.1, 5 However, it is operator-dependent
and does not provide a continuous bedside CO monitoring.6 Thus, different systems have
been developed to allow beat-to-beat calcula-tion of CO.3 In particular, pulse contour
meth-ods (PCMs) have gained popularity as they are easy to use, less operator dependent and can
Echocardiography and pulse contour analysis
to assess cardiac output in trauma patients
F. FRANCHI 1, E. FALCIANI 1, K. DONADELLO 2,V. ZACÀ 3, R. SILVESTRI 1
F. S. TACCONE 2, L. CUBATTOLI 1, P. MONGELLI 1, P. GIOMARELLI 1, S. SCOLLETTA 1 1Department of Anesthesia and Intensive Care, University of Siena, Siena, Italy; 2Department of Intensive Care,
Erasme University Hospital; Université Libre de Bruxelles, Bruxelles, Belgium; 3Department of Cardiovascular Disease,
University of Siena, Siena, Italy
A B S T R A C T
Background. Echocardiography is a valuable technique to assess cardiac output (CO) in trauma patients, but it does not allow a continuous bedside monitoring. Beat-to-beat CO assessment can be obtained by other techniques, including the pulse contour method MostCare. The aim of our study was to compare CO obtained with MostCare (MC-CO) with CO estimated by transthoracic echocardiography (TTE-CO) in trauma patients.
Methods. Forty-nine patients with blunt trauma admitted to an intensive care unit and requiring hemodynamic optimization within 24 hours from admission were studied. TTE-CO and MC-CO were estimated simultaneously at baseline, after a fluid challenge and after the start of vasoactive drug therapy.
Results. One hundred sixteen paired CO values were obtained. TTE-CO values ranged from 2.9 to 7.6 L·min-1,
and MC-CO ranged from 2.8 to 8.2 L·min-1. The correlation between the two methods was 0.94 (95% confidence
interval [CI]=0.89 to 0.97; P<0.001). The mean bias was -0.06 L·min-1 with limits of agreements (LoA) of -0.94 to
0.82 L·min-1 (lower 95% CI, -1.16 to -0.72; upper 95% CI, 0.60 to 1.04) and a percentage error of 18%. Changes
in CO showed a correlation of 0.91 (95% CI=0.87 to 0.95; P<0.001), a mean bias of -0.01 L·min-1 with LoA of
-0.67 to 0.65 L·min-1 (lower 95% CI, -0.83 to -0.51; upper 95% CI, 0.48 to 0.81).
Conclusion. CO measured by MostCare showed good agreement with CO obtained by transthoracic echocardiog-raphy. Pulse contour analysis can complement echocardiography in evaluating hemodynamics in trauma patients.
(Minerva Anestesiol 2013;79:137-46)
Keywords: Cardiac output - Hemodynamics - Pulse wave analysis.
COPYRIGHT© 2013 EDIZIONI MINERVA MEDICA
y inter national cop yr ight la ws .
No additional reproduction is author
iz ed. It is per mitted f or persona l use to do wnload and sa v
e only one file and pr
int only one cop
y of this Ar ticle . It is not per mitted to mak e additional copies adically or systematically , either pr
inted or electronic) of the Ar
ticle f or an y pur pose . It is not per mitted to dis tr ib
ute the electronic cop
y of the ar
ticle through online inter
net and/or intr
anet file shar
ing systems , electronic mailing or an y other y allo w access to the Ar ticle .
The use of all or an
y par
t of the Ar
ticle f
or an
y Commercial Use is not per
mitted.
The creation of der
iv
ativ
e w
or
ks from the Ar
ticle is not per
mitted.
The production of repr
ints f
or personal or commercial use is
It is not per mitted to remo v e , co v er , o v er la y, obscure , b loc k, or change an y cop yr
ight notices or ter
ms of use wh
ich the Pub
lisher ma y post on the Ar ticle . It is not per mitted to fr ame or use fr
aming techniques to enclose an
y tr ademar k, logo , ietar y inf or
mation of the Pub
lisher
provide CO monitoring on a beat-to-beat ba-sis.3 MostCare (Vygon, Padua, Italy) is a PCM
that does not need any type of calibration and that can compute CO from the analysis of the arterial pressure wave acquired at radial or femo-ral sites.7, 8 This technology has been studied in
several clinical and experimental settings,8-11 but
its value has never been investigated in trauma patients.
The aim of our study was to compare CO assessed with the MostCare system (MC-CO) with CO estimated by transthoracic echocar-diography (TTE-CO) in trauma patients after Intensive Care Unit (ICU) admission and hemo-dynamic stabilization.
Materials and methods
Forty-nine trauma patients admitted to a 7-bed university hospital mixed ICU were pro-spectively enrolled. Approval from the Institu-tional Review Board was obtained, along with written informed consent from patients or their legal representative.
Inclusion criteria were: 1) trauma within 24 hours from ICU admission; 2) need for hemo-dynamic optimization with volume loading and/or with vasoactive drugs, according to the attending physician’s decision. Exclusion criteria were: less than 18 years of age, presence of car-diac arrhythmias, aortic regurgitation or stenosis and ascending aortic diseases documented by echocardiography (these factors affecting the re-liability of the PCM) and poor quality of echoca-diographic images. All patients were monitored with a radial artery catheter and a central venous catheter, as a standard procedure.9
After ICU admission, therapeutic decisions were taken by the physician in charge, according to local guidelines for the hemodynamic treat-ment of trauma patients.12 Briefly, the choice
of administrating fluids and/or vasoactive drugs was established on: 1) the evidence of signs of inadequate tissue perfusion; 2) an integrated monitoring based on low mean arterial pressure (MAP), low central venous oxygen saturation, low central venuous pressure (CVP), and high pulse pressure variation; and 3) the evaluation of poor left ventricular function (i.e., left
ven-tricular ejection fraction <40%) by means of TTE (deta (Figure 1). Patients were all sedat-ed, intubated and mechanically ventilated; the indications for endotracheal intubation were: head injury with Glasgow Coma Score (GCS) less than 9; respiratory insufficiency and severe psychomotor agitation in the unstable patient. Heart rate (HR), MAP, CVP, temperature, diu-resis and peripheral arterial oxygen saturation (SaO2) were hourly recorded. Intracranial pres-sure (ICP) was monitored by external ventricu-lar drainage in case of traumatic brain injury (TBI) and GCS <9.
Echocardiography measurements
Echocardiographies were performed using a standard transthoracic probe (Phased Array Probe, PA 240, Esaote, Italy) and a dedicated unit (MyLab™ 70 Xvision, Esaote, Italy). All echocardiographies were performed by the same trained operator (V.Z.). Stroke volume was es-timated using standard views and formula (i.e., the product of the aortic valve area by the veloc-ity time integral of aortic blood flow).13
After-wards, TTE-CO was calculated as the product of HR and stroke volume averaged over five con-secutive stroke volume values. Cardiac output calculation was performed off-line and blindly to the MostCare results.
MostCare measurements
The MostCare system was connected via a simple cable to the patient’s monitoring system for the continuous recording of the radial arte-rial pressure waveform and the computation of CO. MostCare analyses the arterial signal using a sampling frequency of 1,000 Hz. The high-frequency sampling is of primary importance for the calculation of the arterial impedance and the correct measurement of pressures. After zeroing the arterial pressure-transducer system and before each CO measurement, the arterial waveform signal fidelity was checked using a fast flush test to assess the adequacy of the damping of the arterial shape.14 In case of resonance effect
of the catheter-transducer system, we adapted the MostCare’s setting to maximise the
signal-y inter national cop yr ight la ws .
No additional reproduction is author
iz ed. It is per mitted f or persona l use to do wnload and sa v
e only one file and pr
int only one cop
y of this Ar ticle . It is not per mitted to mak e additional copies adically or systematically , either pr
inted or electronic) of the Ar
ticle f or an y pur pose . It is not per mitted to dis tr ib
ute the electronic cop
y of the ar
ticle through online inter
net and/or intr
anet file shar
ing systems , electronic mailing or an y allo w access to the Ar ticle .
The use of all or an
y par
t of the Ar
ticle f
or an
y Commercial Use is not per
mitted.
The creation of der
iv
ativ
e w
or
ks from the Ar
ticle is not per
mitted.
The production of repr
ints f
or personal or commercial use is
It is not per mitted to remo v e , co v er , o v er la y, obscure , b loc k, or change an y cop yr
ight notices or ter
ms of use wh
ich the Pub
lisher ma y post on the Ar ticle . It is not per mitted to fr ame or use fr
aming techniques to enclose an
y tr
ietar
y inf
or
mation of the Pub
lisher
Statistical analysis
Statistical analysis was performed using Stats-Direct version 2.5.8 (Cheshire, UK), SigmaPlot for Windows version 11.0 (Systat Software, Inc., San Jose, CA) and R version 2.11.1 (2010-05-31 R Foundation for Statistical Computing, Vien-na, Austria).16 We calculated that at least 44
pa-tients would be required assuming to allow dif-ferences in the average between the two methods of 0.5 L/min and to have a standard deviation of 1 L/min; we considered a statistical significance level of 95% (α=0.05) and a minimum power of 90% (β=0.1). The agreement between TTE-CO and MC-TTE-CO was assessed using the Bland-Altman method.17 The correlation coefficient,
bias and their 95% CI (mean difference between measurements) were calculated. Limits of agree-ment (LoA) (as 2.2 times SD of the bias) were computed as proposed by Ludbrook for small to-noise ratio.9 No therapeutic intervention was
based on the CO values provided by MostCare.
Study intervals and experimental procedure
After ICU admission and stabilization, TTE-CO and MC-TTE-CO were recorded simultaneously before the physician decided to perform one of the therapeutic interventions aimed at hemody-namic optimization. Thereafter measurements were made at the end of the fluid challenge or 30 minutes after vasopressors initation, in the presence of stable MAP (less than 10% varia-tion over 15 minutes). For each measurement of TTE-CO, a corresponding value from the Most-Care monitor was obtained by averaging the in-dividual stroke volumes over the time needed for each TTE-CO measurement. These values were automatically downloaded and recorded in a computer database for off-line analysis.
Figure 1.—Local guidelines for haemodynamic management of critically ill patients.
Hb: hemoglobin; SaO2: arterial oxygen saturation; MAP: mean arterial pressure; ScvO2: central venous oxygen saturation; CVP: central venous pressure; PPV: pulse pressure variation; TTE: transthoracic echocardiography; LVEF: left ventricular ejection frac-tion; Hes: hydroxyethilstarch.
*One of the following: systolic blood pressure, SBP<90 mmHg; heart rate, HR>100 bpm; hourly diuresis, HD<0.5 mL/kg/h for >2 h; lactate, Lac >2 mmol/L; cerebral perfusion pressure CPP<70 mmHg (if intracranial pressure monitoring).
(7 mL•kg-1) y inter national cop yr ight la ws .
No additional reproduction is author
iz ed. It is per mitted f or persona l use to do wnload and sa v
e only one file and pr
int only one cop
y of this Ar ticle . It is not per mitted to mak e additional copies adically or systematically , either pr
inted or electronic) of the Ar
ticle f or an y pur pose . It is not per mitted to dis tr ib
ute the electronic cop
y of the ar
ticle through online inter
net and/or intr
anet file shar
ing systems , electronic mailing or an y allo w access to the Ar ticle .
The use of all or an
y par
t of the Ar
ticle f
or an
y Commercial Use is not per
mitted.
The creation of der
iv
ativ
e w
or
ks from the Ar
ticle is not per
mitted.
The production of repr
ints f
or personal or commercial use is
It is not per mitted to remo v e , co v er , o v er la y, obscure , b loc k, or change an y cop yr
ight notices or ter
ms of use wh
ich the Pub
lisher ma y post on the Ar ticle . It is not per mitted to fr ame or use fr
aming techniques to enclose an
ietar
y inf
or
mation of the Pub
lisher
infusion was started thereafter. Eight patients with severe traumatic brain injury (Group C) were treated with norepinephrine infusion only, to maintain adequate cerebral perfusion pres-sure. No patient received inotropes. Among the various hemodynamic variables, CO and MAP showed a significant change after fluid challenge or norepinephrine infusion (P<0.05) (Table II).
In the group A, we found a good correlation between TTE-CO and MostCare-CO (r=0.94, 95% CI=0.92 to 0.97, P<0.001) at baseline. Mean bias was -0.06 L·min-1 with LoA of -0.74
to 0.62 L·min-1 (lower 95% CI, -0.93 to -0.56;
upper 95% CI, 0.44 to 0.81) and a relative per-centage error (PE) of 14.1% (Table III). For those patients in which norepinephrine infusion was subsequently initiated (group B), similar val-ues of r, mean bias, and PE were observed (Table III). In the group C, the correlation at baseline was 0.94 (95% CI=0.72 to 0.99, P<0.001), the mean bias was -0.06 L·min-1 with LoA of -0.79
to 0.67 L·min-1 (lower 95% CI, -1.23 to -0.34;
upper 95% CI, 0.22 to 1.11) and a PE of 18.2% (Table III). After the start of norepinephrine infusion, the correlation was comparable to the baseline results (Table III).
The mean bias for all 116 CO measure-ments corrected for repeated measures was -0.06 L·min-1 with LoA of -0.94 to 0.82 L·min-1
(low-er 95% CI, -1.16 to -0.72; upp(low-er 95% CI, 0.60 to 1.04) and a PE of 17.7% (Figure 2A). The correlation was statistically significant (r=0.94, samples.18 The 95% CI of the upper LoA and
that of the lower LoA were also calculated. The percentage of error was calculated as the limits of agreement (2.2 times the SD of the bias) di-vided by the mean CO from the two methods, as proposed by Critchley: 100×(2.2×SD of Bias)/ [(mean TTE-CO + mean MC CO)/2].19
Changes (Δ) in CO were calculated for the group of patients with two CO determinations (baseline and after fluid challenge) and three CO determinations (baseline, T1; after fluid challenge, T2; after the start of norepinephrine infusion, T3) by subtracting the first from the second measurement (T2-T1) and the second from the third (T3-T2) when present. We used the method suggested by Myles and Cui to ad-just for the effects of repeated measurements in the Bland-Altman analysis.20 For this purpose,
and also to test changes of TTE-CO and MC-CO at the different phases, we used the method that was applied in previous studies.21-23
The ability of the MostCare to reliably fol-low changes or trends in CO was assessed using a concordance analysis.24 After excluding all the
pairs of ΔCO where at least one value was zero, the direction of change between TTE-CO and MC-CO was analyzed to assess the percentage of concordance between the results, including and excluding ΔTTE-CO <0.5 L·min-1.25 The serial
pairs of CO readings from the echocardiograph-ic method (X-axis) and the MostCare system (Y-axis) were converted to polar coordinates and the resulting polar plots were used to show trending ability.26, 27 This was based on the percentage of
data points lying within 30-degrees of the polar axis.27 For all statistical tests, a P<0.05 was taken
to indicate significance. Results
Patients’ characteristics are described in Table I. All patients had blunt trauma and no patient had diagnosis of intra-abdominal hypertension or ab-dominal compartment syndrome. One hundred sixteen paired CO values were obtained. TTE-CO values ranged from 2.9 to 7.6 L·min-1, and
MC-CO ranged from 2.8 to 8.2 L·min-1.
For-ty-one patients (group A) received a fluid chal-lenge; in 18 of them (Group B), norepinephrine
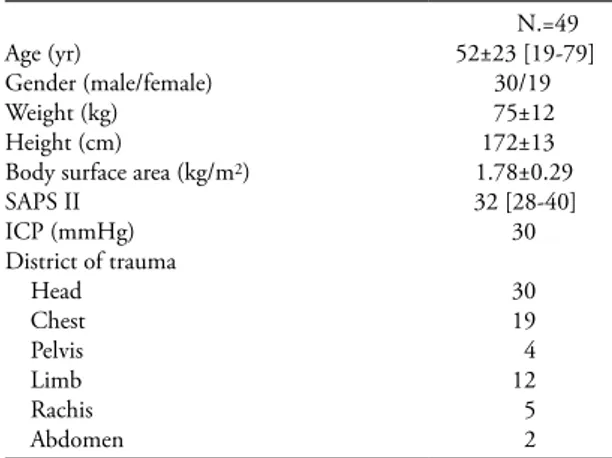
Table I.—Patients’ characteristics. Data are expressed as
mean ± standard deviation [range]. SAPS II, Simplified Acute Physiological Score II; ICP, intracranial pressure.
N.=49
Age (yr) 52±23 [19-79]
Gender (male/female) 30/19
Weight (kg) 75±12
Height (cm) 172±13
Body surface area (kg/m2) 1.78±0.29
SAPS II 32 [28-40] ICP (mmHg) 30 District of trauma Head 30 Chest 19 Pelvis 4 Limb 12 Rachis 5 Abdomen 2 y inter national cop yr ight la ws .
No additional reproduction is author
iz ed. It is per mitted f or persona l use to do wnload and sa v
e only one file and pr
int only one cop
y of this Ar ticle . It is not per mitted to mak e additional copies adically or systematically , either pr
inted or electronic) of the Ar
ticle f or an y pur pose . It is not per mitted to dis tr ib
ute the electronic cop
y of the ar
ticle through online inter
net and/or intr
anet file shar
ing systems , electronic mailing or an y allo w access to the Ar ticle .
The use of all or an
y par
t of the Ar
ticle f
or an
y Commercial Use is not per
mitted.
The creation of der
iv
ativ
e w
or
ks from the Ar
ticle is not per
mitted.
The production of repr
ints f
or personal or commercial use is
It is not per mitted to remo v e , co v er , o v er la y, obscure , b loc k, or change an y cop yr
ight notices or ter
ms of use wh
ich the Pub
lisher ma y post on the Ar ticle . It is not per mitted to fr ame or use fr
aming techniques to enclose an
y tr
ietar
y inf
or
mation of the Pub
lisher
only ΔTTE-CO >0.5 L·min-1 were considered,
the concordance improved to 97% (36/37). A polar plot was used to show the direction of CO changes (i.e., trending ability) (Figure 3A). The polar plot analysis confirmed good agreement and good concordance for ΔCO estimated by the two devices. Indeed, 100% of data points lied within 30-degrees of the polar axis. The mean polar angle was 0.3-degrees, with the radi-al limits of agreement of 348 to 12 (Figure 3B).
Discussion
In the present study, for the first time the MostCare system was compared to TTE during 95% CI=0.89 to 0.97; P<0.001). The mean
dif-ferences between TTE-CO and MostCare-CO together with 95% limits of agreement and their corresponding 95% CI, and the mean percent-age error are shown in Table III.
ΔCO was calculated separately for the two methods. Data comparison showed a correlation of 0.91 (95% CI=0.87 to 0.95; P<0.001) (Fig-ure 2B) and a bias of -0.01 L·min-1 with LoA of
-0.67 to 0.65 L·min-1 (lower 95% CI, -0.83 to
-0.51; upper 95% CI, 0.48 to 0.81).
Five ΔCO pairs were excluded from the anal-ysis of the direction of changes, as ΔCO value was zero. The concordance of ΔCO observed was 90% (56 of 62 pairs of ΔCO agreed); when
Table II.—Hemodynamic data recorded at each time-point of the study. Group A: patients who received fluid challenge only.
Group B: patients who received norepinephrine after a fluid challenge. Group C: patients treated with norepinephrine only. Data are expressed as mean (standard deviation, SD). HR: heart rate; MAP: mean arterial pressure; CVP: central venous pressure; MC-CO: continuous cardiac output obtained by MostCare; TTE-CO: cardiac output obtained by Transthoracic Echocardiography technique.
Variable
Group A (N.=41) Group B (N.=18) Group C (N.=8)
Baseline challengeFluid P value Baseline 2* nephrineNorepi- P value Baseline nephrineNorepi- P value
HR (min-1) 83±17 81±17 0.001 86±14 88±21 0.50 81±12 78±11 0.056 MAP (mmHg) 86.3±12 89.5±12 0.001 83.0±14 88.0±8 0.27 70.6±7 85.4±6 0.01 CVP (mmHg) 7.7±3 9.5±2 0.001 8.0±2.2 9.8±3 0.09 10.6±3 11.4±2 0.06 Volume Load (mL) — 490±50 — — — — — — — Norepinephrine (mcg·kg -1·min-1) — — — — 0.19±0.12 — — 0.27±0.08 — MC-CO (L·min-1) 4.88±1.02 5.34±1.03 0.001 5.38±0.68 5.22±0.82 0.27 4.02±0.73 4.32±0.75 0.10 TTE-CO (L·min-1) 4.81±0.95 5.33±0.98 0.001 5.40±0.81 5.09±0.86 0.43 3.96±0.91 4.26±0.78 0.09
*After fluid challenge, before receiving norepinephrine.
Table III.—Mean differences between TTE-CO and MC-CO (bias and 95% confidence interval, CI). Limits of agreement
(LoA) were computed as proposed by Ludbrook for small samples (i.e., 2.2 times standard deviations of the bias). Percentage er-ror (PE) and coefficient of correlation (r) are calculated for cardiac output measurements at different times. Data are expressed as count, percentage, and mean ± standard deviation (SD). Group A: patients who received fluid challenge. Group B: patients who received fluid challenge plus norepinephrine. Group C: patients treated with only norepinephrine.
Group time Bias (95% CI) (L·min-1) LoA 95% CI of lower LoA 95% CI of upper LoA PE
(%) r A plus B Baseline (N.=41) -0.06 (-0.17 to-0.05) -0.74 to 0.62 -0.93 to -0.56 0.44 to 0.81 14.1 0.94 Fluid challenge (N.=41) -0.01 (-0.12 to 0.10) -0.71 to 0.69 -0.90 to -052 0.50 to 0.88 13.2 0.87 Norepinephrine (N.=18) -0.14 (-0.36 to 0.08) -1.09 to 0.81 -1.47 to -0.70 0.42 to 1.19 18.4 0.86 C Baseline (N.=8) -0.06 (-0.32 to 0.20) -0.79 to 0.67 -1.23 to -0.34 0.22 to 1.11 18.2 0.94 Norepinephrine (N.=8) -0.06 (-0.29 to 0.17) -0.72 to 0.60 -1.12 to -0.32 0.20 to 1.00 15.4 0.91 All data -0.06 (-0.19 to 0.07) -0.94 to 0.82 -1.16 to -0.72 0.60 to 1.04 17.7 0.94 y inter national cop yr ight la ws .
No additional reproduction is author
iz ed. It is per mitted f or persona l use to do wnload and sa v
e only one file and pr
int only one cop
y of this Ar ticle . It is not per mitted to mak e additional copies adically or systematically , either pr
inted or electronic) of the Ar
ticle f or an y pur pose . It is not per mitted to dis tr ib
ute the electronic cop
y of the ar
ticle through online inter
net and/or intr
anet file shar
ing systems , electronic mailing or an y allo w access to the Ar ticle .
The use of all or an
y par
t of the Ar
ticle f
or an
y Commercial Use is not per
mitted.
The creation of der
iv
ativ
e w
or
ks from the Ar
ticle is not per
mitted.
The production of repr
ints f
or personal or commercial use is
It is not per mitted to remo v e , co v er , o v er la y, obscure , b loc k, or change an y cop yr
ight notices or ter
ms of use wh
ich the Pub
lisher ma y post on the Ar ticle . It is not per mitted to fr ame or use fr
aming techniques to enclose an
ietar
y inf
or
mation of the Pub
lisher
were the only statistical methods available to as-sess the ability of a device to detect the changes in CO after therapeutical interventions. In this setting, polar plots analysis is a new statistical ap-proach to detect CO changes over time between two monitoring techniques. The polar plot anal-ysis quantifies CO changes (the so-called “trend-ing ability”) by convert“trend-ing the serial pairs of CO readings from the reference method (in this case, TTE, on X-axis) and the other method (here, MostCare system, Y-axis) to polar coordinates. The mean change in cardiac output (ΔCO) is shown by the distance from the center of the plot and the agreement is indicated by the angle with the horizontal axis. Thus, the better the agree-ment between CO measureagree-ments, the closer the data pairs will be to the horizontal axis. The dot-ted lines represent the limits of good agreement (±0.5 L/min); in this plot, no data-points lie outside these limits, showing the good trending ability of the MostCare system (Figure 3).
Due to its invasiveness and potential compli-cations, the use of PAC is actually not recom-mended in all trauma patients, but it is limited to selected patient populations.4
Echocardiogra-phy can overcome the limitations of PAC and represents a useful diagnostic device for early hemodynamic assessment in trauma patients. On the other hand, it cannot eliminate the need for continuous monitoring and for the early rec-ognition of abrupt hemodynamic alterations.1, 5, 6 PCMs may obviate the limitations of PAC
and may complement echocardiography in the hemodynamic evaluation and management of critically ill patients.28 Among all PCMs, the
MostCare system is a device that allows beat-to-beat CO measurement.7, 8 A number of
pa-pers confirm the reliability of MostCare during various hemodynamic scenarios and in different patient populations.8-11, 23, 29 Our results showed
similar agreement of MC-CO with CO meas-ured with standard techniques, such as TTE and PAC, in previous studies and suggested that this uncalibrated PCM may be a reliable tool to as-sess CO also in hemodynamically stable trauma patients.
Previous studies have already compared Most-Care with echocardiography. Romagnoli et al.9
showed good agreement between CO measured interventions aimed at optimizing
hemodynam-ics in trauma patients. MostCare provided good agreement with echocardiography, showing a percentage of error lower than 30%, which is considered as the limit for clinical acceptance for a new method.19 Furthermore, good
agree-ment in detecting changes in CO (ΔCO) was found either after fluid challenge or vasopressor therapy.
Our analytical approach included both Bland-Altman and polar plot analyses. Bland-Bland-Altman analysis has been widely used to evaluate the ac-curacy of CO-monitoring devices; also, the di-rection of changes and the correlation analysis Figure 2.—A) Bland-Altman plots of cardiac output (CO) es-timated by transthoracic echocardiography (TTE-CO) and by MostCare (MC-CO) for all 116 paired data. The mean bias was -0.06 with limits of agreement of -0.94 to 0.82 L·min-1. Solid line, mean difference (bias); dashed black lines, limits of agreement (bias ±2.2 SD). Dashed gray lines, 95% confidence interval of limits of agreement. B) Four-quadrant trend plot showing the relationship between changes (Δ) in cardiac out-put (CO) estimated by transthoracic echocardiography (TTE-CO) and by MostCare (MC-(TTE-CO). Δ in CO were calculated by subtracting the first from the second measurement (T2-T1), and the second from the third (T3-T2) when it was required. Correlation coefficient (r) was equal to 0.91 (95% confidence interval [CI]=0.89 to 0.97; P<0.001). A B y inter national cop yr ight la ws .
No additional reproduction is author
iz ed. It is per mitted f or persona l use to do wnload and sa v
e only one file and pr
int only one cop
y of this Ar ticle . It is not per mitted to mak e additional copies adically or systematically , either pr
inted or electronic) of the Ar
ticle f or an y pur pose . It is not per mitted to dis tr ib
ute the electronic cop
y of the ar
ticle through online inter
net and/or intr
anet file shar
ing systems , electronic mailing or an y allo w access to the Ar ticle .
The use of all or an
y par
t of the Ar
ticle f
or an
y Commercial Use is not per
mitted.
The creation of der
iv
ativ
e w
or
ks from the Ar
ticle is not per
mitted.
The production of repr
ints f
or personal or commercial use is
It is not per mitted to remo v e , co v er , o v er la y, obscure , b loc k, or change an y cop yr
ight notices or ter
ms of use wh
ich the Pub
lisher ma y post on the Ar ticle . It is not per mitted to fr ame or use fr
aming techniques to enclose an
y tr
ietar
y inf
or
mation of the Pub
lisher
rolled a large cohort of patients, no therapeutic interventions was used to change CO and only stable hemodynamic conditions were analyzed.
Other PCMs devices were compared with echocardiography in critically ill patients.13, 30-32 The Pulse Contour Cardiac Output (PCCO)
system (Medical Systems AG, Munich, Ger-many) was compared with echocardiography for the evaluation of left ventricle systolic func-tion31 and dynamic index of preload.32 The
PCCO device works differently than MostCare because it needs a dedicated arterial catheter with a thermistore in its tip and a calibration with thermodilution. Several studies showed the reliability of the PCCO system in various clini-cal settings,33, 34 including cardiac surgery and
sepsis, however none of them was conducted in trauma patients.
The Vigileo monitor (Edwards Lifesciences, Irvine, CA, USA) is another widely used PCM device that proved to be reliable in a number by MostCare and by transesophageal
echocar-diography in pigs during several hemodynamic scenarios, including dobutamine infusion, vaso-pressor therapy and fluid loading. Nevertheless, a percentage of error greater than 30%, suggest-ing poor agreement, was observed dursuggest-ing severe haemorrhage, defined by a reduction of blood volume ≥35%. This limitation of MostCare should be taken into account whenever such de-vice is used to monitor CO in trauma patients with severe bleeding. However, as no human studies have been performed using MostCare under these circumstances, further investigations are needed to define the accuracy of this PCM to measure CO in critically ill patients with con-comitant severe blood loss.
Calamandrei et al.11 studied the MostCare
system in a pediatric population (aged between 1 month and 18 years old). They found that Most-Care provided reliable estimation of CO when compared with TTE. Although the authors
en-Figure 3.—A) Polar plot shows the direction of CO changes (trending ability). This was obtained by converting the serial pair of CO readings from TTE method (X-axis) and MostCare system (Y-axis) to polar coordinates.26 The dotted lines represent the limits of good agreement (±0.5 L·min-1) and the distance from the center of the plot represents the mean change in cardiac output (ΔCO). The better the agreement between CO measurements, the closer data pairs will lie along the horizontal axis. In this plot, no data points lie outside these limits, showing the good trending ability of the MostCare system. B) Polar plot designed to include the analysis of the mean polar angle and the radial limits of agreement. In this new polar plot, proposed by Critchley et al,27 the radial limits of agreement are based on the 95% confidence limits of the polar angle. The mean polar angle gives insight into how well the calibration of the two devices being compared, test and reference methods, agree. Dashed lines show polar axis (e.g. horizontal axis: 0-degree) and ±30-degree axes. The later coincide with the benchmark 30-degree limits for acceptable trending ability. Dotted lines show mean and 95% confidence intervals for the data or polar angles. In this plot, acceptable trending ability is present as 100% of data points lies within 30-degrees of the polar axis.
A B y inter national cop yr ight la ws .
No additional reproduction is author
iz ed. It is per mitted f or persona l use to do wnload and sa v
e only one file and pr
int only one cop
y of this Ar ticle . It is not per mitted to mak e additional copies adically or systematically , either pr
inted or electronic) of the Ar
ticle f or an y pur pose . It is not per mitted to dis tr ib
ute the electronic cop
y of the ar
ticle through online inter
net and/or intr
anet file shar
ing systems , electronic mailing or an y allo w access to the Ar ticle .
The use of all or an
y par
t of the Ar
ticle f
or an
y Commercial Use is not per
mitted.
The creation of der
iv
ativ
e w
or
ks from the Ar
ticle is not per
mitted.
The production of repr
ints f
or personal or commercial use is
It is not per mitted to remo v e , co v er , o v er la y, obscure , b loc k, or change an y cop yr
ight notices or ter
ms of use wh
ich the Pub
lisher ma y post on the Ar ticle . It is not per mitted to fr ame or use fr
aming techniques to enclose an
ietar
y inf
or
mation of the Pub
lisher
counted for the good agreement that we found between the two techniques.
Some limitations of the present study have to be addressed. First, we did not compare Most-Care with bolus thermodilution (ThD), which is considered the gold standard method to estimate CO in clinical practice. Actually, MostCare has already been shown good agreement in estimat-ing CO when compared to ThD under different clinical conditions, including cardiac surgery, use of intra-aortic balloon pump conterpulsation and other mechanical assist devices, and sepsis.8, 23, 29, 40 Also, since echocardiography is widely
used in critically ill patients as a valued alternative to ThD to estimate CO, it could be reasonable to consider such a technique as a valid reference tool for CO comparison in this setting. Second, MostCare is one of the last devices proposed for minimal invasive hemodynamic monitoring. It has been developed in Italy a few years ago and its clinical validation, even if quite convincing, suffers the paucity of specific studies performed outside Italian centers. Indeed, two recent ar-ticles from other groups have raised some con-cerns on the feasibility of this device.39, 41 An
ongoing multicenter study, involving several Eu-ropean centers, will hopefully provide more in-formation on the value of MostCare in critically ill patients. Third, we did not analyse other pos-sible hemodynamic changes in addition to fluid challenge and norepinephrine infusion (e.g., se-vere haemorrhage, inotrope administration or blood transfusions). Moreover, measurements were performed only after initial resuscitation and during stable hemodynamic conditions. Hence, further larger studies are needed to con-firm these data in other phases of trauma man-agement. Finally, the decisional algorithm used in this study to treat trauma patients with fluids and/or vasopressors could be largely criticized. In trauma with haemorrhagic shock, the aim of restoring normal blood pressure during the active bleeding phase, as well as fluid manage-ment based on PPV, have been questionned and there is not much agreement on hemodynamic goals for pre-definitive care, which may vary in relation to the injured organ. Thus, the protocol followed in the present study may not be appli-cable to all trauma subsets. Nevertheless, the aim of scenarios.13, 30 Vigileo and echocardiography
were compared by Concha and colleagues,30
who didn’t find any good agreement between the two techniques in a population of low risk patients undergoing laparoscopic colon surgery. The authors supposed that the variations of pa-tient’s position (i.e., supine lithotomy position, Trendelenburg, reverse Trendelenburg, and steep Trendelenburg position), as well as the induced pneumoperitoneum related to the laparoscopic procedure, may have determined major changes in vascular compliance and impedance which may have contributed to the descrepancy be-tween ecchocardiography and Vigileo.30
MostCare is powered by PRAM (Pressure Recording Analytical Method) that has been validated in different clinical scenarios.7-11, 23, 29
With PRAM the systemic impedance is deter-mined by the physical characteristics of the cir-culatory system of the subject under study.7, 8
Thus, changes in vascular tone should influence to a lesser extent the reliability of MostCare in measuring CO. This statement was recently confirmed in a small group of septic patients in which changes in vascular tone were induced by norepinephrine infusion.29
Several limitations of the MostCare system remain to be addressed. Either over- or under-damped arterial pressure waveforms may affect the precision of the pressure wave analysis.35, 36
Also, the adequate analysis of the blood pressure wave at 1000 Hz is dependent from the opera-tor, who needs to maximize the quality of the arterial signal to obtain a reliable pressure wave morphology.7, 9, 37
Moreover, the characteristics of the arterial tree (such as stenosis, aortic valve and ascending aorta pathologies, etc.) could influence the accu-racy of CO measurements based on the analysis of the arterial waveform.28, 36 Also, cardiac
dys-rhythmias, especially atrial fibrillation, can affect the reliability of MostCare whenever comparing it to PAC-derived CO or other hemodynamic monitoring techniques.38 The presence of some
of these factors may explain why some authors found a weak correlation between MostCare and the thermodilution method.39 Notably, all
the aforementioned conditions were considered as exclusion criteria in the present study and
ac-y inter national cop yr ight la ws .
No additional reproduction is author
iz ed. It is per mitted f or persona l use to do wnload and sa v
e only one file and pr
int only one cop
y of this Ar ticle . It is not per mitted to mak e additional copies adically or systematically , either pr
inted or electronic) of the Ar
ticle f or an y pur pose . It is not per mitted to dis tr ib
ute the electronic cop
y of the ar
ticle through online inter
net and/or intr
anet file shar
ing systems , electronic mailing or an y allo w access to the Ar ticle .
The use of all or an
y par
t of the Ar
ticle f
or an
y Commercial Use is not per
mitted.
The creation of der
iv
ativ
e w
or
ks from the Ar
ticle is not per
mitted.
The production of repr
ints f
or personal or commercial use is
It is not per mitted to remo v e , co v er , o v er la y, obscure , b loc k, or change an y cop yr
ight notices or ter
ms of use wh
ich the Pub
lisher ma y post on the Ar ticle . It is not per mitted to fr ame or use fr
aming techniques to enclose an
y tr
ietar
y inf
or
mation of the Pub
lisher
LS, Demetriades D et al. Swan-Ganz catheter use in trauma patients can be reduced without negatively affecting out-comes. World J Surg. 2011;35:1809-17.
5. Cheitlin MD, Armstrong WF, Aurigemma GP, Beller GA, Bierman FZ, Davis JL et al. ACC/AHA/ASE Guideline Up-date for the Clinical Application of Echocardiography: A Report of the American College of Cardiology/American Heart. J Am Soc Echocardiogr 2003;16:1091-110. 6. Vignon P. Hemodynamic assessment of critically ill patients
using echocardiography Doppler. Curr Opin Crit Care 2005;11:227-34.
7. Romano SM, Pistolesi M. Assessment of cardiac output from systemic arterial pressure in humans. Crit Care Med 2002;30:1834-41.
8. Giomarelli P, Biagioli B, Scolletta S. Cardiac output moni-toring by pressure recording analytical method in cardiac surgery. Eur J Cardiothorac Surg 2004:26:515-20. 9. Romagnoli S, Romano SM, Bevilacqua S, Ciappi F, Lazzeri
C, Peris A et al. Cardiac output by arterial pulse contour: reliability under hemodynamic derangements. Interact Car-diovasc Thorac Surg 2009;8:642-6.
10. Scolletta S, Romano SM, Biagioli B, Capannini G, Gi-omarelli P. Pressure recording analytical method (PRAM) for measurement of cardiac output during various hemody-namic states. Br J Anaesth 2005;95:159-65.
11. Calamandrei M, Mirabile L, Muschetta S, Gensini GF, De Simone L, Romano SM. Assessment of cardiac output in children: a comparison between the pressure recording ana-lytical method and Doppler echocardiography. Pediatr Crit Care Med 2008;9:310-2.
12. Vincent JL, Weil MH. Fluid challenge revisited. Crit Care Med 2006;34:1333-7.
13. Biais M, Vidil L, Sarrabay P, Cottenceau V, Revel P, Sztark F. Changes in stroke volume induced by passive leg raising in spontaneously breathing patients: comparison between echocardiography and Vigileo/FloTrac device. Crit Care 2009;13:R195.
14. Kleinman B, Powell S, Kumar P, Gardner RM. The fast flush test measures the dynamic response of the entire blood pressure monitoring system. Anesthesiology 1992;77:1215-20.
15. Michard F, Boussat S, Chemla D, Anguel N, Mercat A, Lecarpentier Y et al. Relation between respiratory changes in arterial pulse pressure and fluid responsiveness in sep-tic patients with acute circulatory failure. Am J Respir Crit Care Med 2000;162:134-8.
16. R Development Core Team. R: A language and environ-ment for satistical computing R Foundation for Statistical Computing, Vienna, Austria [Internet]. Available at http:// www.R-project.org [cited 2012, Dec 13].
17. Bland JM, Altman DG. Statistical methods for assessing agreement between two methods of clinical measurement. Lancet 1986;1:307-10.
18. Ludbrook J. Statistical techniques for comparing measurers and methods of measurement: a critical review. Clin Exp Pharmacol Physiol 2002;29:527-36.
19. Critchley LAH, Critchley JA. A meta-analysis of studies us-ing bias and precision statistics to compare cardiac output measurement techniques. J Clin Monitor 1999;15:85-91. 20. Myles PS, Cui J. Using the Bland-Altman method to
measure agreement with repeated measures. Br J Anaesth 2007;99:309-11.
21. Carstensen B, Simpson J, Gurrin L. Statistical models for assessing agreement in method comparison studies with replicate measurements [Internet]. Available at: http:// staff.pubhealth.ku.dk/~bxc/ MethComp/lam-bsa.pdf [cited 2008, Jun 7].
22. Carstensen B, Gurrin L. MethComp: Functions for analy-sis of method comparison studies. R package version 1.2-1 [Internet]. Available at: http://www.pubhealth.ku.dk/~bxc/ MethComp/intro MethComp.pdf [cited 2010, Jan 8]. of this study was not to propose (or to validate)
a specific management protocol to treat trauma patients but only to evaluate the MostCare ac-curacy in tracking CO changes before and after therapeutical interventions.
Conclusions
Under the studied conditions MostCare showed a good agreement with echocardiogra-phy over a wide range of CO. Echocardiograechocardiogra-phy and pulse contour methods should be consid-ered complementary in monitoring hemody-namics in critically ill patients. Indeed, echocar-diography can provide relevant “diagnostic” information, while pulse contour methods rep-resent useful beat-to-beat “monitoring” tools to assess patients’ hemodynamic variations.42 This
is particularly important in trauma subjects, for whom invasive hemodynamic monitoring tech-niques are often deemed harmful or not essential for clinical management.
Key messages
— MostCare showed good agreement with echocardiography to measure cardiac output in trauma patients, after initial he-modynamic stabilization.
— In such patients, pulse contour analy-sis by MostCare device could also accurately detect hemodynamic changes induced by fluids and/or vasopressors administration.
— Further studies are needed to evaluate the accuracy of MostCare to detect hemody-namic changes in unstable trauma patients.
References
1. Kohli-Seth R, Neuman T, Sinha R, Bassily-Marcus A. Use of echocardiography and modalities of patient monitoring of trauma patients. Curr Opin Anaesthesiol 2010;23:239-45.
2. Vincent JL, Pinsky MR, Sprung CL, Levy M, Marini JJ, Payen D et al. The pulmonary artery catheter: in medio vir-tus. Crit Care Med 2008;36:3093-6.
3. Bein B, Worthmann F, Tonner PH, Paris A, Steinfath M, Hedderich J et al. Comparison of Esophageal Doppler, Pulse Contour Analysis, and Real-Time Pulmonary Artery Thermodilution for the Continuous Measurement of Car-diac Output. J Cardiothorac Vasc Anesth 2008;18:185-9. 4. Barmparas G, Inaba K, Georgiou C, Hadjizacharia P, Chan
y inter national cop yr ight la ws .
No additional reproduction is author
iz ed. It is per mitted f or persona l use to do wnload and sa v
e only one file and pr
int only one cop
y of this Ar ticle . It is not per mitted to mak e additional copies adically or systematically , either pr
inted or electronic) of the Ar
ticle f or an y pur pose . It is not per mitted to dis tr ib
ute the electronic cop
y of the ar
ticle through online inter
net and/or intr
anet file shar
ing systems , electronic mailing or an y allo w access to the Ar ticle .
The use of all or an
y par
t of the Ar
ticle f
or an
y Commercial Use is not per
mitted.
The creation of der
iv
ativ
e w
or
ks from the Ar
ticle is not per
mitted.
The production of repr
ints f
or personal or commercial use is
It is not per mitted to remo v e , co v er , o v er la y, obscure , b loc k, or change an y cop yr
ight notices or ter
ms of use wh
ich the Pub
lisher ma y post on the Ar ticle . It is not per mitted to fr ame or use fr
aming techniques to enclose an
ietar
y inf
or
mation of the Pub
lisher
tinuous cardiac output measurement: pulse contour analy-sis vs thermodilution technique in cardiac surgical patients. Br J Anaesth 1999;82:525-30.
34. Monnet X, Anguel N, Naudin B, Jabot J, Richard C, Te-boul JL. Arterial pressure-based cardiac output in septic pa-tients: different accuracy of pulse contour and uncalibrated pressure waveform devices. Crit Care 2010;14:R109. 35. Gibbs N, Gardner RM. Dynamics of invasive pressure
monitoring systems: clinical and laboratory evaluation. Heart Lung 1988;17:43-51.
36. Camporota L, Beale R. Pitfalls in haemodynamic moni-toring based on the arterial pressure waveform. Crit Care 2010;14:124.
37. Scolletta S, Taccone FS, Romagnoli S, Landoni G, Giomar-elli P. The pressure recording analytical method (PRAM) to measuring cardiac output after cardiac surgery: some practi-cal considerations. Br J Anaesth 2011;107:814-5. 38. Maj G, Monaco F, Landoni G, Maj G, Monaco F, Landoni
G et al. Cardiac Index Assessment by the Pressure Record-ing Analytic Method in Unstable Patients With Atrial Fi-brillation. J Cardiothorac Vasc Anesth 2011;25:476-80. 39. Paarmann H, Groesdonk HV, Sedemund-Adib B, Hanke T,
Heinze H, Heringlake M et al. Lack of agreement between pulmonary arterial thermodilution cardiac output and the pressure recording analytical method in postoperative car-diac surgery patients. Br J Anaesth 2011;106:475-81. 40. Scolletta S, Miraldi F, Romano SM, Muzzi L.
Continu-ous cardiac output monitoring with an uncalibrated pulse contour method in patients supported with mechanical pulsatile assist device. Interact Cardiovasc Thorac Surg 2011;13:52-6.
41. Biais M, Cottenceau V, Stecken L, Jean M, Ottolenghi L, Roullet S et al. Evaluation of stroke volume variations ob-tained with the pressure recording analytic method. Crit Care Med 2012;40:1186-91.
42. Vincent JL, Rhodes A, Perel A, Martin GS, Della Rocca G, Vallet B et al. Clinical review: Update on hemodynamic monitoring--a consensus of 16. Crit Care 2011;18;15:229. 23. Scolletta S, Franchi F, Taccone FS, Donadello K, Biagioli
B, Vincent JL. An uncalibrated pulse contour method to measure cardiac output during aortic counterpulsation. An-esth Analg 2011;113:1389-95.
24. Biancofiore G, Critchley LAH, Lee A, Bindi L, Bisà M, Es-posito M et al. Evaluation of an uncalibrated arterial pulse contour cardiac output monitor system in cirrhotic patients undergoing liver surgery. Br J Anaesth 2009;102:47-54. 25. Jansen JR, Schreuder JJ, Mulier JP, Smith NT, Settels JJ,
Wesseling KH. A comparison of cardiac output derived from the arterial pressure wave against thermodilution in cardiac surgery patients. Br J Anaesth 2001;87:212-22. 26. Critchley LA, Lee A, Ho AM. A critical review of the ability
of continuous cardiac output monitors to measure trends in cardiac output. Anesth Analg 2010;111:1180-92. 27. Critchley LA, Yang XX, Lee A. Assessment of trending
abil-ity of cardiac output monitors by polar plot methodology. J Cardiothorac Vasc Anesth 2011;25:536-46.
28. Alhashemi JA, Cecconi M, Hofer CK. Cardiac output mon-itoring: an integrative perspective. Crit Care 2011;15:214. 29. Franchi F, Silvestri R, Cubattoli L, Taccone FS, Donadello
K, Romano SM et al. Comparison between an uncalibrated pulse contour method and thermodilution technique for cardiac output estimation in septic patients. Br J Anaesth 2011;107:202-8.
30. Concha MR, Mertz VF, Cortínez LI, González KA, Butte JM. Pulse contour analysis and transesophageal echocar-diography: a comparison of measurements of cardiac output during laparoscopic colon surgery. Anesth Analg 2009;109:114-8.
31. Combes A, Berneau JB, Luyt CE, Trouillet JL. Estimation of left ventricular systolic function by single transpulmo-nary thermodilution. Intensive Care Med 2004;30:1377-83.
32. Rex S, Brose S, Metzelder S, Hüneke R, Schälte G, Autsch-bach R et al. Prediction of fluid responsiveness in patients during cardiac surgery. Br J Anaesth 2004;93:782-8. 33. Rödig G, Prasser C, Keyl C, Liebold A, Hobbhahn J.
Con-Conflicts of interest.—Sabino Scolletta has received from Vygon lecture fees, research grants and some material for clinical studies. Federico
Franchi, Katia Donadello and Pierpaolo Giomarelli have received from Vygon some material for studies. Received on February 13, 2012 - Accepted for publication on September 18, 2012.
Corresponding author: F. Franchi, Department of Anesthesia and Intensive Care Unit, University of Siena, Viale Bracci 1, 53100 Siena, Italy. E-mail: [email protected]
y inter national cop yr ight la ws .
No additional reproduction is author
iz ed. It is per mitted f or persona l use to do wnload and sa v
e only one file and pr
int only one cop
y of this Ar ticle . It is not per mitted to mak e additional copies adically or systematically , either pr
inted or electronic) of the Ar
ticle f or an y pur pose . It is not per mitted to dis tr ib
ute the electronic cop
y of the ar
ticle through online inter
net and/or intr
anet file shar
ing systems , electronic mailing or an y allo w access to the Ar ticle .
The use of all or an
y par
t of the Ar
ticle f
or an
y Commercial Use is not per
mitted.
The creation of der
iv
ativ
e w
or
ks from the Ar
ticle is not per
mitted.
The production of repr
ints f
or personal or commercial use is
It is not per mitted to remo v e , co v er , o v er la y, obscure , b loc k, or change an y cop yr
ight notices or ter
ms of use wh
ich the Pub
lisher ma y post on the Ar ticle . It is not per mitted to fr ame or use fr
aming techniques to enclose an
y tr
ietar
y inf
or
mation of the Pub
lisher