Università degli Studi di Catania
Scuola Superiore di Catania
International PhD
in
Nanoscience
XXIV cycle
Ultrasensitive methods for the detection of
biomolecular systems at the micro/nano
scale
Laura Maria Zanoli
Coordinator of PhD
Tutor
Prof.ssa Maria Grazia Grimaldi
Prof. Giuseppe Spoto
CONTENTS
ABSTRACT ...3
1. INTRODUCTION...5
2. SURFACE PLASMON RESONANCE OPTICAL DETECTION ...9
3. PEPTIDE NUCLEIC ACID (PNA) ... 26
4. MICROFLUIDICS ... 31
4.1 Droplet generation ... 33
4.2 Physics at the micrometer scale ... 36
4.3 Droplet manipulation... 39
5. GOLD NANOPARTICLES ... 44
6. MATERIALS AND METHODS ... 52
6.1 SPRI experiments ... 52
6.1.1 Materials and reagents ... 52
6.1.2 SPRI experiments and data analysis ... 54
6.1.3 Microfluidic devices fabrication ... 55
6.1.4 Estimation of Adsorbate Film Thickness from Measured SPR Response . 56 6.1.5 PNA probe surface immobilization for SPRI experiments ... 59
6.1.6 Genomic DNA hybridization experiments ... 60
6.1.7 Synthesis and functionalization of gold nanoparticles ... 60
6.2 Microfluidics experiments ... 62
6.2.1 Materials and reagents ... 62
6.2.2 PCR amplification ... 66
6.2.3 Amplicons pre-treartment for microfluidics experiments ... 66
6.2.5 Microfluidic devices fabrication ... 71
6.3 Tube cleaning ... 73
7. RESULTS AND DISCUSSION ... 74
7.1 SPRI analysis of non amplified human DNA ... 74
7.2 Microfluidics experiments ... 82
7.2.1 Device optimization ... 82
7.2.2 PNA beacons ... 85
7.2.3 Detection of synthetic oligonucleotides in a droplet-based microfluidics approach ... 86
7.2.4 Detection of PCR amplification products in a droplet-based microfluidic approach ... 89
7.2.5 Circular strand displacement polymerization reaction ... 91
8. CONCLUSIONS ... 95
RESULTS OF THE RESEARCH ACTIVITY: PUBLICATIONS ... 98
ACKNOWLEDGEMENTS ... 99
ABSTRACT
A great effort has been devoted, during the past decade, to the development of new devices for specific DNA sequences detection, due to the relevance of nucleic acid analysis in many areas, including clinical diagnostics, environmental monitoring and food-quality control. However, diagnostic tools used for the detection of nucleic acids need to fulfil specific requirements in term of sensitivity, selectivity and high-throughput in order to expand their applicability and to minimize the cost of the assay. In fact, very small amount of DNA is typically available for the analysis and a detection scheme capable of directly transducing the hybridization events with a proper sensitivity is required. In addition, the sequence to be targeted is often present in a c omplex environment such as the whole genomic DNA and the use of very specific and highly efficient probes is required in order to build highly selective detection scheme.
The purpose of my research activity was the identification of new methodologies useful for DNA detection with the principal aim to perform the analysis with a very small amount of samples. In this perspective, interesting results were obtained by using microfluidic systems, characterized by the presence of one or more microchannels where fluid reagents are easily and carefully manipulated. In particular, the combined use of a droplet-based microfluidics, PNA-MBs and fluorescence microscopy enabled the selective and sensitive detection of DNA in an innovative and efficient platform. The experiments were carried out by using both oligonucleotides and PCR amplification products and were aimed at detecting DNA sequences of different olive cultivar.
The ultrasensitive detection of DNA was also investigated by coupling microfluidic devices with the SPRi apparatus. A similar approach allowed a real time
label-free detection of specific genomic DNA sequences carrying the β°39 thalassemia mutation. The capacity in term of selectivity and sensitivity was investigated by employing surface-immobilized PNA probes in combination with gold nanoparticle-enhanced SPRi detection. The DNA concentrations measured by this method are in a range suitable for detecting DNA samples without amplification.
1. INTRODUCTION
Diagnostic tools used for the detection of biomolecules need to fulfil specific requirements in term of sensitivity, selectivity and high-throughput in order to expand their applicability and to minimize the cost of the assay.1
The typical approach for the detection of DNA requires both the amplification by polymerase chain reaction (PCR) of the region of interest of the DNA target as well as labeling of the DNA samples by using fluorophores. These steps involve time consuming thermal cycles and sample pre-treatment; in addition they are subject to contamination problems and require expensive reagents. So a mayor challenge for rapid and reliable DNA analysis appears to be the development of methods that are based on label-free detection systems and do not require the polymerase chain reaction (PCR) amplification of the genetic samples
Both these requirements can be satisfied by Surface Plasmon Resonance imaging (SPRi), which is an optical technique used to monitor interactions established between receptors immobilized on a metal surface and analytes which are put in contact with the sensor surface.2,3,4 One of the main advantage of SPRi is the possibility of working without the use of labels such as fluorescent tags. Since the labelling step involves chemical modification of analytes, there is the risk that the properties and the function of the molecules are altered, especially in the case of biological systems. In addition, labelling imposes extra time and cost demands. Therefore label-free techniques such as SPRi offer preferred approaches for the analysis of biomolecular interactions such as DNA hybridization or antigen– antibody, protein–DNA, protein–protein and enzyme–substrate interactions. Moreover, the technique permits to monitor interactions rapidly and in real time. Unfortunately, the use of SPRi for genomic assays is limited by the reduced
sensitivity in the detection of hybridized DNA or RNA samples. However, a number of different strategies aimed at overcome the lack of sensitivity for unamplified DNA or RNA detection have been recently investigated.5,6 In particular, the use of properly functionalized colloidal gold nanoparticles (AuNps) have been shown to be useful in achieving a fM sensitivity in DNA target detection.7,8,9
The use of peptide nucleic acid (PNA) probes have also been reported to improve both selectivity and sensitivity in targeting complementary DNA and RNA sequences.10
Dealing with immobilized probes means that the target/probe interaction depends on passive diffusion of DNA samples toward the sensing probes. The limited solid-liquid diffusion greatly hinders the hybridization rate of target DNA and sensing probe. Thus, the hybridization time for DNA and immobilized-probe normally takes up to several hours and sometimes a large amount of sample. Moreover, washing steps are also normally required after the hybridization process to remove non-specific binding with the sensor surface. This further increases the whole process time. Therefore, it is important to develop DNA detection assays which are automated, even more easy to perform, faster and more accurate. They should imply low sample consumption, multiplex DNA analysis, integration and portable devices realization.
Droplet-based microfluidics contributes to define new and very powerful approaches for biomolecular diagnostics. Since its advent it has drawn great attention for its capability of miniaturizing typical laboratory operations using a fraction of the volume of reagents in significantly less time. Droplet-based microfluidic systems have been shown to be compatible with many chemical and biological reagents. The ability to rapidly create highly uniform aqueous droplets with controlled contents
enables the rapid analysis of very small quantities of reagents in a p ortable, automated and inexpensive format. The control of the separate and different molecular processes established within the droplets requires specific experimental conditions to be identified and optimized. For this reason, efforts have been paid in identifying experimental procedures to be used in content control. Moreover, the understanding of the mechanisms underlying the droplet formation process allowed several capabilities to emerge, like the possibility of droplets to be individually transported, mixed and analyzed.
The purpose of my research activity was the identification of new methodologies useful for DNA and RNA detection with the principal aim to perform the analysis with a very small amount of samples. Two fields were investigated: i) the ultrasensitive DNA detection obtained by using the metallic nanoparticle-enhanced surface plasmon resonance sensing and ii) droplet-based microfluidics.
In particular, the ultrasensitive detection of DNA and RNA was investigated by coupling microfluidic devices with the SPRi apparatus. A similar approach allowed a real time label-free detection of the nucleic acid. The SPRi capability in term of selectivity and sensitivity in the targeting DNA samples was investigated by employing surface-immobilized PNA probes in combination with a gold nanoparticle-enhanced detection. The potential in detecting specific genomic DNA sequences was also investigated. The experiments were carried out by using microfluidic devices, fabricated by replica molding procedures, which allowed multiplexed DNA detection procedures to be identified and optimized.
The study of droplet-based microfluidic procedures for the detection of biomolecular systems started by investigating the possibility to create highly uniform aqueous droplets with carrying controlled amounts of chemical species. The droplet
interface acts as a membrane confining the droplet content and allowing a large number of reactions and molecular processes to be established within such micro-compartment. The control of the separate and different molecular processes established within the droplets required specific experimental conditions to be identified and optimized. For this reason, efforts have been paid in identifying experimental procedures to be used in content control. Moreover, the understanding of the mechanisms underlying the droplet formation process allowed several capabilities to emerge, like the possibility of droplets to be individually transported, mixed or analyzed.
The detection of interaction events in microdroplets were investigated by using labeled biomolecules, such as DNA or PNA beacons, and suitable detectors (such as that present in fluorescence microscopes) with the principal aim to identify new tools to be used in the simple and cheap sensitive detection of biomolecular systems.
2. SURFACE PLASMON RESONANCE OPTICAL DETECTION
Surface plasmon resonance (SPR) is a powerful technique for the high sensitive and label-free detection of a large range of biological interactions occurring on a surface. SPR biosensors have been applied in numerous important fields including medical diagnostics, environmental monitoring, and food safety and security.11
The physical phenomenon of SPR was observed for the first time by Wood12,13 in 1902 as a pattern of dark bands in the spectrum of the diffracted light, when he illuminated a metallic diffraction grating with polychromatic light on a mirror with a diffraction grating on its surface.
A physical interpretation of the phenomenon was initiated by Lord Rayleigh14 and further refined by Fano, who concluded that these “anomalies” were associated with the excitation of electromagnetic surface waves on the surface of the diffraction grating.15 However, only in 1968 a complete explanation of the phenomenon was possible thanks to Otto16 and in the same year Kretschmann and Raether17 who reported the excitation of surface plasmons. The pioneering work of Otto, Kretschmann and Raether established a co nvenient method for the excitation of surface plasmons and their investigation, and introduced surface plasmons into modern optics.
In the late 1970s, surface plasmons were first employed for the characterization of thin films18 and the study of processes at metal boundaries19, while application of SPR-based sensors to biomolecular interaction monitoring was first demonstrated in 1983 by Liedberg et al.20 Subsequent efforts in research and development, relied on the combination of three unrelated fields: optics, microfluidics and surface chemistry, resulted in the successful development of the instrumental concept of
biomolecular interaction analysis (BIA). In 1990, Pharmacia Biosensor AB launched the first commercial SPR product, the Biacore instrument.21
Surface plasmons (SPs) can be considered as propagating electron density waves occurring at the interface between metal and dielectric.22
The free electrons of a metal are treated as an electron liquid of high density of about 1023cm-3 called “plasma”. Electron density fluctuations which propagate through the volume of the metal have characteristic frequency (eq. 1):
e p
h
m
ne
24
π
ω
=
eq. 1where
ω
p is the frequency associated to plasmon oscillations, n is the free electrondensity of the material, e is the electron charge, and me is electron mass. When the
plasma is excited by an external source with a frequency equal to
ω
p, it was shownthat the electrons collectively and coherently oscillate in the material.23 These charge density fluctuations propagating through the metal volume referred to as “bulk plasmons” have an energy in the case of gold of 3.22 eV.
Taking into account a m etallic surface interfaced with a medium having a dielectric constant
ε
1, the electronic charges on metal boundary can perform coherentfluctuations which are confined at the interface and vanishes both sides of the metal surface. The fluctuations occurring on the surface are called “surface plasmons”. This plasmon waves have p-character because the surface charge induce the oscillations of the electric field in the surface normal z-direction, while s-polarized waves have only oscillations of the electric field in the surface parallel x-direction (Figure 1). Surface plasmons are described by a wave vector Ksp parallel to the x
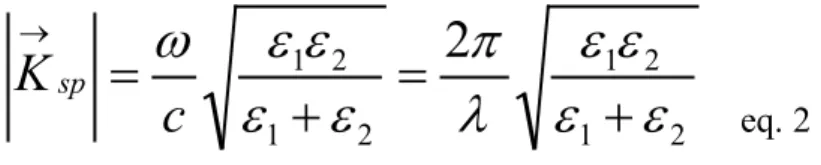
the surface plasmon longitudinal oscillations is tied to its wave vector Ksp by a dispersion relation24: 2 1 2 1 2 1 2 1
2
ε
ε
ε
ε
λ
π
ε
ε
ε
ε
ω
+
=
+
=
→c
K
sp eq. 2ε
2=
ε
’
2+i
ε
’’
2 is the complex dielectric constant, whereε
’
2 andε
’’
2 being the realand imaginary parts of the dielectric function of a metal at the interface with a medium having
ε
1 dielectric constant.Figure 1: Schematic of surface plasmon waves at the interface between a metal and a dielectric. The
plasmon propagates along the x-direction and decays exponentially into the z-direction.
The wave vector of light (Klight ) of the same energy ħωp traveling through the
medium ε1 is given by eq. 3
1
ε
ω
c
k
light=
eq. 3For surface plasmon excitation by a p hoton to take place, the wave vector of photon Klight and surface plasmons Ksp should be equal in magnitude and direction
ε
2ε
1z
We can obtain a graphical representation of SPR dispersion relation as shown in Figure 2.
Figure 2:Surface plasmon dispersion ω(kx) on gold surface. The vertical axis is scaled as ћω (eV). The straight solid line in the figure shows the light line kx = √ϵ2ω/c. The energy of bulk plasmon is
3.22 eV, and that of surface plasmon is 2.28 eV and shown as the arrows in the figure.
We can see that, apart from the origin, there is no point where the SPR curve and the light curve intersect. As a consequence, in this geometry a freely propagating beam of light incident upon the metal surface cannot excite a surface plasmon.
2 1 2 1 1
ε
ε
ε
ε
ω
ε
ω
+
≠
c
c
eq. 4Therefore, SPs are “nonradiative” fluctuations of the surface electron density since they cannot couple to wave light in a simple way: the SPs excitation with light needs special light-plasmon couplers.
One way to circumvent this problem is the use of a metal layer on which a periodic structure is prepared25 as illustrated in Figure 3.
Figure 3: Scheme of a diffraction grating
When light falls on such a structure, this acts as a d iffraction grating. Diffraction gives rise to a series of diffracted waves. If light hits a grating with a periodicity a, at a θ angle, the component of the generated wave vector in the plane of the grating can be written as:
a
m
n
c
K
ph=
ω
2sin
θ
+
2
π
→ eq. 5where m denotes the diffraction order. For a given angle of incidence θ, the matching condition for resonance can be fulfilled when
2 1 2 1 2
sin
2
ε
ε
ε
ε
ω
π
θ
ω
+
=
+
c
a
m
n
c
eq. 6The disadvantage of grating-based sensors is that the light beam is incident through the sample solution, which may give some inaccuracies if the sample is absorptive.
Another way of providing a w ave vector appropriate for SP excitation is by means of a prism couple and the attenuated total reflection (ATR) method. There are two configurations of the ATR method: Kretschmann geometry and Otto geometry.
In the Kretschmann geometry of the ATR method 26 (Figure 4), a high refractive index prism with a refractive index npr is interfaced with a metal-dielectric waveguide consisting of a thin metal film with dielectric constant ε2 and a dielectric
with a refractive index n1 (n1 < npr).
Figure 4: Configuration of Kretschmann geometry
When p-polarized light hits on the prism side opposite to the thin metal, at θ angles greater than the critical one obtained from the Snell’s law:
pr
ε
ε
θ
1sin =
eq. 7
light will be totally internally reflected and an evanescent field is generated at the point of internal reflection. The wave vector of the incident radiation takes the form:
ϑ
ε
ω
sen
c
k
pr=
pr eq.8At a certain angle of incidence, the wave vector of the incident light matches the SP wave vector and the coupling condition is satisfied:
2 1 2 1
sin
θ
ω
ε
ε
ε
ε
ε
ω
+
=
c
c
pr eq. 9Figure 5. Attenuated total reflection (ATR).
Charge density fluctuations induced by the photons/plasmons matching will also be p-polarized and will enhance the evanescent electric field amplitude which penetrates into the medium
ε
1.
SPR sensors investigate only a very limited vicinityor fixed volume at the metal surface. The penetration depth of the electromagnetic field (so-called evanescent field) at which a signal is observed typically does not exceed a few hundred nanometers, decaying exponentially from the surface in the direction perpendicular to the metal-dielectric interface with a distance within which the field intensity decreases by a factor of 1/e. The penetration depth depends on the wavelength and is given by (1/2k’’x)-1where k’’x is imaginary part of wave vector to the metal-dielectric interface.28
Considering that coupling conditions are depending from the dielectric constants of all the involved media including the prism, the metal layer and the dielectric medium in contact to the metal surface, any variation of the dielectric constant value of the region at the interface with the gold layer, within the range of penetration of the evanescent field, causes a variation into the parameters that fulfill the matching condition (eq. 9) and so, a shift in in the resonance angle.29 Such a distinguishing property is the basic principle which makes the surface plasmon resonance useful as biosensor.30
In the Otto geometry (Figure 6), a light a high refractive index (npr) prism is interfaced with a dielectric-metal waveguide consisting of a thin dielectric film with refractive index n1 (n1<npr) and a semi-infinite metal with dielectric constant ε2.
Figure 6. Excitation of surface plasmons in the Otto geometry of the ATR method.
According to this geometry, a light wave incident on the prism-dielectric film interface at an angle of incidence larger than the critical angle for these two media produces an evanescent wave propagating along the interface between the prism and the dielectric film. If the thickness of the dielectric layer is chosen properly (typically few microns), the evanescent wave and a surface plasmon at the dielectric-metal interface can couple.
Conditions for surface plasmon resonance are obtained in the infrared and visible wavelength region for air/metal and water/metal interfaces. Metals that support surface plasmons are silver, gold, copper, aluminum, sodium, and indium. The key parameters for the choice of a metal for SPR are: i) the purity of the surface: oxides and sulfides formed after the metal interaction with the atmospheric can interfere with SPR phenomenon; ii) compatibility of the metal reactivity with the surface chemistry needed for the realization of SPR experiments. Among several metals, gold is the most commonly used because it resists to oxidation, produces a strong SPR effect in the near-infrared region and is suitable for a convenient surface
chemistry useful for the immobilization of a v ariety of chemical and biological species.
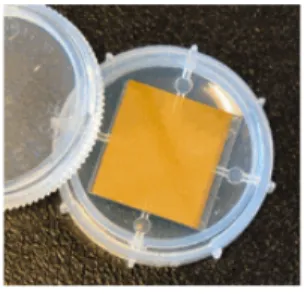
Typically, an SPR sensor surface (Figure 7) is composed by gold (45 nm) deposited onto a glass slide with a chromium adhesion layer (5 nm).31
Figure 7. Typical SPR sensor.
A surface plasmon resonance biosensor is able to measure the binding between target analyte molecules and a receptor immobilized on the gold surface. During the receptor/analyte binding event the shift of the dip in the spectrum of reflected light (modulating λ or θ) is monitored over time as SPR signal, and association, dissociation, kinetic information regarding biomolecules are gathered. SPR has the potential to investigate interactions between antigen/antibody couple, DNA-probe and its complementary strand, substrates and enzymes.32 SPR requires no labeling of the interacting components; the time required for the analysis is typically in the range of a few minutes; the sample consumption is in the nanomole-picomole range. The kinetic events at the metal surface, displayed as a sensorgram, can be investigated by monitoring the SPR signal change as a function of time. The time interval during which the analyte interacts with the surface bound receptor defines the 'association phase' whereas the time interval following the analyte interaction is termed 'dissociation phase'. In the association phase there is a simultaneous association and
rate equals the dissociation rate. Under ideal experimental conditions, only dissociation should take place during the dissociation phase.
In order to perform replicate SPR experiments any bound analyte molecule should be removed with no disrupting of the receptor structure and activity. So, a typical SPR experiment involves several steps displayed in Figure 8. Each measurement starts with conditioning the sensor surface with a suitable buffer solution (equilibration). It is of vital relevance to have a reliable baseline before the capturing event starts. At this point, the sensor surface contains the active ligands, ready to capture the target analytes. On injecting the solution containing the analytes, they are captured on the surface (association). Also other components of the sample might adhere to the sensor surface; without a s uitable selection of the ligand, this adherence will be non-specific, and thus easy to break. At this step, adsorption kinetics of the analyte molecule can be determined in a real-time measurement. Next, buffer is injected on to the sensor and the non-specifically bound components are flushed off. In this step, dissociation of the analyte starts, enabling the kinetics of the dissociation process to be studied.
Figure 8: Sensorgram for receptor-analyte interaction
the ligands remain on the sensor, whereas the target analytes are quantitatively removed (ideal condition). It is vital in order to perform multiple tests with the same sensor chip to use a r egeneration solution which leaves the activity of the ligands intact, as the analysis cycle is required to take place repeatedly for hundreds, sometimes even thousands of times. Again, buffer is injected to condition the surface for the next analysis cycle. If the regeneration is incomplete, remaining accumulated mass causes the baseline level to be increased.
Figure 9. Regeneration.
It is worth to notice that the change in the refractive index produced by the capture of biomolecules depends on the concentration of the analyte molecules at the sensor surface. If the binding occurs within a layer of thickness h, the SPR response is proportional to the binding induced refractive index change, which can be expressed as:
h
dc
dn
n
Γ
=
∆
eq. 10where (dn/dc) denotes the refractive index increment of the analyte molecules and Γ denotes the surface concentration in mass/area. Consequently, quantitative measurements of biomolecules adsorption can be obtained with SPR technique.33
SPR measurements can be carried out to determine the kinetics of a binding process, since the monitoring of SPR signal allows to estimate the association (ka) and dissociation (kd) rate constants of the analyte-receptor interaction.
AB
a d k k←
→
+
B
A
The affinity of the interaction can be described as “association constant” or affinity constant KA given by the ratio of the ka and kd. The affinity can be also expressed as “dissociation constant” or KD, which is simply the inverse of the KA.
The SPR data are analyzed through the use of modeling of interactions34 and fitting experimental data.35 The choice of a k inetic model should be based on the understanding of the underlying chemistry or physiology. For a g eneral reaction between a s urface immobilized receptor (A) and an analyte (B) that interact according to a s imple bimolecular association (Langmuir binding) a first order kinetic can be assumed.36
The differential rate equation describes the relation between the parameters:
[ ]
k
[ ][ ]
A
B
k
[ ]
AB
dt
AB
d
d a−
=
eq. 11The SPR response (R) is proportional to the amount of the [AB] receptor-analyte complex concentration onto the metallic surface; while maximum SPR signal (Rmax) produced when all the surface binding sites are occupied is proportional to initial concentration of [A] onto the surface. So, eq. 11 can be rewritten as:
[ ]
B
(
R
R
)
k
R
k
dt
dR
d a−
−
=
max eq. 12 or:[ ]
B
R
(
k
[ ]
B
k
)
R
k
dt
dR
d a a−
+
=
max eq. 13ka and kd values can be obtained from the equations 12-13 by linearization,37 curve fitting with analytical integration, or curve fitting with numerical integration.38
Linearization can be obtained by taking into account, from eq. 13, only the association phase; a plot of dR/dt versus R will therefore have a slope
(-ks) = - (ka[B]+kd) eq. 14
Straight lines were fit to the initial linear portion of the transformed association phase to obtain ks. These values are plotted against concentration of [B] and the slope of this second line is ka.
During the dissociation phase [B] = 0, so from eq. 13 we obtain:
R
k
dt
dR
d−
=
eq. 15The integration of eq. 15 gives:
t kd
e
R
R
=
− 0 eq. 16kd is calculated from the slope of the curve obtained by plotting ln (R0/R) versus time.
Analysis by linearization or integrated rate equation is adequate for interpreting simple bimolecular interactions. Integration of the differential rate equation for a simple bimolecular interaction (Eq.13) yields eq. 17:
[ ]
[
(( ))]
(
)
d a t k k B aB
R
e
B
k
k
k
R
=
max1
−
− [ ] a+ d[
]
+
eq. 17However, many interactions studied by SPR do not fit the simply bimolecular model. The numerical integration of the differential rate equation can be used to
obtain the final rate equation and the rate constants can be derived by non linear regression based on the so obtained rate equation. Numerical integration can be used to model any kinetic mechanism and in order to minimize mistakes, the data are usually analyzed globally by fitting both the association and dissociation phases for several concentrations simultaneously. This means that several related curves are fitted simultaneously giving one and more robust answer for the rate constants.39
SPR measurements can be made in a variety of formats that are classified according to the method used to detect the light wave modulated by surface plasmons. Traditional instruments are used for scanning-angle experiments, in which the change in percent reflectivity is measured as a function of incident angle, while the wavelength of light is held fixed. This SPR method has been popularized by the commercially available BIAcore instrument (www.biacore.com). Another common method is FT-SPR, which is based on the scanning of light wavelength as the angle of incidence is held fixed.40
One of the main advantage of SPR is the possibility of working without the use of labels such as fluorescent tags. Most screens that are used in drug discovery require some type of fluorescent labelling or radiolabelling to report the binding of a ligand to its receptor. Since the labelling step involves chemical modification of analytes, there is the risk that the properties and the function of the molecules are altered, especially in the case of biological systems. In addition, labelling imposes extra time and cost demands and can in some cases interfere with the molecular interaction by occluding a binding site, which leads to false negatives, or producing a background binding, leading to false positives. Therefore label-free techniques such as SPR offer preferred approaches for the analysis of biomolecular interactions, which constitute a key part of the drug discovery process, such as DNA hybridization
or antigen–antibody, protein–DNA, protein–protein and enzyme–substrate interactions.41,42 Moreover, the technique permits to monitor interactions rapidly and in real time.
In contrast to traditional SPR techniques, SPR imaging(SPRI), also called SPR microscopy, is performed with both the wavelength and the angle of incident light fixed, measuring the change in the reflected light intensity across the surface where an array of molecules is present. SPRI combines the advantages offered by the traditional SPR in term of real time analysis, no labeling requirements and high sensitivity, with those associated to an imaging system such as the simultaneous monitoring of the interaction of biomolecules arrayed onto the metal surface and the possible coupling with microfluidic devices.43,44
Surface Plasmon Resonance Imaging2, 45 was introduced by Rothenhäusler and Knoll46 in the 1988. Since then SPRI has been proposed as a powerful analytical technique able to investigate interactions between (macro)molecules and/or biomolecules arrayed onto chemically modified gold surfaces.47
In an SPRI experiment, spatial differences in percent reflectivity Δ%R (which can be seen as brighter or darker regions in the SPR image) are measured at a fixed angle and wavelength. A collimated p-polarized beam of light is used to illuminate a prism/thin gold film sample assembly at a single incident angle (near the SPR angle) and the intensity of the light reflected from the gold surface is detected with a charge coupled device (CCD) camera to produce the SPR image. The surface functionalization with a spatially controlled pattern of specific binding sites allows to observe in real time how the reflectivity minimum shifts depending on the adsorption processes occurring at these surface areas modified in spatially resolved manner. The spatial contrast in an SPR image comes from the heterogeneity in the complex
dielectric due to differences in refractive index or film thickness near the surface at different positions across the surface, which results in slight shifts in the resonance angle. If an adsorbate has a r efractive index different from that of the solvent, its presence on the surface can be detected with spatially resolution by monitoring changes in the reflected light intensity. Difference images obtained by the subtraction of a reference image from a post-binding image provide visual confirmation of the binding events: where binding occurs, reflectivity increases and regions of interest become brighter.
SPR imaging technology can be used to screen a variety of ligands for a particular protein of interest, thus facilitating the analysis of the protein’s functions in biological systems.48 Recently, potentials of SPR imaging for the detection of DNA:DNA, RNA:DNA, and DNA-protein have been demonstrated.49,50,51 However the use of SPRI for genomic assays is limited by the reduced sensitivity in the detection of hybridized DNA or RNA samples. Thus, a number of different strategies aimed at amplifying the SPRI response to DNA and RNA hybridization have been recently investigated,52,53 in particular using colloidal gold nanoparticles (AuNPs).54,55
On the other hand, another aspect which deserves attention is the sequence-specificity, in particular when single nucleotide polymorphisms (SNPs) or point mutations are concerned.56,57,58 SNPs can be involved in genetic diseases and increase the risk of cancer, but they could also be used as genetic markers to study and understand the human evolution. Many methods have been dedicated to the detection of DNA mutations due to their biological and medical impacts. In this perspective, interesting results were obtained by combining SPRI biosensing to the peptide nucleic acids (PNA) in targeting complementary DNA sequences.59
3. PEPTIDE NUCLEIC ACID (PNA)
PNA is an synthetic DNA mimic, introduced by N ielsen et al. in 1991,60 in which the negatively charged phosphate deoxyribose backbone is replaced by repeating neutral N-(2-aminoethyl)-glycine units linked by peptide bonds and the various purine and pyrimidine bases are linked to the backbone by methylene carbonyl bonds (Figure 10). PNAs have been shown to efficiently hybridize complementary DNA and RNA sequences with improved selectivity and sensitivity than DNA. Enhanced PNA targeting capabilities are related by the stronger interaction with the complementary DNA stand in comparison to the corresponding DNA/DNA interaction, caused by the absence of charges on the PNA backbone. In fact, the neutrality of the backbone prevents any electrostatic repulsion of the complementary DNA strand. PNAs offer a v ariety of other advantageous features with respect to DNA such as: i) superior pair mismatch discrimination; ii) reduced needs for high-salt condition to obtain hybridization; iii) better thermal stability of the PNA:DNA duplexes compared to the DNA:DNA equivalents; iv) stability over a wide pH range. PNAs are also resistant to enzyme degradation since they are not easily recognized by nucleases and proteases.
The thermal stability of the PNA/DNA duplexes is strongly affected by the presence of imperfect matches. Such presence of mismatches in a PNA/DNA duplex is much more destabilizing than a mismatch in a DNA:DNA duplex. This property of PNA is responsible for the remarkable discrimination between perfectly matching and mismatching sequences offered by PNA probes, and makes them so attractive as DNA recognition elements in biosensor technology. Since PNAs have been shown to be able to improve both selectivity and sensitivity in targeting complementary DNA
and RNA sequences, 10, 61 they have been proposed as valuable alternatives to oligonucleotide probes.62
Figure 10. Structures of double strand of PNA and DNA hybridization.
Surface plasmon optical detection of PNA/DNA and PNA/RNA hybridization was demonstrated since the end of 1990s. At that time efforts were paid in demonstrating the advantages offered by the use of PNA in DNA recognition. In this perspective, the effects on the SPR detection of the improved stability of the complex formed after the DNA or RNA detection were investigated. In order to compare the stability of PNA/DNA and DNA/DNA hybrids, biotinylated 21-mer oligonucleotide were immobilized on a streptavidin-coated sensor chip and then the interaction with the complementary PNA or DNA 9-mer molecules were evaluated by using an SPR based biosensor.63 An increased SPR response was detected for the PNA/DNA hybridization. A specific study of the kinetics of the dissociation processes revealed that the PNA/DNA hybrids are much more stable than DNA/DNA hybrids. Nevertheless, when longer PNA and DNA probes were used (14-mers), both PNA/DNA and DNA/DNA hybrids showed similar stability.
The thermal stabilities and the kinetics of the PNA/DNA, PNA/PNA and PNA/RNA reactions were also quantitatively evaluated by immobilizing PNA sequences on the SPR sensor surface. In particular, changes in the SPR response were compared when oligonucleotides, which were either fully matched to the immobilized PNA or contained mismatched bases, were absorbed on the PNA immobilized surfaces.64 The introduction of a single mismatch at the centre of pentadecamer PNA/DNA and PNA/RNA duplexes brings about increased dissociation and decreased association rate constants. The comparison of melting temperatures (Tm) for full-match and single mismatch sequences shows that Tm values are generally 4°C higher for PNA/RNA duplexes than those measured for the corresponding PNA/DNA duplexes. In accordance with the observed thermal stabilities, higher association and lower dissociation rate constants were found for PNA/RNA duplexes compared to PNA/DNA duplexes. It is worth noting that the fully complementary PNA/PNA duplexes showed higher Tm and ka and lower kd values in comparison to the values obtained from the corresponding PNA/DNA and PNA/RNA duplexes. These report showed the first systematic study of the effects of the presence of mismatches on the kinetics of the hybridization processes involving PNA oligomers
The use of surface-immobilized PNA probes in SPR detection provides a powerful tool for the study of pathogenic DNA. Unfortunately, limitations arise from the reduced sensitivity in the SPR detection of hybridized DNA or RNA samples. Convenient detection limits have been obtained by PCR amplifying the DNA target or by culturing the organism possessing the pathologic DNA before the SPR analysis. PCR-based amplification produces double-stranded DNA molecules that are detected by PNA probes because of the strong bind to the DNA complementary
strand. Indeed, it was demonstrated that binding to ‘Watson–Crick complementary’ target in double-stranded DNA by PNA takes place via strand displacement as a consequence of the extraordinarily high stability of the PNA/DNA complex.65,66 In particular, the specific detection of PCR-amplified pathogen DNA encoding verotoxin 2 extracted from Escherichia coli O157:H7 was investigated by using both DNA and PNA probes.67 As expected, the DNA probe generated a s maller SPR signal confirming that PNA/DNA duplexes are more stable than DNA/DNA duplexes. A detection limit of 7.5 pmol was obtained in the detection of the analyte PCR products. Moreover, it was demonstrated the possibility of detecting pathogenic DNA from stool samples and spiked stool samples. A similar approach was used for the detection of PCR products containing the Shiga toxin-2 (stx-2) genes in stool samples spiked with E. coli O157:H7 and in fecal samples from patients and healthy carriers.68
The immobilization of the PNA probe is an essential step in the development of a whole range of biosensors. In particular, SPR data reproducibility, sensitivity and selectivity are affected by lacks in the surface probe immobilization procedures.
The biotin-streptavidin coupling reaction is typically used for the immobilization of biotinylated nucleic acid probes. Streptavidin (like avidin) is a tetrameric protein with an exceptionally high affinity to biotin.69 The effect of the PNA probe immobilization through biotin-streptavidin coupling reaction on the binding capacity of the sensor surface has been studied.70 In particular, the hybridization efficiencies of a P NA probe immobilized on an SPR sensor surface through covalent or biotin-streptavidin coupling reaction were compared. The covalent binding approach was carried out by using a carboxylated dextran matrix activated with N-hydroxysuccinimide (NHS) and
1-ethyl-3-(3dimethylaminopropyl)-carbodiimide (EDC) and thiolated by addition of cystamine dihydrochloride followed by reduction with 1,4-dithioerythrite (DTE). The PNA probe, modified at its N-terminal with a maleimide group, was coupled to the sulfhydryl groups of the modified dextran matrix. Immobilization by covalent attachment has proven to be superior in stability, compared to non-covalent immobilization. In fact, ssDNA hybridization to PNA probes covalently bound to the dextran surface showed small signal loss from one measurement to another while decreased SPR signal intensities were revealed from sensors based on biotin-streptavidin probe immobilization. The SPR signal modification was a consequence of a decreased capacity of the surface for hybridization caused by the progressive loss of probe. A new immobilization of the probe restored the surface binding capacity. It was noted that since biotin-streptavidin binding is based on non-covalent interactions, the application of harsh conditions (e.g., regeneration of the surface with NaOH) destabilizes the PNA/DNA complex leading to PNA probe loss.
4. MICROFLUIDICS
Microfluidics is defined as the science and technology of systems that process or manipulate small (from nanolitres down to attolitres) amounts of fluids, using channels with dimensions of tens to hundreds of micrometres.71 Since its advent, microfluidics has drawn great attention for its capability of miniaturizing typical laboratory operations using a fraction of the volume of reagents in significantly less time.
Compared with the macroscale, microfluidic systems offer significant advantages such as short times for analysis, improvements in mass and thermal transfer, reduced sample volume, potential of automation and integration (lab-on-a-chip, micro Total Analysis Systems μTAS). Thanks to its small size and the laminar flow of fluids in microchannels, microfluidics offers fundamentally new capabilities in the control of concentrations of molecules in space and time.
The design of a microfluidic device often requires the assembly of several components, such as a system for the introduction of reagents, systems to move and mix fluids inside the chip, including valves, mixers and pumps, capable of controlling fluid flow by utilizing the physics of the microscale and various other components (such as detectors and systems for purification of products. This design often requires unusual geometries and the interplay of multiple physical effects that lead to interesting variants of well-studied physical properties of fluids moving in large channels and some new fluid responses.72
One of the most important phenomenon that differentiates macroscopic and microfluidic systems is turbulence. On large scales, fluids mix convectively, reflecting the fact that in macroscopic fluids inertia is often more important than
convectively but they flow in parallel, without eddies or turbulence; the only mixing that occurs is the result of diffusion of molecules across the interface (laminar flow) and specific components are required to obtain mixing.
Droplet-based microfluidic systems, unlike continuous flow systems, create discrete small volumes using immiscible fluids that are driven into separate microchannels via an independently controlled flow. Typically an aqueous solution is used as a dispersed phase while oil acts as a continuous phase. Reagents are confined in the droplets and each droplet is isolated from the channel walls by the immiscible liquid, thus greatly reducing sample contamination and eliminating reagent dispersion problems. Moreover, each droplet can be considered as an isolated microreactor and each microreactor can be individually controlled and analyzed.73,,74 This allows parallel processing, higher throughput and less sample consumption than continuous flow systems. Furthermore rapid mixing of reagents inside the droplets can be achieved: the rate of DNA hybridization in an homogeneous solution is about 40-fold faster than the hybridization rate in solid-liquid interfaces such as those of microarrays.
Droplets and particles have the potential to become important tools for drug delivery and biosensing. However, in order to properly use them correct dosing and manufacturing must be ensured. Since biological and chemical properties of microparticles are strongly affected by both their size and morphology, it is essential to be able to generate these structures at well-defined volumes and composition.75 The majority of microfluidic methods produce droplet diameters ranging from a few micrometres to hundreds of micrometres. Polydispersity, defined as the standard deviation of the size distribution divided by the mean droplet size, can be 1–3% while droplet volumes range from femtolitres to nanolitres. 76
Factors such as the use of surfactants, the viscosity of the immiscible phases, and the wettability of the channel walls can be used to manage the size of the formed droplets. The hydrophilicity or hydrophobicity of the microchannel surface also determines which liquid phase is dispersed.
Droplet-based microfluidic systems have been shown to be compatible with many chemical and biological reagents. The ability to rapidly create highly uniform aqueous droplets with controlled contents enables the rapid analysis of very small quantities of reagents in a portable, automated and inexpensive format. In addition, it is possible to split the single droplet into two or more droplets or keeping reagents separate until the proper conditions are available and then performing controlled coalescence of droplets. Both droplet fission and fusion can enhance the experimental capacity. These new capabilities have allowed the development of numerous biotechnology applications in the field of protein crystallization, advanced flow cytometry, enzyme kinetics studies, and DNA and blood analysis. 77, 78
4.1 Droplet generation
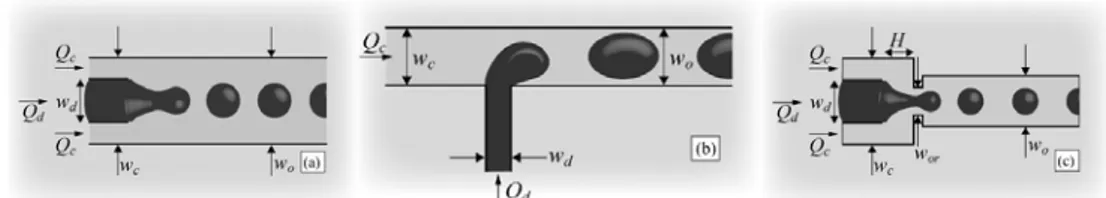
Droplets can be generated either by passive or active methods. Passive methods exploit the flow field to deform the liquid interface and to promote the natural growth of interfacial instabilities, avoiding moving parts and explicit external actuation. They can be grouped into three categories, characterized by the nature of the local flow field used to break the droplets: co-flowing streams, cross-flowing streams and elongation-dominated flows (Figure 11). In all cases, the continuous phase liquid preferentially wets the walls of closed microchannels and the droplet is prevented from contacting the wall due to an ever-present thin film of the
Figure 11. Illustrations of the three main microfluidic geometries used for droplet formation. (a)
Co-flowing streams, (b) crossCo-flowing streams in a T-shaped junction, and (c) elongational flow in a flow focusing geometry. wd and wc are the widths of the two inlet streams. The subscripts ‘d’ and ‘c’ indicate the dispersed phase liquid and the continuous phase liquid, respectively. The width of the
outlet channel wo into which the droplets travel after they break is also indicated. Qd and Qc, represent the volumetric flow rates. It is assumed that the device is planar with a uniform depth h.
In general, the fluid phase to be dispersed and a second immiscible liquid are driven into separate microchannels via independently controlled pressure-driven flows in which either volume flow rate or applied pressure are controlled. The two streams meet at a junction, at which the dispersed phase liquid extends to form a ‘finger’ or ‘jet’. The local flow field, which deforms the interface, is determined by the geometry of the junction and the volumetric flow rates of the two fluids. Finally, a free surface instability leads to the breakup of a droplet from the dispersed phase finger.
The size of the channels and of the orifice where the dispersed phase merges into the continuous phase certainly influences the size of the droplets. Fluids viscosity and surface tension as well as use of surfactants play a key role. 79
The wettability of nearby channel walls is critically important to the process, determining which liquid phase is dispersed. Controlling wetting of the channel walls by the continuous phase is important when switching between the generation of W/O and O/W emulsions or for the formation of double emulsions. To prevent the discrete phase from adhering to the channel walls, W/O droplets are formed in hydrophobic channels, whereas O/W emulsions require hydrophilic channels. Hydrophobic
treatments such as silanization and siliconization are used to make a hydrophilic surface hydrophobic.80 Surface treatments such as oxygen plasma and polyvinyl
acetate (PVA) coating can be implemented to temporarily convert the naturally hydrophobic surface of PDMS into a hydrophilic surface.81 Channel coating with
PEG has also been used as a hydrophilic surface treatment and a means to prevent protein adsorption.82
T-junction is the simplest configuration to form droplets (see Figure 11b). The inlet channel containing the aqueous phase perpendicularly intersects the main channel where the continuous phase flows, forming an interface at the junction.83, 84 The shear forces generated by the continuous phase and the pressure gradient force the dispersed phase to elongate along the main channel until the neck of this same phase thins and eventually breaks to form a droplet. Droplet size can be changed by altering fluid flow rates, channel dimensions or fluid properties such as viscosity between the two phases.
In the flow-focusing configuration,85, 86 both phases are forced through a narrow region in the microfluidic system (Figure 11c). Generation of droplets is more controlled and stable in this case because the design employs symmetric shearing by the continuous phase on the discrete phase. The same parameters listed for the T-junction design govern droplet generation in flow-focusing designs.
In addition to T-junction and flow-focusing methods that depend on channel geometry to control the generation of droplets, emerging technologies have enabled electrodes to be integrated into microdevices to provide electrical control over droplet formation. Two examples of these electrohydrodynamic (EHD) methods are dielectrophoresis (DEP), that generates uniform droplets by pulling them away from a fluid reservoir simply applying a non-uniform electric field,87, 88 and
electrowetting on dielectric (EWOD), in which droplets are formed by applying an electric field that changes the interfacial energy and so the contact angle between a fluid and the surface it is in contact with.89, 90
4.2 Physics at the micrometer scale
In general, relevant fluid properties are viscosity (μ), density (ρ) and interfacial tension (γ). Liquids are typically Newtonian, thus the shear stress is directly proportional to the strain rate within the fluid.
Pressure-driven flow is accomplished using either syringe pumps, which impose constant volumetric flow rates, or gas pressure cylinders, in which a regulator controls the imposed pressures.
At the microscale, different forces become dominant over those experienced in everyday life.91 Microfluidics has been able to exploit such fundamental differences between fluids flowing at the macroscale and those travelling though microchannels, allowing to perform techniques and experiments not possible on the macroscale and new functionality and experimental paradigms to emerge.92, The effects that become dominant in microfluidics include laminar flow, diffusion, fluidic resistance, surface area to volume ratio and surface tension.
The essential fluid physics of a system is in the end dictated by a competition between various phenomena, which could be described by a group of dimensionless numbers expressing their relative importance. Dimensionless parameters define units such as volume, column length, linear flow rate, retention time and pressure drop in terms of quantities that can be assumed to be constant over the entire system. 93
average velocity and ρ the fluid density) to viscous forces (μ/L, where μ is the dynamic viscosity and L the characteristic length, such as the diameter of the channel). It can be an indication of tendency of a fluid to move in laminar or turbulent flow conditions.94
eq. 18
Reducing the characteristic length scale has the same effect on fluid behavior in terms of Re as increasing the viscosity of the solution. Quantitatively, for a flow in a circular pipe, a Re of ~2300 marks roughly the transition from laminar to turbulent flow. In most microfluidic systems, flows are well below a Re of ten and often even below unity, so viscous forces typically overwhelm inertial forces and fluids adopt laminar flow. This fact has important implications and forms the basis of many microfluidics-based technologies but, depending on the particular application, this feature can also pose significant challenges.
In the everyday high-Re macroscopic world, random eddies continuously stretch and fold fluid elements chaotically. As a result of this turbulent mixing, gradients are significantly enhanced and time scales for mixing are dramatically reduced. One of the consequences of laminar flow in the low-Re world of microfluidics, however, is that mixing of molecules in the fluid occurs solely through molecular diffusion, which can result in long mixing times. Purely diffusive mixing can be desirable for some applications but also to be avoided in others. Microfluidic chemical reactors require different solutions to be brought together and mixed rapidly. However, in sorting and analysing the products of reactions, the faster the mixing the harder the separation.
The diffusion time τD required for a m olecule to diffuse a g iven distance L scales quadratically with the distance, and can be described the eq. 19:
D
L
D2
2=
τ
eq. 19
where D is the diffusion coefficient of the molecule (m2 s-1). During this time, the front of a fluid will have moved a certain distance
eq. 20
down the channel. So that the number of channel widths required for complete mixing would be of order: 95
eq. 21
that is the Peclet number (Pe) which expresses the relative importance of convection to diffusion. Microfluidic systems where low Re number are encountered, are also often characterized by low Péclet numbers, that is diffusion prevails over convection. Dealing with immiscible fluids means indeed that there is an interface to take into account. When an aqueous flow encounters an oil flow, competing stresses drive the interface: surface tension acts to reduce the interfacial area and viscous stresses act to extend and drag the interface downstream. These stresses destabilize the interface and cause droplet generation.84, 96
Another dimensionless number, the Capillary number (Ca), is often used to describe such systems where surface tension plays a central role.
eq. 22 Where
U = velocity μ = viscosity
γ= surface tension
When shear is used at high values of Ca, the diameter of the droplets R (m) is then described by the eq. 23:97
eq. 23 where h (m) is the cross-sectional dimension of the channel.
Above a certain critical capillary number, droplet breakup occurs. It is important to note that this critical value is system dependent as different values have been reported by various groups using different geometries.77, 98, 99
In order to facilitate formation of droplets, it is important to consider the relative viscosity between the discrete and continuous phases, in particular selecting a more viscous continuous phase.
4.3 Droplet manipulation
Several actions can be performed on droplets generated in a microlfuidic device: fission, fusion, mixing and sorting. Mixing is an important tool required for carrying out and studying the kinetics of biological and chemical reactions. Before a reaction between two reagents can occur, intimate contact between the component molecules must be realized through mixing but, due to laminar flow conditions inside microfluidic channels, when two fluids come into contact with each other there is no turbulent mixing and reagents meet only because of diffusion. Diffusion can be an efficient transport mechanism at the nano- and low micro-scale, but turns out inefficient at the higher micro- and macro-scale. Even if the diffusion distance is
small, the time required to completely mix the two fluids could be still too long. The approximate diffusion coefficient for small molecules is typically 5 × 10⁻¹⁰ m2/s and for proteins 5 × 10–11 m2/s. 100 Consequently, for a small molecule it will take 0.1 s to diffuse 10 μm, 10 s for 100 μm, and more than 27 h to diffuse 1 cm. Thus the same properties that allow adjacent miscible fluids to flow in distinct streams become a problem when the fluids have to be mixed.
If efficient mixing is required, for example to carry out chemical reactions, different strategies must be employed to address the problem of slow diffusive mixing under laminar flow.101, 102 They can all be broadly classified as being either passive or active. Passive mixers rely on geometric properties of the channel or fluidic streams to maximize the area over which diffusion can occur, whereas active mixers rely on time-dependent perturbations of the fluid flow to achieve mixing.103
Passive mixers have found the widest use in synthetic applications due to their simplicity and operational flexibility. When a droplet moves through a straight channel, an equal recirculating flow is generated in each half of the droplet that touches the channel wall.104 Fluids within each half of the droplet are mixed, but the
halves remain unmixed and separated from each other. To enhance internal mixing within droplets, channel geometry is used to create chaotic advection to fold and stretch the droplet contents (Figure 12a).
Chaotic advection in microfluidic systems can be achieved by introducing obstacles within channels or on channel surfaces, or by modifying channel geometries, for example with the use of bends and turns. In each case, the modification acts to enhance stretching, folding and breaking of the flow. As the droplet traverses through a winding channel, the halves of the droplet experience unequal recirculating flows. One half of the droplet is exposed to the inner arc of the
winding channel, a shorter channel section, and thus a smaller recirculating flow is generated compared to the other droplet half which is exposed to a longer channel section (Figure 12b). The irregular motion along the walls promotes chaos and crossing of fluid streams since the fluid vortexes of each half are asymmetrical. The droplets achieve an alternating asymmetric flow pattern through the serpentine microchannels. The sharp turns also help to reorient the droplet so that it becomes thoroughly mixed as it goes through a series of stretching, reorientation, and folding (Figure 12c).105 An advantage of this design is that the degree of mixing is determined by the length of the channel.
Figure 12. Passive mixing within droplets. (a–b) Schematic demonstrating mixing patterns within droplets inside winding channels. (c) Experimental results show the rotational pattern.
Active mixing is instead electrically controlled with either the droplets sandwiched between electrodes, or with the droplets lying on an array of electrodes. The droplets may also be separated by a hydrophobic dielectric layer and not in direct contact with the electrodes. Electric control allows droplets to be moved and mixed in a confined space whereas channel-based mixing requires more elaborate and long winding channels. Each droplet is also individually controlled and its mixing is not dependent on channel design or fluid flow rates.106
To perform a multiple-step reaction, reaction mixtures must be combined and split in a controlled manner. By using droplet-based microfluidics, reactions can be
combined by merging two droplets and also split by splitting one droplet into two smaller droplets.107 Various methods have been developed for merging and splitting droplets. In passive fusion the device itself drives droplets at a precise position where fusion can occur. It can be controlled by varying flow rates and channel geometry or altering surface hydrophilicity selectively.108 For example, in order to combine two parallel reactions, two sets of droplets can be formed in two parallel microchannels that converge into one main channel. The two sets of droplets will merge within the main channel if the frequency is matched between the two droplets.
Droplet fusion starts when two or more droplets are brought into contact. Increased pressure and surface tension will lead to drop coalescence.109 The simplest way to promote passive fusion is to insert an expanded region along a channel.110 The expanded region helps draining the continuous phase between the droplets and reduces droplets flow rates. Then drops enter again a narrower channel and this will promote fusion.
Again splitting is said to be passive if no external components or power sources are used. It is rather performed with the aid of the shear forces created by channel design at precise location in the microfluidic device. It can be controlled by varying the flow rate of the continuous phase and placing resistances along the channels. On the other hand active fission implies external power or electrical control of the splitting mechanism.
Sorting allows functions as the isolation of droplets of interest, purification of synthesized samples and the segregation of heterogeneous mix of droplets. It enables individual control of single droplets out of a population. Passive sorting relies on channel geometry modifications or gravity to distinguish the droplets to be sorted. As an example, a new size sorting mechanism that causes droplets to sort into two
different daughter channels under a fixed flow rate was demonstrated.111 Droplet sorting by size was achieved in microfluidic channels through controlling the bifurcating junction geometry and the flow rates of the daughter channels. In size-based sorting using channel geometry, the microfluidic channels are designed so that the flow stream of the continuous phase carries the smaller satellite droplets into a side channel, whereas the larger primary droplets flow through the main channel.112 Due to their smaller surface area, the satellite droplets are exposed to the flow projected from only the side branch whereas the larger droplets feel the higher velocity flow stream of the main channel.
An active sorting system employs an increased level of complexity, but provides more flexibility. Active sorting employs electrical control and has also been used as a mechanism to manipulate the droplets. A droplet-based microfluidic platform for the analyses of cells have been described that is able to dielectrophoretically sort drops sorted at high speed based on fluorescence.113 This screening system operates as a d rop-based FACS (Fluorescence-activated cell sorting) in that it interrogates individual cells and sorts them based on the results. However, unlike a traditional FACS, the cells remain encapsulated in drops and the entire reaction vessel is assayed and sorted. This methodology is not limited to reactions with cells or even to biological reactions. In this sense, drop-based microfluidics has many of the merits of both screening using microtiter plates and FACS.