Universit`
a degli Studi di Catania
Facolt`a di Scienze Matematiche, Fisiche e NaturaliDipartimento di Fisica ed Astronomia
Dottorato di Ricerca in Fisica Ciclo XXIV
Sezione Astrofisica
Luminous – Early Interactive
Type II Supernovae
Supervisori:
Chiar.mo Prof. Gaetano BELVEDERE Dott. Massimo TURATTO
Coordinatore:
Chiar.mo Prof. Francesco RIGGI
Dottorando: Cosimo INSERRA
”Non chi comincia ma quel che persevera”
Contents
List of Figures v
List of Tables xvii
1 Introduction 1
1.1 The Supernova event . . . 1
1.2 Supernovae classification . . . 2
1.3 General properties of Supernovae . . . 5
1.3.1 Supernovae Ia (Thermonuclear SNe) . . . 5
1.3.2 Supernovae Ib/c . . . 8
1.3.3 Supernovae IIb . . . 10
1.3.4 Supernovae II . . . 10
1.3.5 Supernovae IIn . . . 13
1.4 CC-SNe: physics of the explosion . . . 15
1.5 CC-SNe: open issues . . . 18
1.5.1 Progenitor Masses . . . 20
1.5.2 Dust . . . 20
1.5.3 Role of the interaction ejecta-CSM . . . 23
1.6 Motivation of the thesis and outline . . . 25
2 Observations and data processing 29 2.1 Instrumental configuration . . . 30
2.2 Data reduction . . . 34
2.2.1 Photometry . . . 35
CONTENTS
3 SNe IIP early interacting: The main set 42
3.1 Introduction . . . 42 3.2 Individual SNe . . . 44 3.2.1 SN 2007od . . . 44 3.2.2 SN 2009bw . . . 52 3.2.3 SN 2009dd . . . 58 3.2.4 SN 2007pk . . . 64 3.2.5 SN 2010aj . . . 69
3.3 Colour curves and bolometric light curves . . . 73
3.4 Spectroscopy . . . 84 3.4.1 SN 2007od . . . 84 3.4.2 SN 2009bw . . . 91 3.4.3 SN 2009dd . . . 97 3.4.4 SN 2007pk . . . 100 3.4.5 SN 2010aj . . . 103
3.4.6 Comparison among spectra of type II SNe . . . 108
3.5 Spectral Analysis with NLTE and LTE codes . . . 118
3.5.1 SN 2007od with PHOENIX and SYNOW . . . 118
3.5.2 SN 2009bw with SYNOW . . . 128
3.6 Dust formation and CSM late interaction in SN 2007od . . . 131
3.7 Discussion . . . 139
3.7.1 SN 2007od . . . 139
3.7.1.1 Explosion and progenitor parameters . . . 144
3.7.2 SN 2009bw . . . 147
3.7.2.1 Explosion and progenitor parameters . . . 147
3.7.2.2 Conclusions about SN 2009bw . . . 148
3.7.3 SN 2009dd, SN 2007pk and SN 2010aj . . . 155
4 SNe IIP early interacting: previous additional archival objects 157 4.1 Indiviual SNe . . . 158
4.1.1 SN1993ad . . . 158
4.1.2 SN1995ad . . . 160
CONTENTS
4.2 Colour curves and bolometric light curves . . . 163
4.3 Spectroscopy . . . 170
4.3.1 The Dataset . . . 170
5 SNe early interacting: analysis of close CSM geometry and mass loss 181 5.1 Progenitor mass loss: mechanisms and asymmetry . . . 184
5.2 Early interaction . . . 187
5.2.1 Geometry . . . 187
5.2.2 Mass and mass loss rates . . . 193
6 Final remarks 196
A SNe local sequences 202
B SNe spectroscopic journals 206
List of Figures
1.1 Schematic spectra of type Ia, Ib/c and II at maximum, tree weeks and a year after maximum (236). . . 3 1.2 Comparison between photometric evolution (251) of SNe Ia and
Ib/c (left panel) and type II (right panel). . . 4 1.3 Classification scheme of SNe (234). . . 6 1.4 SNe II spectra at ∼3 months after explosion (95). . . 12 1.5 Light curve of the well studied SN 1987A in V band. The main
process involved in shaping the light curve are also reported (128). 16 2.1 PSF-fitting technique applied to SN 2007od: the original image
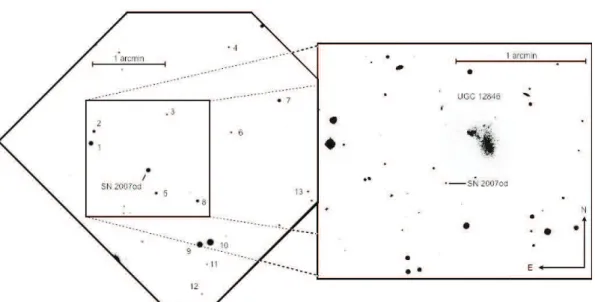
of the SN is shown (bottom-left panel); the SN contribution (fit-ted star), obtained after that the background at the SN position has been estimated fitting the region with a bidimensional poly-nomial of fixed degree (upper-left panel); and residual background (bottom-right). . . 36 3.1 (Left) R band image of SN 2007od in UGC 12846 obtained on
November, 2007 with the 1.82-m Copernico telescope + AFOSC at Mt. Ekar (Asiago, Italy). The exposure is so short that the low surface brightness parent galaxy is barely visible. The sequence of stars in the field used to calibrate the optical and NIR magnitude of SN 2007od is also labelled. (Right) Blow-up of the region of the parent galaxy in an R-band frame obtained on July 16, 2008 with the 2.2-m telescope of Calar Alto equipped with CAFOS . . . 44
LIST OF FIGURES
3.2 U, B, V and R band residuals in the first 106 days with respect to low order polynomial fits of all available data. Different instru-ments are marked with different symbols. . . 49 3.3 Synoptic view of the light curves of SN 2007od in all available
bands. The U, B, V light curves include data both from based telescopes and SWIFT, RIJHK light curves from ground-based telescope images, and uvw2, uvm2 and uvw1 light curves only from SWIFT. The magnitude shifts from the original value reported on Tab. 3.4 are in the legend. Open VRI symbols are magnitude values reported in Andrews et al. (4). . . . 51 3.4 R band image of SN 2009bw in UGC 2890 obtained with CAHA+CAFOS
on August 30th, 2009. The sequence of stars in the field used to calibrate the optical and NIR magnitude of the 2009bw is indicated. 54 3.5 Synoptic view of the light curves of SN 2009bw in all available
bands. The shifts from the original values reported on Tab. 3.8 are in the legend. Vertical marks at the bottom indicate the epochs of available spectra. . . 56 3.6 R band image of SN 2009dd in NGC 4088 obtained with CAHA+CAFOS
on November 19th, 2009. The local sequence of stars used to cali-brate the optical and NIR magnitudes of the SN 2009dd is indicated. 60 3.7 Synoptic view of the light curves of SN 2009dd in all available
bands. The U, B, V light curves include data both from based telescopes and SWIFT, RIJHK light curves from ground-based telescopes, and uvw2, uvm2 and uvw1 light curves from SWIFT only. The magnitude shifts from the original values re-ported on Tab. 3.12 are in the legend. . . 62 3.8 R band image of SN 2007pk in NGC 579 obtained with NOT+ALFOSC
on January 11th, 2008. The sequence of stars in the field used to calibrate the optical magnitude of the 2007pk is indicated. . . 65
LIST OF FIGURES
3.9 Synoptic view of the light curves of SN 2007pk in all available bands. The U, B, V light curves include data both from ground-based telescopes and SWIFT, RI light curves from ground-ground-based telescope images, and uvw2 and uvw1 light curves only from SWIFT. The magnitude shifts from the original value reported on Tab. 3.16 are in the legend. . . 68 3.10 R band image of SN 2010aj in MGC -01-32-035 obtained with
TNG+DOLORES on May 22th, 2010. The sequence of stars in the field used to calibrate the optical and NIR magnitude of the 2010aj is indicated. . . 69 3.11 Synoptic view of the light curves of SN 2010aj in all available
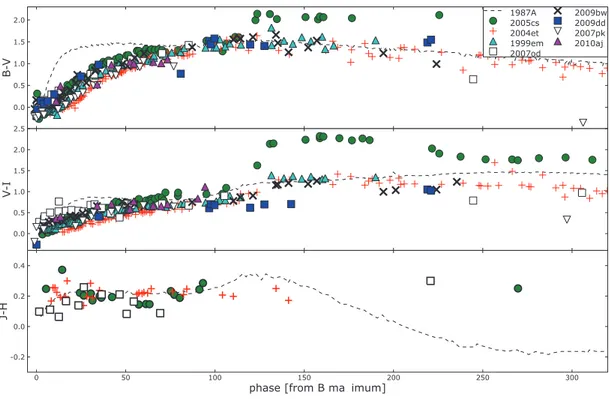
bands. The magnitude shifts from the original value reported on Tab. 3.19 are in the legend. . . 72 3.12 Comparison of the dereddened colours of SN 2007od, SN 2009bw,
SN 2009dd, SN 2007pk, SN 2010aj, SN 1987A, SN 2005cs, SN 1999em and SN 2004et. The phase of SN 1987A is respect to the explosion date . . . 75 3.13 Zoom of Fig. 3.12 in the first 65d. . . 77 3.14 uvoir (black squares), UBVRIJHK (green triangles) and UBVRI
(cyan circles) light curves of SN 2007od. Also reported is the ex-tension of the UBVRI light curve to late phases obtained with data of Andrews et al. (4). The slope of 56Co to56Fe decay is also
displayed for comparison. A blow-up until 40d post maximum is shown in the upper–right corner. Distance modulus and reddening are those reported in Tab. 3.3. . . 78 3.15 Comparison on the whole optical-to-NIR (UBVRIJHK) domain of
SN 2007od with those of other type II SNe. . . 79 3.16 Flux contribution of NIR bands to the U-to-K bolometric light
LIST OF FIGURES
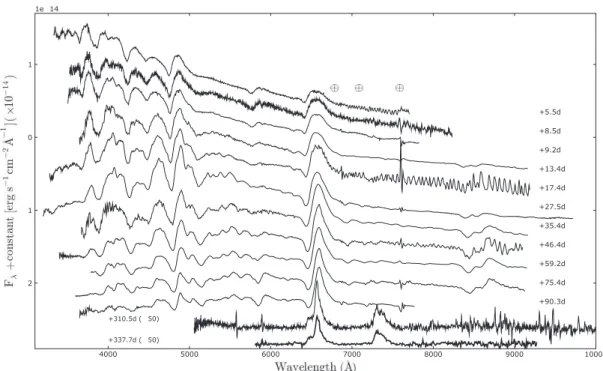
3.17 Comparison of quasi-bolometric light curves of our sample with those of other type II SNe. For SN 1992H the data are limited to BVR, while for SN 1979C are UBVR. Hence the reported val-ues are lower limits The distances and reddenings adopted for the comparison with our SN sample are reported in Tab. 3.21. Mi-nor misalignments in the epoch of maxima are due to the different epochs adopted for the maxima of the reference band light curve and the quasi-bolometric curve. . . 81 3.18 The overall spectral evolution of SN 2007od. Wavelengths are in
the observer’s rest frame. The phase reported for each spectrum is relative to the explosion date (JD 2454404). The ⊕ symbols mark the positions of the strongest telluric absorptions. The ordinate refers to the top spectrum; the other spectra are shifted downwards with respect to the previous one by 2 × 10⁻¹⁵ (second spectrum),
4.3 × 10⁻¹⁵ (third) and 2.2 × 10⁻¹⁵ erg s−1 cm−2 ˚A−1(others). . . 86
3.19 Top: optical spectrum of SN 2007od, obtained 5 days past explo-sion (JD 2454404). Bottom: optical spectrum of SN 2007od, 27 days past explosion. Both spectra have been corrected for absorp-tion in our galaxy and corrected by redshift. The most prominent absorptions are labelled. . . 88 3.20 Top: expansion velocity of Hα, Hβ, He I λ5876, Fe II λ5169 and
Sc II λ6246 as measured from the minima of the P-Cygni profiles. Middle: comparison of the Hα velocity of SN 2007od with those of other SNe II. Bottom: Evolution of the continuum temperatures Tbb for the same SN sample. . . 89
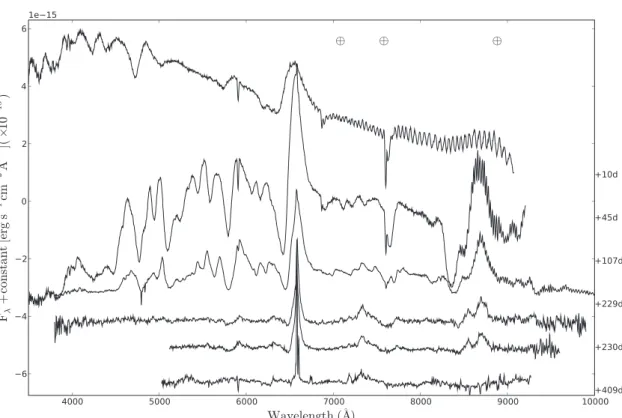
3.21 The overall spectral evolution of SN 2009bw. Wavelengths are in the observer rest frame. The phase reported for each spectrum is relative to the explosion date (JD 2454916.5). The ⊕ symbols mark the positions of the most important telluric absorptions. The or-dinate refers to the first spectrum. The second spectrum is shifted downwards by 2 × 10⁻¹⁵ units, the third by 3.3 × 10⁻¹⁵ units with
respects to the second, others by 1.5×10⁻¹⁵erg s−1 cm−2˚A−1 with respect to the previous. . . 92
LIST OF FIGURES
3.22 Composed spectrum of SN 2009bw, from optical to NIR, at ∼ 20d past explosion date (JD 2454916.5). A black body fit at ∼7900 K is over-plotted. . . 93 3.23 Top: expansion velocity of Hα, Hβ, HeI λ5876, FeII λ5169 and Sc
II λ6246 measured from the minima of P-Cygni profiles. Middle: comparison of the Hα velocity of SN 2009bw with those of other SN II. Bottom: Evolution of the continuum temperature of SNe 2009bw, 2007od, 1999em, 2004et, 2005cs, 1992H. . . 95 3.24 The overall spectral evolution of SN 2009dd. Wavelengths are in
the observer’s rest frame. The phase reported for each spectrum is relative to the explosion date (JD 2454925.5). The ⊕ symbols mark the positions of the strongest telluric absorptions. The ordinate refers to the top spectrum; the other spectra are shifted downwards with respect to the previous one by 4 × 10⁻¹⁵ (second and third)
and 1.2 × 10⁻¹⁵ (others). . . . 98
3.25 The overall spectral evolution of SN 2007pk. Wavelengths are in the observer’s rest frame. The phase reported for each spectrum is relative to the explosion date (JD 2454412). The ⊕ symbols mark the positions of the strongest telluric absorptions. The ordinate refers to the top spectrum; the other spectra are shifted downwards with respect to the previous one by 7 × 10⁻¹⁶, except the third
shifted by 1 × 10⁻¹⁵. . . 101
3.26 NIR spectrum of SN 2007pk at ∼ 66d past explosion date (JD 2454412). Wavelengths are in the observer rest frame. . . 102 3.27 The overall spectral evolution of SN 2010aj. Wavelengths are in
the observer’s rest frame. The phase reported for each spectrum is relative to the explosion date (JD 2455265.5). The ⊕ symbols mark the positions of the strongest telluric absorptions. The ordinate refers to the top spectrum; the other spectra are shifted downwards with respect to the previous one by 2 × 10⁻¹⁶ and 6 × 10⁻¹⁶ (only
LIST OF FIGURES
3.28 Expansion velocity of Hα, Hβ, HeI λ5876, FeII λ5169 and Sc II
λ6246 measured from the minima of P-Cygni profiles for SN 2009dd,SN 2007pk and SN 2010aj. . . 106 3.29 Top: comparison of the Hα velocity of our SNe sample with those
of other SN II. Bottom: Evolution of the continuum temperature of SNe of our sample plus SNe 1999em, 2004et, 2005cs, 1992H. . . 107 3.30 Comparison among spectra of SN 1999em, SN 2007od and SN
2005cs around 5 days after explosion. For references see Tab. 3.21. 108 3.31 Comparison among spectra of SN 2004et, SN 2007od, SN 2005cs
and SN 1999em during the plateau phase. For references see Tab. 3.21. . . 109 3.32 Comparison among spectra of SN 1987A, SN 2007od, SN 2005cs,
SN 1999em and SN 1992H during the nebular phase. For references see Sect. 3.4.6 and Tab. 3.21. . . 110 3.33 Top panel: comparison among spectra of SN 2009bw, SN 1998S
and SN2006bp about ∼4d past explosion. Bottom panel: compar-ison among spectra of SN 2009bw, SN 1999em and SN 1992H about ∼18d past explosion. For references, see the text and Tab. 3.21. . 111 3.34 Comparison among spectra of SN 2009bw, SN 1999em and SN
1992H in the photospheric phase. For references, see the text and Tab. 3.21. . . 112 3.35 Comparison among spectra of SN 2009bw, SN 1987A, SN 1999em
and SN 1992H during the nebular phase. For references, see the text and Tab. 3.21. . . 113 3.36 Comparison among spectra of SN 2009dd, SN 2007od and SN 2009bw
during the plateau phase. . . 114 3.37 Comparison among spectra of SN 2007pk, SN 1998S, SN 2006bp
and SN 2009bw about ∼4 days after explosion. For references, see the text and Tab. 3.21. . . 115 3.38 Comparison among spectra of SN 2007pk, SN 2007od, SN 1998S
and SN 1999em during the plateau phase. For references, see the text and Tab. 3.21. . . 116
LIST OF FIGURES
3.39 Comparison among spectra of SN 2010aj, SN 2007od and SN 2009bw at ∼22 days post explosion. . . 117 3.40 Comparison between the normalized optical spectrum of SN 2007od
at 5 days post explosion (JD 2454404) and the SYNOW synthetic spectrum (for composition of synthetic spectra see text). . . 119 3.41 Comparison between the optical spectrum of SN 2007od at 5 days
post explosion (JD 2454404) and PHOENIX full NLTE spectrum (for model parameters see Tab. 3.27). . . 120 3.42 PHOENIX evolution compared to observed spectra. . . 121 3.43 Zoom of the PHOENIX evolution at the 4440˚A region compared to
observed spectra. . . 123 3.44 Comparison between optical spectrum of SN 2007od at 27 days
post explosion (JD 2454404) and PHOENIX full NLTE spectrum (for model parameters see Tab. 3.27). . . 125 3.45 Expansion velocities measure of Hα, Hβ, He I, Fe II through
PHOENIXNLTE spectra compared with those measured in observed spectra. . . 126 3.46 Comparison between optical spectrum of SN 2009bw at ∼18 days
post explosion (JD 2454916.5) and SYNOW analytical spectra (for composition of synthetic spectra see text). Two SYNOW models are plotted having H detached (blue) or undetached (red). The spectrum has been corrected for absorption in the Galaxy and reported to the galaxy restframe. The most prominent absorptions are labelled. . . 129 3.47 Comparison between the optical spectrum of SN 2009bw at ∼67
days post explosion (JD 2454916.5) and two SYNOW analytical spectra. The difference between the SYNOW spectra is due to the presence of Ba I and Mg II ions (red). The spectrum has been corrected for absorption in the Galaxy and reported to the galaxy restframe. The most prominent absorptions are labelled. . . 130
LIST OF FIGURES
3.48 Zoom in the Hα region of the SN 2007od spectra at 90d (panel a), 310d b) and 337d c). The dotted line is the photospheric spec-trum on day 60 used as a comparison. Panels d) and e) show the [CaII] profiles at late epochs. The abscissa is in expansion velocity coordinates with respect to the rest frame positions of Hα and to the average position of the [CaII] doublet. Phases relative to the explosion (JD 2454404) are indicated on the right. . . 132 3.49 Comparison of the Hα profile of SN 2007od during the nebular
phase with those of SNe 1992H, 1999em and 2004et. The spectra of all SNe were reported to the same distance of SN 2007od. The position of the Hα rest wavelength is marked with a vertical dash. 136 3.50 Schematic illustration of the geometry of the newly formed dust
in SN 2007od. The CDS arise both inside the dense clumps and between the reverse shock and the discontinuity of the rarefied component of the CSM. . . 138 3.51 Comparison of the evolution of the main observables of SN 2007od
with the best-fit models computed with the semi-analytic code (total energy ∼ 0.5 foe, initial radius 4 × 1013cm, envelope mass 5
M⊙) and with the relativistic, radiation-hydrodynamics code (total
energy ∼ 0.5 foe, initial radius 7×1013cm, envelope mass 7.6 M ⊙).
Top, middle, and bottom panels show the bolometric light curve, the photospheric velocity, and the photospheric temperature as a function of time respectively. To estimate the photosphere velocity from observations, we used the value inferred from the Sc II lines (often considered in type II SNe good tracer of the photosphere velocity). . . 146
LIST OF FIGURES
3.52 Comparison of the evolution of the main observables of SN 2009bw with the best-fit models computed with the semi-analytic code (to-tal energy ∼ 0.3 foe, initial radius 3.6 × 1013 cm, envelope mass
8.3 M⊙) and with the relativistic, radiation-hydrodynamics code
(total energy ∼ 0.3 foe, initial radius 7×1013 cm, envelope mass 12
M⊙). Top, middle, and bottom panels show the bolometric light
curve, the photospheric velocity, and the photospheric temperature as a function of time, respectively. To estimate the photospheric velocity from the observations, we used the value inferred from the Sc II lines (often considered to be a good tracer of the pho-tosphere velocity in type II SNe). The dotted-purple line is the radiation-hydrodynamics model shifted by 1000 km s−1 to
repro-duce the data. . . 149 3.53 Zoom of the Hβ (left-hand panel) and Hα (right-hand panel)
spec-tral region during the plateau phase of SN 2009bw. The x-axes are in expansion velocity coordinates with respect to the rest-frame po-sitions of the lines, respectively. To guide the eye, two dash-dotted lines are drawn in the spectra corresponding expansion velocities, instead two blue dashed lines for each region, at comparable veloc-ities, follow the HV feature of the Balmer lines. The red spectrum is the NIR centered at He I λ10830. We have also reported the spectra of SN 2004dj (purple) and SN1999em (blue) for comparison.152 4.1 Synoptic view of the light curves of SN 1993ad in all available
bands. The magnitude shifts from the original value reported on Tab. 4.1 are in the legend. A zoom of the first days is also reported.159 4.2 R band image of SN 1995ad in NGC 2139 obtained with ESO
3.6m+EFOSC1 on December 29th, 1995. The sequence of stars in the field used to calibrate the optical magnitude of the 1995ad is indicated. . . 160 4.3 Synoptic view of the light curves of SN 1995ad in all available
bands. The magnitude shifts from the original value reported on Tab. 4.2 are in the legend. . . 161
LIST OF FIGURES
4.4 R band image of SN 1996W in NGC 4027 obtained with Dutch 0.9m on May 13th, 1996. The sequence of stars in the field used to calibrate the optical magnitude of the 1996W is indicated. . . . 164 4.5 Synoptic view of the light curves of SN 1996W in all available
bands. The magnitude shifts from the original value reported on Tab. 4.4 are in the legend. . . 165 4.6 Comparison of the dereddened colours of SN 1993ad, SN 1995ad
and SN 1996W with those SNe of the sample presented in Sec. 3. 166 4.7 Comparison of the dereddened colours of SN 1993ad, SN 1995ad
and SN 1996W with those SNe chosen in Sec. 3.3. The phase of SN 1987A is respect to the explosion date . . . 168 4.8 Comparison of quasi-bolometric light curves of our sample (SN 2007od,
SN 2009bw, SN 2009dd, SN 2007pk, SN 2010aj, SN 1993ad, SN 1995ad and SN 1996W) with those of other type II SNe. Minor misalign-ments in the epoch of maxima are due to the different epochs adopted for the maxima of the reference band light curve and the quasi-bolometric curve. . . 169 4.9 The overall spectra evolution of SN 1993ad. Wavelengths are in
the observer rest frame. The phase reported for each spectrum is relative to the explosion date (JD 2449297). The ⊕ symbol marks the positions of the most important telluric absorptions. The second and third are shifted upwards by 0.4 × 10⁻¹⁵; the other
spectra are shifted downwards with respect to the previous by 0.2× 10⁻¹⁵. . . 171
4.10 The overall spectra evolution of SN 1995ad. Wavelengths are in the observer rest frame. The phase reported for each spectrum is relative to the explosion date (JD 2449981). The ⊕ symbol marks the positions of the most important telluric absorptions. The second and third are shifted upwards by 1 × 10⁻¹⁵; the other
spectra are shifted downwards with respect to the previous by 0.7× 10⁻¹⁵. . . 173
LIST OF FIGURES
4.11 The overall spectra evolution of SN 1996W. Wavelengths are in the observer rest frame. The phase reported for each spectrum is relative to the explosion date (JD 2450180). The ⊕ symbol marks the positions of the most important telluric absorptions. The second is shifted upwards by 2 × 10⁻¹⁵; the other spectra
are shifted downwards with respect to the previous by 2.7 × 10⁻¹⁵
(third spectrum) and 1.4 × 10⁻¹⁵ erg s−1 cm−2 ˚A−1(others). . . . 175
4.12 Zoom of the 4600˚A(left-hand panel) and 6200˚A (right-hand panel) spectral region during the plateau phase of SN 1996W. The x-axes are in expansion velocity coordinates with respect to the rest-frame position of Hβ and Hα, respectively. To guide the eye, two dash-dotted lines are drawn in the spectra corresponding expansion velocities, instead two red dashed lines, at comparable velocities, follow the HV feature of the Balmer lines (∼11500 km s−1 ). The
blue dashed lines is tied to the second HV feature at ∼12500 km s−1
and visible only in the Hα region. . . 178 4.13 Expansion velocity of Hα, Hβ, HeI λ5876, FeII λ5169 and Sc II
λ6246 measured from the minima of P-Cygni profiles for SN 1993ad, SN 1995ad and SN 1996W. . . 179 4.14 Top: comparison of the Hα velocity of our SNe sample (all 8 SNe)
with those of other SN II. Bottom: Evolution of the continuum temperature of our SNe sample plus SNe 1999em, 2004et, 2005cs, 1992H. . . 180 5.1 CSM-ejecta geometry. View angles and observer directions are also
shown. . . 188 5.2 Early spectra of a typical SN IIP (SN 1999em), a SN IIP-pec (SN
2007od), and a SN IIn (SN 1998S). . . 190 5.3 Interaction between ejecta and an aspherical CSM after the early
LIST OF FIGURES
5.4 Distribution of core collapse SNe, with early interaction due to a close CSM, as function of viewing angle and CSM mass loss rate. Green refers to SNe IIP-pec, red to SNe IIn, and cyan to typical SNe IIP. . . 193
List of Tables
1.1 Results of the homogenous analysis of CC-SNe progenitors through
archival images obtained before the SN explosion. . . 21
3.1 Direct observations operated by the author during the observa-tional campaign of the SNe of the thesis. . . 43
3.2 Quantitative information about reduced data by the author. . . . 43
3.3 Main data of SN 2007od . . . 45
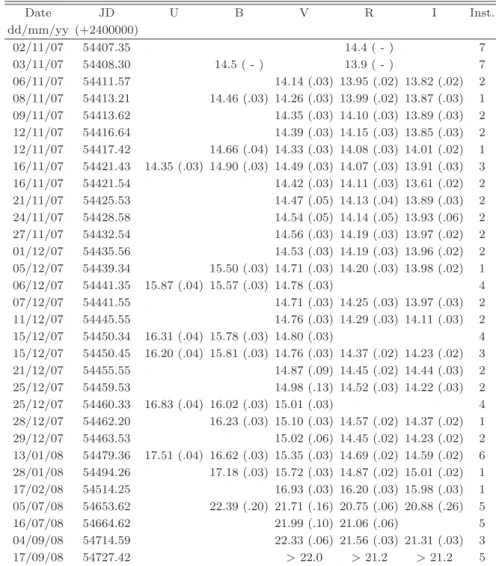
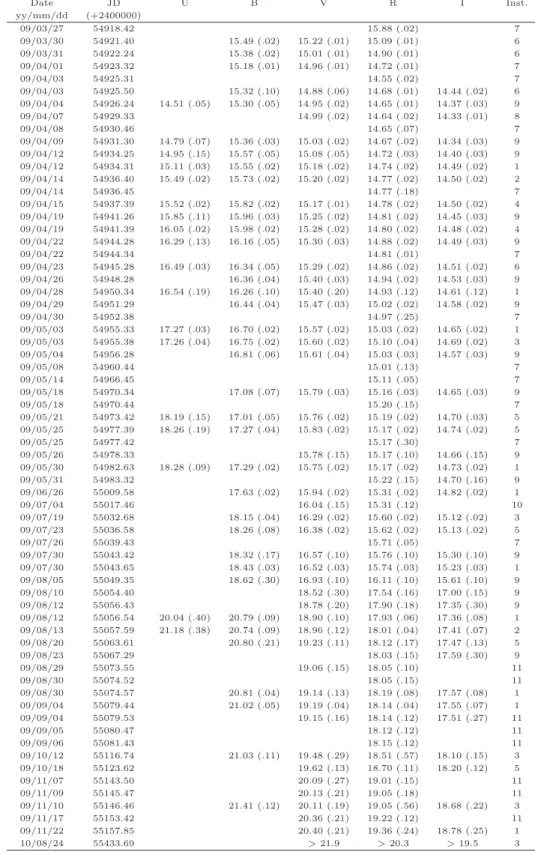
3.4 Ground-based UBVRI magnitudes of SN 2007od and assigned er-rors (in brackets). . . 47
3.5 Swift magnitudes of SN 2007od and assigned errors (in brackets). The UBV magnitudes have been corrected for the small systematic differences mentioned in the text. . . 48
3.6 JHK magnitudes of SN 2007od and assigned errors (in brackets). We accounted for both measurement errors and uncertainties in the photometric calibration. . . 50
3.7 Main data of SN 2009bw. . . 53
3.8 UBVRI magnitudes of SN 2009bw and assigned errors in brackets. 55 3.9 JHK’ magnitudes of SN 2009bw and assigned errors, we take into account both measurement errors and uncertainties in the photo-metric calibration. The measures have been taken at TNG. . . 57
3.10 Swift magnitudes of SN 2009bw and assigned errors. . . 57
3.11 Main data of SN 2009dd . . . 59
LIST OF TABLES
3.13 Swift magnitudes of SN 2009dd and assigned errors (in brackets). The UBV magnitudes have been corrected for the small systematic
differences mentioned in the text. . . 63
3.14 JHK’ magnitudes of SN 2009dd and assigned errors, we take into account both measurement errors and uncertainties in the photo-metric calibration. The measures have been taken at TNG. . . 63
3.15 Main data of SN 2007pk . . . 65
3.16 UBVRI magnitudes of SN 2007pk and assigned errors. . . 66
3.17 Swift magnitudes of SN 2007pk and assigned errors (in brackets). The UBV magnitudes have been corrected for the small systematic differences mentioned in the text. . . 67
3.18 Main data of SN 2010aj . . . 70
3.19 UBVRI magnitudes of SN 2010aj and assigned errors. . . 71
3.20 JHK magnitudes of SN 2010aj and assigned errors, we take into account both measurement errors and uncertainties in the photo-metric calibration. The measures have been taken at NTT. . . 71
3.21 Main parameters of type II SNe used in the comparisons with our SNe sample. . . 74
3.22 Observed black-body temperatures and expansion velocities of SN 2007od. 90 3.23 Observed blackbody temperature and photospheric velocities of SN 2009bw.parameters for SN 2009bw. For the Balmer lines the velocities were measured on the red wing component. . . 96
3.24 Observed black-body temperatures and expansion velocities of SN 2009dd. 99 3.25 Observed black-body temperatures and expansion velocities of SN 2007pk.102 3.26 Observed black-body temperatures and expansion velocities of SN 2010aj.105 3.27 Parameters of PHOENIX models of SN 2007od. . . 122
3.28 Evolution of the Hα line profile. . . 133
3.29 Main data of the SNe sample. . . 140
4.1 BVR magnitudes of SN 1993ad and assigned errors. . . 158
LIST OF TABLES
4.3 JHK magnitudes of SN 1995ad and assigned errors, we take into account both measurement errors and uncertainties in the
photo-metric calibration. The measures have been taken at ESO 3.6m. . 163
4.4 UBVRI magnitudes of SN 1996W and assigned errors. . . 164
4.5 Observed black-body temperatures and expansion velocities of SN 1993ad.172 4.6 Observed black-body temperatures and expansion velocities of SN 1995ad.174 4.7 Observed black-body temperatures and expansion velocities of SN 1996W.176 6.1 Main data of the SNe sample. . . 197
A.1 Magnitudes of the local sequence stars in the field of SN 2007od (cfr. Fig. 3.1). The r.m.s. of the measurements are in brackets. . . 203
A.2 Magnitudes of the local sequence stars in the field of SN 2009bw (cfr. Fig. 3.4). The errors are the r.m.s. . . 203
A.3 Magnitudes of the local sequence stars in the field of SN 2009dd (cfr. Fig. 3.6). The errors are the r.m.s. . . 204
A.4 Magnitudes of the local sequence stars in the field of SN 2007pk (cfr. Fig. 3.8). The errors are the r.m.s. . . 204
A.5 Magnitudes of the local sequence stars in the field of SN 2010aj (cfr. Fig. 3.10). The errors are the r.m.s. . . 205
A.6 Magnitudes of the local sequence stars in the field of SN 1995ad (cfr. Fig. 4.2). The errors are the r.m.s. . . 205
A.7 Magnitudes of the local sequence stars in the field of SN 1996W (cfr. Fig. 4.4). The errors are the r.m.s. . . 205
B.1 Journal of spectroscopic observations of SN 2007od. . . 207
B.2 Journal of spectroscopic observations of SN 2009bw. . . 207
B.3 Journal of spectroscopic observations of SN 2009dd. . . 208
B.4 Journal of spectroscopic observations of SN 2007pk. . . 208
B.5 Journal of spectroscopic observations of SN 2010aj. . . 208
B.6 Journal of spectroscopic observations of SN 1993ad. . . 209
B.7 Journal of spectroscopic observations of SN 1995ad. . . 209
1
Introduction
1.1
The Supernova event
The word Supernova has been coined by the astronomers Baade and Zwicky in 1934, referring to what appears to be a very bright new star shining in the celestial sphere and adding the suffix ”super” respect to the standard Nova ( it means ”new” in Latin) to distinguish the two events. The Novae are cataclysmic events, instead the Supernovae (hereafter SNe) are catastrophic events and the objects belonging to this class must have a magnitude < -14. With the impulse of Zwicky, a systematic search began and a large number of new SNe were discovered in the following years.
Now it is know that massive stars finish their life as SNe when the energy source produced by the nuclear reactions in the cores of the star is exhausted. SNe are powerful explosions that mark not only the final stage of single stars but also of compact stars in binary system. The SN explosion can completely destroy the star, like the thermonuclear SNe, or can leave a compact nucleus, like the core-collapse SNe (hereafter CC-SNe). In these explosions kinetic energies of ∼1051 ergs are released, although in the events produced by the gravitational
collapse of the nucleus, most energy escapes as neutrinos (Eν ∼1053 ergs, 99%
of the total energy). Only the 1% of energy is spent to eject matter at velocity of the order of ∼ 10000 km s−1. Despite the great energy only a factor of 10−4
of that is emitted in visible light. In our own Galaxy a Supernova (SN) event may even be visible in daylight. The interstellar medium (ISM) is enriched by
1.2 Supernovae classification
heavy elements synthesized by the star during its evolution and explosion. After a period of the order of decades post the explosion, Supernova Remnants (SNRs) are formed and drive the chemical evolution of the whole galaxy.
The role of SNe is not only related to the explosion of the stars itself, but is extremely important in the modern astrophysics because links several fields of research. The energy inputs of SNe influence the birth of new stars, compressing the ISM through their shocks. Also in the dust production have an important role, indeed they are one of the only two mechanisms known as responsible of dust creation. Moreover, SNe can be used in theoretical fields as probes of the stellar evolution, or in the case of the Galaxy CC-SNe as ”laboratory” to study the strong neutrino emission. In cosmology SNe are among the best tools as distance indicators or in the star formation history at redshift z >1 (z = (λobs−λemi)/λemi).
Recently has been discovered a link between the CC-SNe and the production of long duration γ-ray bursts (GRBs) that can lead to better understand these complex events.
In this Section has been introduced the event of Supernova, subsequently will point out the differences among the SN types, focusing on the objects described in this thesis: the type II SNe. The Chapter is organized as follows: in Sect. 1.2 we introduce the different SNe types and in Sect. 1.3 the general properties of the various types dedicating various subsections to each kind of SN. In Sect. 1.4 we describe the explosion mechanism of CC-SNe, instead in Sect. 1.5 we present some of open issues about the type II SNe. At least Sect. 1.6 describes the motivation and the outline of the thesis.
1.2
Supernovae classification
As written above, after the introduction of the SNe class, started a campaign to discover new SNe, this led in a brief period to collect a number of SNe (19 during the first systematic campaign by Baade and Zwicky) and cataloguing them trough the discovery year followed by a letter of the alphabet indicating the chronological order of the discovery. The first division, based on spectroscopic differences, had been made by Minkowski (153), who divided the SNe into two types, depending on the absence (type I) or presence (type II) of H lines in the
1.2 Supernovae classification
Figure 1.1: Schematic spectra of type Ia, Ib/c and II at maximum, tree weeks
and a year after maximum (236).
spectra. Subsequently Zwicky added other three categories (III, IV, V) that had H in the spectra and peculiar light curves. The last types were scarcely populated and had been generally included among type II SNe.
Thanks to the new discoveries in the 80’s a new classification scheme started to take shape. The classification is based on the early optical spectroscopy (cfr. Fig. 1.1,Turatto (236)) and divides the SNe into four main classes:
• SNe Ia: the spectra show Si II lines but not H I. This class correspond to the type SNe I by Minkovsky;
• SNe Ib: the spectra have not Si II or H I lines and are dominated by He I lines;
1.2 Supernovae classification
Figure 1.2: Comparison between photometric evolution (251) of SNe Ia and Ib/c
(left panel) and type II (right panel).
• SNe Ic: the spectra have not Si II and H I lines, despite the He I lines are really weak or absent. There is a general consensus that there is a continuos transition between this class and the class before;
• SNe II: the spectra show H I lines, that dominate at all epochs. This class correspond to the type II by Minkovsky.
Subsequently, thanks to the informations about the light curves (cfr. Fig. 1.2, Wheeler and Benetti (251)) and the late spectra, the classification has been re-fined introducing a few subclasses for the SNe II:
• SNe IIP: have light curve that after maximum show a period of almost constant luminosity, called plateau, lasting from a few weeks to more than 100 days;
• SNe IIL: show a linear, uninterrupted decline of luminosity after maximum. These classes (type IIP and IIL) were earlier proposed by Barbon, Ciatti, and Rosino (15);
• SNe IIb: photometrically analogies with SNe Ib/c, while spectra show strong H I lines for the first few weeks after the explosion. Later on, the spectra become dominated by He I lines, resemble that of SNe Ib. They are therefore the link between these two classes, supporting the idea that
1.3 General properties of Supernovae
SNe II and SNe Ib/c come form the same kind of progenitors and explosion mechanism;
• SNe IIn: show light curves declining very slowly. The spectra show blue continua with multicomponent emission lines lacking the broad P-Cygni absorptions typical of other types. Narrow emission lines, sometimes with P-Cygni profiles, are also visible on the top of the broader components. The large number of follow-up campaigns of SNe in the recent years and the improved observational capabilities and quality of the obtained data showed an unexpected diversity of SN properties. Individual objects can have properties in-termediate between two SN types, and an exact classification is not always trivial, e.g. SNe 1990aj, 1993R (236), 2001ic (93), 2006jc (142), 2008S (30) and 2008ha (243). Other SNe have behaviours different form previous classification scheme, like the Hypernovae, possibly associated with GRBs, whose spectra resembling SNe Ib/c show very broad P-Cygni features and overluminous light curves (162). In Fig. 1.3 is reported the current classification scheme from Turatto, Benetti, and Pastorello (234).
1.3
General properties of Supernovae
1.3.1
Supernovae Ia (Thermonuclear SNe)
Type Ia SNe have become very popular in the last decade because of their role in determining the geometry of the Universe with their high luminosity and rela-tively small luminosity dispersion at maximum. SNIa are discovered in all types of galaxies, also in ellipticals (13), and are not associated with the arms of spirals as strongly as other SN types (248).
It is believed that type-Ia SNe originate from the thermonuclear disruption of CO white dwarfs (WDs) in binary systems, which accrete mass via material trans-fer from companion stars (thus, SNe Ia are also called thermonuclear SNe). The material reinvigorates the WDs which, after to have reached the Chandrasekhar limit (1.4 M⊙), explode as SNe Ia. This occurs when the rate of accretion is
sufficiently fast, i.e. 10−6–10−9 M
1.3 General properties of Supernovae
1.3 General properties of Supernovae
fully understood. Two scenarios, in which the companion is a main sequence star or a degenerate star are still debated (163); furthermore, different mechanisms of explosion, as merging of two massive degenerate stars, has been considered to ex-plain extremely luminous SNe Ia, called ”Superchandra”, for what the progenitor was estimated to be 2.1 M⊙ (110, 119). However also the possible interpretation
with a Chandrasekhar mass model has been proposed (107).
The spectra are characterized by lines of intermediate mass elements such as Ca II, O I, Si II and S II during the peak phase and by the absence of H at any time (cfr. Fig. 1.1). With age metal lines as Fe and Co become prominents. The nebular spectra are dominated by strong [Fe II] and [Fe III] lines (cfr. Fig. 1.1). The spectra of a few SNe Ia appear to be significantly different form the average, especially in the strength of Si II lines.
The light curves of SNe Ia are relatively homogenous, even if important differ-ences among them have to be pointed out. Thanks to the use of the Cepheids as calibrators, for the absolute magnitude of a number of type Ia the average values founded ranging from MV=-19.34 to MV=-19.64 with small dispersion (91, 223).
It is also been observed (181) that the magnitudes at the B maximum in all bands are also correlated with the post maximum decline rate ∆m15
B. It is known that
the peak luminosity of SNe Ia is directly linked to the amount of radioactive56Ni
produced in the explosion (7, 8). Hence SNe Ia, having different magnitudes at maximum, are probably the result of the synthesis of different amounts of ra-dioactive 56Ni. Moreover, there are indications of large variances (up to a factor
2) in the total mass of the ejecta (36). Nevertheless, during the recent years, suggestion of significant differences among SNe Ia have been confirmed by new, high signal to noise data.
Based on the analysis of the photometric and spectroscopic properties of a sample of 26 objects Benetti et al. (22) have identified three subclasses of SNIa with distinct physical properties, the main characterizing parameter is the gradi-ent of expansion velocity of the photosphere. Faint SNe Ia (similar to SN 1991bg) are fast decliners both in luminosity and expansion velocity, have typically low expansion velocities and occur in early-type galaxies. High– (HVG) and low– velocity (LVG) gradient SNIa include normal objects, although the LVG group also includes all the brightest, slow declining SNe (like SN 1991T). Even if the
1.3 General properties of Supernovae
statistical analysis suggests that LVG and HVG are two distinct groups, they may possibly represent a continuum of properties. Indeed a recent analysis by Maeda
et al. (136) has brought new evidence on the possibility that the differences in the spectral evolution are related to an asymmetric explosion.
Other SNe Ia show anomalies as detection of an evanescent CSM around as for SN 2006X (178) and a strong circumstellar matter (CSM)–ejecta interaction with pronounced H emission lines as for SNe 2002ic and 2005gj (3, 93).
The study of the thermonuclear SNe is beyond the aims of this thesis.
1.3.2
Supernovae Ib/c
Type Ib and Ic appear only in spiral type galaxies (13) and have been associated with a parent population of massive stars, perhaps more massive than SNe II progenitors (248). It is believed that they are produced by the core-collapse of very massive stars which have been stripped, before the explosion, of their envelope of H (type Ib) or of both H and He (type Ic). Therefore, at some epoch of their evolution, they exhibit relatively strong radio emission with steep spectral indices and fast turn-on/turn-off, which is thought to arise from the SN shock interaction with the dense circumstellar medium (46, 47).
As written above, the characterizing spectral features of SNe Ib are the ab-sence of H and Si II lines and the preab-sence of He I. The excited levels of He producing such lines are thought to be populated by fast electrons accelerated by γ-rays from the decay of 56Ni and 56Co (133). It was soon recognized that
some objects did not show strong He lines (253) and the class of helium poor type Ic was proposed. Prominent lines in photospheric spectra of both SN types are: Ca II, O I, Na I, Fe II, Ti II. The nebular spectra are dominated by [O I] and [Ca II], but also Na I and Ca II are visible (see Fig. 1.1).
In order to investigate the physical differences between these two subclasses, the signatures of He were searched carefully in SNe Ic. The He I 10830 line in type Ic was first found in the spectra of SN 1994I (76). The He lines have expansion velocities much lower than other lines, indicating that the ejecta interacts with a dense shell of almost pure He originating from a stellar wind or mass transfer
1.3 General properties of Supernovae
to a companion. Helium has been unambiguously identified also in the spectra of other SNe Ic as SN 1999cq (141).
Weak absorption features attributed to Hα were first identified in the spectra of the SNe Ib 1983N and 1984L (252). Analyses of the spectra of a few other SNe Ib have suggested that detached H is frequently present in SNe Ib (31). The optical depths of H and He are not very high, so that modest differences in the He I line optical depths might transform type Ib into type Ic objects.
The SNe Ib/c are typically fainter than SNe Ia (at maximum, MB ∼18, with
a larger dispersion, 200, 251). The light curves of type Ib/c SNe have been divided in two groups depending on the luminosity decline rate (51). However, the suggestion that type Ic SNe include both fast and slow decliners while Ib seem to prefer slow decliners has been challenged by the existence of SNe Ib with fast light curves, e.g. SNe 1999I and 1991D.
Recently, SNe Ic have deserved large attention because of their relation to GRBs. Indeed, long-duration GRBs at sufficiently close distance have been re-lated to bright, highly energetic SNe Ic. The first SN associated with a GRB has been SN 1998bw related with GRB980425 and having broad–line SN Ic features (118). Other SNe with GRBs associated were discovered as SN 2003dh/GRB030329 (219), SN 2003lw/GRB031203 (140) and SN 2010bh/GRB100316. Detailed anal-ysis showed that these SNe require even more than 1052ergs, somewhat less in case
of asymmetric explosion, have exceptionally high expansion velocities (>30000 km s−1) and very luminous curves, justifying the introduction of the term
”Hy-pernovae” (118). They are believed to be the outcome of very energetic black hole forming explosions of massive stars (30-50 M⊙) which synthesize large amounts of 56Ni (0.3-0.5 M
⊙). Furthermore, there are a number of broad–line SNIc for which
an accompanying GRB has not been detected, e.g. SNe 1997ef (117), 2002ap (146), 2003jd (244). These SNe have a tendency to have smaller luminosity, mass of the ejecta and explosion energy than GRB–SNe but it is not clear whether the non-detection of the GRB is a geometric effect due to asymmetries or an intrinsic property of the explosion.
1.3 General properties of Supernovae
1.3.3
Supernovae IIb
A few objects have been found to have early time spectra similar to type II (i.e. with prominent H lines) and late time spectra similar to type Ib/c. For this reason they have been called type IIb SNe. The first discovered was SN 1987K (77), but the best studied example, and one of the best studied SNe ever, was SN 1993J in M81 (e.g. 14). In addition to SNe 1987K and 1993J, few other similar objects have been discovered (SNe 1996cb, 2001gd, 2001ig, 2008ax, 2008bo and 2011dx). While the early spectrum of SN 1993J was almost featureless with a blue continuum and broad H and He I λ 5876 lines typical of SN II, already three weeks later it displayed progressively stronger He I λλ 5876, 6678 and 7065 lines characteristic of SN Ib.
The light curve of SN 1993J was unusual with a narrow peak followed by a secondary maximum, recalling the behavior of SN 1987A if the time axis were reduced by a factor of four. After another rapid luminosity decline around 50 days past the explosion, the light curve settled into an almost exponential tail with a decline rate faster than normal SN II and similar to that of SN Ia, indicative of a small mass for the ejecta.
The progenitor stars of SNe IIb are expected to have lost most of their mass before explosion. This scenario is supported by a few observational properties: (1) the nebular spectra of SN 1993J show, at late time, Balmer emission lines of H with boxy profiles, consistent with the interaction with circumstellar material lost by the progenitor; (2) circumstellar gas in proximity to the exploding star was also revealed through the detection of narrow coronal lines persisting for a few days after the explosion (24, 179); (3) the luminosity evolution closely resembles that of SNe Ib, with a steep post-maximum decline rate typical of explosions with low mass ejecta.
1.3.4
Supernovae II
Type II SNe are characterized by the obvious presence of H in their spectra. They avoid early type galaxies (13), are strongly associated with regions of recent star formation (248) and are commonly related with the core collapse of massive stars (259). SNe II display a wide variety of properties both in their light curves
1.3 General properties of Supernovae
(180) and in their spectra (75) and represent core-collapse explosions occurring in progenitor stars still retaining the H envelopes. They are principally divided into two subclasses, on the basis of the shape of their optical light curves (15). SN IIL (Linear) and SN IIP (plateau) constitute the bulk of SN II and are often referred as normal SN II. Indeed the two classes are not separated and there are a few intermediate cases with short plateaus, e.g., SN 1992H (52).
The properties and mass of the progenitor star and the environment in which the SN explosion occurs are the main factors determining the display of SNe II, thus, modeling the observations helps to identify the progenitors. Another approach to this key issue is based on the direct detection of progenitor stars on high quality archive images obtained before the SN explosion (209).
SNe IIL are characterized by light curves showing a linear, uninterrupted de-cline of luminosity after maximum, probably because of the relatively low mass envelope. The absolute magnitude is similar to that of SNe Ib/c, even if with a slightly smaller scatter, as reported by Richardson et al. (200). From ∼50 days after the explosion the light curves settle onto an exponential decline: this behaviour is consistent with constant trapping of the energy release of the ra-dioactive decay of 56Co to 56Fe.
SNe IIP constitute a very heterogeneous class of CC SNe, whose light curves show different characteristics both in shape and luminosity at maximum. The average absolute magnitude at maximum of SNe IIP is fainter than that of SNe IIL, i.e. MB∼-17, but has a very large dispersion (σ=1.12, 200). After maximum,
the luminosity declines for a few days, until it reaches the plateau, a period of constant luminosity. This period is due to the recombination of the ionized matter. Depending on the envelope mass and explosion energy, this phase may be particularly long-lasting (∼100 days) or extremely short (∼20 days). After this, the light curve shows an evolutionary path similar to that of SNe IIL.
At nebular epochs the observed decline rate can be modified by two effects. The first one is the dust formation within the ejecta. The light at optical wave-lengths is absorbed by newly formed dust grains and re-emitted in the near infra-red (NIR). This makes to increase the opacity, and thus the luminosity decreases faster. A second effect may be caused by the presence of high density
circumstel-1.3 General properties of Supernovae
Figure 1.4: SNe II spectra at ∼3 months after explosion (95).
lar medium (CSM): if the SN environment is rich of material, this may interact with the fast ejecta, providing additional energy to the luminosity.
The spectra of both classes are dominated by the H Balmer lines (Fig. 1.4). He I lines are visible only for a few days after the explosion, then disappear and other lines (e.g. Na I, Ca II, Fe II, Sc II, Ba II) become prominent during the late photospheric phase. The nebular spectra show strong H I, [O I], Ca II, [Ca II] and [Fe II] emission lines. The absorption features in the photospheric spectra of plateau SNe are possibly stronger than those observed in the spectra of type IIL. The spectral and photometric behaviour of type IIL is consistent with the core-collapse explosion of moderately massive stars (8-10 M⊙), which eject
low-mass envelopes (1-2 M⊙, 33). The envelope masses are smaller than those ejected
by the SNe IIP, but larger than those of SNe IIb. A general scenario has been proposed in which common envelope evolution in massive binary systems with varying mass ratios and separations of the components can lead to various degrees of stripping of the envelope (164). According to this scenario the sequence of types IIP–IIL–IIb–Ib–Ic in Fig. 1.3 is ordered according to a decreasing mass of the envelope. SNe IIP are thought to be produced by the explosion of stars
1.3 General properties of Supernovae
spanning a large range of masses which probably did not suffer significant mass loss phenomena before the explosion. Therefore the study of SNe IIP, not affected by phenomena of ejecta-CSM interaction, provides important information on the nature of the progenitor stars.
Sometimes type IIL show radio emission attributed to interaction with a CSM, e.g. SN 1979C (157). Other SNe IIL that have shown interaction, due to the presence of a double P-Cygni profile or a flattening light curve in late stages, were SNe 1994aj, 1996L, 1996al, 2000P (23). These SNe show also a broadening of the spectral lines, and Hα flux unusually high.
1.3.5
Supernovae IIn
A number of peculiar SN II, larger with the pass of the years, have been grouped into the class of SN IIn (n denoting narrow emission lines, 206). The spectra of these objects have a slow evolution and are dominated by strong H Balmer emis-sion lines without the characteristic broad absorptions. The early time continua are very blue, He I emission is often present and, in some cases, narrow Balmer and Na I absorptions are visible corresponding to expansion velocities of about 1000 km s−1 (176). Unresolved forbidden lines of [O I], [O III] (two SNe at the
top of Fig. 1.4) and of highly ionized elements such as [Fe VII] and [Fe X] are sometimes present.
What we observe in these objects are the results of the interaction between ejecta and CSM, rather than the SN itself. The interaction of the fast ejecta with the slowly expanding, dense CSM generates a forward shock in the CSM and a reverse shock in the ejecta. The shocked material emits energetic radiation whose characteristics strongly depend on the density of both the CSM and the ejecta, and on the properties of the shock (44). Sometimes the pressure and temperature behind the shock are sufficiently high that the post-shock ejecta and CSM may become powerful X-rays emitters. At the same time synchrotron radiation is generated by electrons accelerated up to relativistic energies at the shock front. Thus the great diversity of observed SN IIn can provide clues to the different history of the mass-loss in the late evolution of progenitors. This source
1.3 General properties of Supernovae
of energy largely dominates (sometimes for many years) over the usual sources powering the energy output of other SN types.
As written above, late time signatures of interaction with a CSM are frequent also among type II SNe. Especially for the subclass of type IIn SNe, mass loss during the progenitor pre-explosion phase is a key parameter. In fact, the CSM structure, density and kinematics strongly affect both the SN spectroscopic and photometric evolution. Typical mass loss rates are in the order of 10−6–10−5
M⊙yr−1, but this value may change significantly, depending on several factors.
The density profile and the distance of the CSM play also a major role.
Despite the apparently complicated CSM configuration, the study of Hα multi-component profile is an information source about the kinematic and struc-ture of the gas surrounding the star both in pre- and post-explosion phase. Hα typically exhibits a narrow unresolved component (FWHM ∼ 200 km s−1)
super-posed on a base of intermediate width (FWHM ∼ 1000–3000 km s−1); sometimes a
very broad component (FWHM ∼ 5000–10.000 km s−1) is also present (75). The
extremely narrow feature can give us information about the kinematics of the unperturbed CSM released by the progenitor. Generally, the velocity span from ∼10 to ∼100 order of km s−1 and increase with progenitor mass: 10-20 km s−1for
AGB, 20-40 km s−1 for RSG and 100-200 for LBV winds (212). Studying the
intermediate component is possible retrieve informations about the kinematic of the slower, smaller radiating layer, having a velocity of a few hundreds of km s−1.
Instead the broadest component of a few thousand of km s−1is given by SN ejecta.
Broad components are seen also in emission lines of O III and Ca II, instead nar-row emission lines have been seen for Fe group lines (203), maybe caused by photoionization of the CSM by the UV flash (or X-ray photons produced during the initial flash).
The best studied object of this class is SN 1988Z, detected also in radio and X-rays (238). This object is considered the prototype of this class, although a common evolutionary path for these SNe does not really exist. SNe IIn are a het-erogeneous group of CC SNe whose properties are determined by the distribution of the CSM around the SN, the amount of material and its density. They are commonly brighter than SN IIP. More recently SN 1998S has been extensively studied also with the Hubble space Telescope (HST).
1.4 CC-SNe: physics of the explosion
1.4
CC-SNe: physics of the explosion
SNe II of all subclasses, SNe Ib/c and transitional SNe IIb introduced in the previous Sect. 1.3.2; 1.3.3; 1.3.4; 1.3.5, belong to the family of SNe produced by the gravitational collapse of the core of the star (CC-SNe). At the end of their evolution, massive stars may develop iron cores surrounded by shells of lighter element until the original H atmosphere.
The mass of the Fe core will continue to grow until it approximately reaches the Chandrasekhar mass. At this mass, electron degeneracy pressure can no longer withstand the gravitational forces and, consequently, the Fe core starts to contract. Due to electron captures in the Fe core, e−+ p → n + ν
e, the number of
electrons decreases and the pressure reduces accordingly. Furthermore, energetic photons in the core start to photo disintegrate Fe into α particles and baryons. The process is endothermic which remove the support of energy and pressure from the star, leading to its collapse. This process leads to the formation, generally, of a neutron star (NS) and, as consequence, a large amount of energy is released. The total energy liberated by the explosion is about 1053ergs. Most of this energy
is lost via neutrino escape, while about 1% is released as kinetic energy at the base of the envelope.
The passage of the shock-wave produced by the collapse through the inner layers of the star increases the temperatures, favouring the synthesis of iron peak elements. One of the most important elements in this phase is the radioactive
56Ni. This elements, that decays following the sequence 56Ni→56Co→56Fe, is
the main fuel powering the SN light curve at late phases (for exceptions see Sec. 1.3.4). When the shock-wave reaches the surface of the star (a few hours after the collapse), the SN becomes visible producing an UV burst which generates a narrow spike in the bolometric light curve (shock breakout).
After the shock breakout, the adiabatic expansion of the envelope causes a rapid decline of the temperature and luminosity, until the diffusion of internal energy from the bulk of the envelope and/or the contribution of the radioactive decays begin to become important, increasing the SN luminosity. In this phase the light curve reaches the optical maximum.
1.4 CC-SNe: physics of the explosion
Figure 1.5: Light curve of the well studied SN 1987A in V band. The main
process involved in shaping the light curve are also reported (128).
At this stage, the SN shock wave has already propagated through the enve-lope of the progenitor star redistributing the explosion energy through it. From this moment onward the envelope is essentially free-coasting and in homologous expansion.
As mentioned before as the SN expands and cools, the ionized matter begins to recombine. A recombination wave moves inward in mass through the ejecta, recombinating the hydrogen. The opacity goes to zero and the residual trapped internal energy can be released. This phase, whose duration depends on the envelope mass and the explosion energy, hence the expansion velocity, corresponds to the plateau in the SN IIP. During this phase the temperature remains constant. Once the H envelope is recombined, the envelope is transparent, the SN light curve settles into the exponential tail, during which the radioactive decay of56Co
represent the main energy source, and the luminosity decline is 0.098 mag/day as predicted by the decay. At this phase the luminosity depends on the amount of radioactive material ejected. Later other radioactive isotopes may also contribute to the luminosity (mainly57Co and44Ti).
1.4 CC-SNe: physics of the explosion
The complete sequence of process typical of the SN IIP light curve is visible in Fig. 1.5 for the case of SN 1987A which, because of its proximity, has been followed for long time, allowing us to observe the complete evolution of its light curve. It is also noticeable that at late time (∼4 years after the explosion) the emission of the circumstellar ring dominates over that of the ejecta.
In summary the physics behind the SN event is the same for all the core collapse, but the shape of the spectra and light curves depend mainly on the properties of progenitor star and the environment in which the SN explosion occurs.
The range of masses for the progenitors of CC-SNe is very large, from ∼8 to tens M⊙, sometimes also to hundred M⊙. From a theoretical point of view,
massive stars end their lives in the following manners (161):
• 8–10 M⊙ stars: These stars are on the AGB phase when the O+Ne+Mg core collapses due to electron captures. The exact mass range depends on the mass loss during the AGB phase. They undergo weak explosions being induced by neutrino heating. These stars produce little α-elements and Fe-peak elements, but are important sources of Zn and light p–nuclei. These AGB supernovae may constitute a sub-class of type IIn supernovae. The explosion might produce also a SN IIL.
• 10 - 90 M⊙ stars: These stars undergo Fe-core collapse to form either a neutron star (NS) or a black hole (BH), and produce large amounts of heavy elements from α-elements and Fe-peak elements. Observations have shown that the explosions of these Fe-core collapse supernovae are quite aspherical. In the extreme case, the supernova energy is higher than 1052 ergs s−1, i.e.
a Hypernova. Nucleosynthesis in these jet-induced explosions is in good agreement with the abundance patterns observed in extremely metal-poor stars. The resulting SN should appear as a type IIP (M< 35M⊙), IIb, Ib,
Ic in order of mass loss and explosion energy.
• 90 - 140 M⊙ stars: These massive stars undergo nuclear instabilities and associated pulsations (ǫ-mechanism) at various nuclear burning stages de-pending on the mass loss and thus metallicity. In particular, if the mass
1.5 CC-SNe: open issues
loss is negligible, pulsations of O-cores and/or Si-cores due to O, Si-burning could produce dynamical mass ejection. Eventually, these stars undergo Fe-core collapse.
• If the progenitor exceeds these ranges the SN mechanism is the pair insta-bility (PISN). The star is completely disrupted without forming a BH and thus ejects a large amount of heavy elements, especially Fe.
1.5
CC-SNe: open issues
In the previous Sections we have described the general phenomenology of CC-SNe and the physical scenario which overall accounts for the observations. Anyway, a very large array of open issues still remain to be clarified. Among these we list the following:
- Mass of progenitor. While the theoretical progenitors scenario is that described in Sect. 1.4, the observations of the progenitors of CC-SNe are all limited to stars with M < 17 M⊙, the so called RSG problem (cfr.
Sect. 1.5.1).
- Dust Formation. The observations of high-z objects calls for the produc-tion of large dust masses by massive stars while the observaproduc-tion of nearby SNe indicate much lower amounts of produced dust (cfr. Sect. 1.5.2). - Ejecta CSM interaction. In addition to the above mentioned SNe IIn,
there is now evidence for ejecta CSM interaction by many types of SNe (cfr. Sect. 1.5.3).
- Use of Core Collapse SNe as distance indicators. CC-SNe are very heterogenous but there are ways to exploit also these SNe for measuring the distances in ways completely independent from thermonuclear SNe, e.g. with the Expanding Photosphere Method (EPM) (207) or the Spectral-tting Expanding Atmosphere Method (SEAM) (18).
1.5 CC-SNe: open issues
- Existence of pair Production SNe. In the last years very peculiar SNe characterized by bright and broad light curves have been discovered (e.g. 2007bi, 2006jc; 83, 178, respectively). These have been associated to Pair Production SNe but the issue is still open.
- Very faint SNe or SNe impostor. Recently, thanks to the“SNe search” surveys, have been identified an increasing number of SN imposters of un-known physical origin. These may be ultra-faint SNe, luminous blue vari-able (LBV) eruptions, or other types of proposed exotic eruptive varivari-ables (such as stellar mergers). A subset of them have absolute magnitudes be-tween −12 and −14, narrow hydrogen emission line spectra and red colours. The debate on their nature is highlighted by the invocation of new labels, and associations with previously known transient phenomena: luminous red novae, Intermediate luminosity transients, giant eruptions of LBVs, faint core-collapse SNe. As the diversity of these labels suggest, their nature is a complete mystery.
- Faint SNe and black hole formation. Some theoretical models (e.g. 105) suggest that massive stars may generate very faint SNe, with much of the radioactive56Ni falling back onto a black hole. Indeed there may be no
visible explosion at all.
- Ultra bright type I SNe. They are remarkably bright (Mu ≃ −22) and
are all associated with very faint host galaxies (typically Mg > −17). The
spectral evolution links this family of transients to Wolf-Rayet progenitors, and also to the broad lined type Ic SNe which are associated with gamma-ray bursts (GRBS). However a major puzzle is that the enormous luminosity at peak cannot be powered by radioactive56Ni, which is the canonical energy
source for SNe Ic emission.
In this thesis we will focus mainly on type II–IIP SNe more luminous than common and that show phenomena of interaction between ejecta and CSM, even if sometimes these phenomena are hidden and do not appear clearly to a fast analysis. In the following, we shortly describe a few important topics related to this thesis.
1.5 CC-SNe: open issues
1.5.1
Progenitor Masses
One of the key issue of CC-SNe is the mass of the exploding stars. The classical approach is to model the observations in order to obtain information about the progenitor star. In the last decade, a different approach has been also introduced based on the direct detection of the progenitor star of CC-SNe on high quality archive images obtained before the explosion (209, 210, 245). The detection of the progenitor (or measurement of upper magnitude limits) on images obtained with different filters allows to estimate the absolute luminosity and the colour of the candidate progenitor and hence, from theoretical evolutionary tracks, to infer its mass. Tab. 1.1 summarizes the status of these direct mass determinations.
With reference to the topic of this thesis, it is interesting to note that the de-tected progenitors of IIP have masses between 8 and 15 M⊙ (cfr. Tab. 1.1). The
issue is generally known as the ”Red Supergiant problem” (209, 210). Indeed the observed distribution has been fitted with a Salpeter IMF, a minimum mass of mmin = 8.5+1−1.5 M⊙, and a maximum mass of mmax = 16.5±1.5 M⊙. Comparing
this to the Local Group massive stellar populations immediately raises the ques-tion of the lack of detected RSG progenitors with initial masses between 17–30 M⊙. Many possible explanations have been proposed (210), but given the recent
works on the initial masses of the progenitors of CC-SNe as Smith et al. (211) seems that the problem could not exist at all.
1.5.2
Dust
Another major issue related to SNe II is whether core-collapse SNe could be major contributors to the universal dust budget.
Already 40 years ago it has been suggested that SNe could be an important source of dust in the interstellar medium (ISM) (41, 109). This has been partly due to the fact that, given the large amounts of dust produced in the winds of low-mass stars in the local Universe, the possibility that SNe might produce significant dust was not widely explored (cfr. 121). However, evidences in favor of enormous amounts of dust (& 108 M
⊙) in galaxies at high redshifts (z&6) have
been found: millimetric observations of the most distant quasars (25), obscuration by dust of quasars in damped Ly-α systems (DLAs) (183) and measurements of
1.5 CC-SNe: open issues
Table 1.1: Results of the homogenous analysis of CC-SNe progenitors through
archival images obtained before the SN explosion.
SN name SN type Host Galaxy Progenitor Mass Reference (M⊙)
1980K IIL NGC 6946 < 18 2
1987A II pec LMC 20 e.g. 3
1993J IIb M81 13-22 4 1997bs IIn M66 >20-30 5 1999an II IC755 < 18 1 1999br IIP NGC 4900 < 15 1 1999em IIP NGC1637 < 15 1 1999ev IIP NGC 4274 16+6−4 1 1999gi IIP NGC 3184 < 14 1 2001du IIP NGC 1365 < 15 1 2002hh IIP NGC 6946 < 18 1 2003gd IIP NGC 628 7+6−2 1 2003ie II? NGC 4051 < 25 1 2004A IIP NGC 6207 7+6−2 1 2004am IIP NGC 3034 12+7−3 1 2004dg IIP NGC 5806 < 12 1 2004dj IIP NGC 2403 15±3 1 20004et IIP NGC 6946 9+5−1 1 2005cs IIP NGC 5194(M51) 7+3−1 1 2006bc IIP NGC 2397 < 12 1 2006my IIP NGC 4651 < 13 1 2006ov IIP NGC 4303 < 10 1 2007aa IIP NGC 4030 < 12 1 2008bk IIP NGC 7793 9+4−1 1 2008cn II NGC 4603 15±2, .14 6 2009kr IIL NGC 1832 18-24 7 2009hd IIL NGC 3627(M66) < 20 8 2011dh IIP NGC 5194(M51) 13±3 9
1.5 CC-SNe: open issues
metal abundances in DLAs (185). The existence of large amounts of dust when the Universe was relatively young poses problems for the low-mass star origin of dust, since the main-sequence evolution timescales of these stars (up to 1Gyr) begin to become comparable to the age of the Universe. SNe arising from short-lived population III stars could be a viable alternative.
Recently studies on the origin of dust (60, 166, 229) have supported this view, calling for core-collapse SNe as a major source of dust in the Universe. In fact a number of nearby objects have shown clear evidence of dust formation, e.g. the type IIn SNe 1998S (90, 193), 1995N (89), and 2005ip (79), the type IIP SNe 1999em (68), 2004et (121, 139) and 2004dj (226), the type IIb SN 1993J (89), and the peculiar SN 1987A (5, 134), SN 2006jc (142) and SN 2008S (30).
However, the amount of dust produced by these SNe is highly variable and uncertain. Pozzo et al. (193) evaluated a dust mass of ∼10−3M
⊙ in the type
IIn SN 1998S. For the type IIP supernova SN 1999em, Elmhamdi et al. (68) obtained a lower limit to the dust mass of just 10−4M
⊙. In the case of the type II
SN 2003gd the MIR flux at about 16 months was consistent with emission from just 4×10⁻⁵M
⊙ of newly condensed dust in the ejecta (150).
Another channel to obtain informations about dust formation in SNe envi-ronment is via the study of supernova remnants (SNRs). Studies based on three young SNRs reveal dust masses that vary by roughly two orders of magnitude: no more than 8×10⁻⁴M
⊙of dust at ∼120 K associated with one of the remnant have
been found by Stanimirovi´c et al. (220), for the other two remnants Sandstrom et
al.(204) and Rho et al. (199) derive dust masses of 3×10⁻³M
⊙at about 70 K and
10×10−2M
⊙ of dust at ∼60 K. Estimates for the Crab and Keplers SNRs based
on Spitzer MIR data are similar, with 10−3–10−4M
⊙ of dust (227) and 3×10⁻³M⊙
at ∼85 K (27), respectively. Thus, the bulk of MIR/FIR studies of SNRs yield dust masses which are at least a factor of 10 less than the minimum required to account for the high-redshift dust. It is possible that most of the SNR dust is very cold (.30 K) and hence has escaped detection in these studies. Attempts have been made to detect very cold dust using sub-mm measurements of the Cas A and Kepler SNRs. Observations using SCUBA led (62) to claim that at least 2 M⊙ of dust formed in the supernova, with their model including a dust