A mia Madre e mio Fratello,
per l
'
affetto ed il sostegno che ogni giorno
mi dispensano nonostante la mia testa dura
A tutti i miei Angeli Custodi,
perché continuino a guidarmi dall
'
alto
tra le mille difficoltà della vità
Alla Nuova Arrivata in famiglia,
perché impari presto a camminare sulle
proprie gambe e pensare con la propria testa
A me stesso,
perché possa sempre affrontare con
passione tutto ciò che la vita avrà da offrire
\àËá t _ÉÇz jtç àÉ à{x gÉÑ AAA
(AC/DC)V|´ v{x ÇÉÇ v| âvv|wx? v| ÜxÇwx Ñ|∞ yÉÜà|A
(Friederich Nietzsche)câÉ| w|ÅxÇà|vtÜx v|´ v{x {t| |Ç ÅxÇàx?
Åt Åt| v|´ v{x {t| ÇxÄ vâÉÜxA
(The Author)L
IST OF
T
ABLES
C
HAPTER1
Table 1.1 – Main steps of Methane Steam Reforming. ... 28
Table 1.2 – Main reactions involved in the coal gasification... 39
Table 1.3 – Effect of O2 composition in feed air on the composition of gas produced in coal gasification. ... 40
Table 1.4 – Relative adsorption strength of the most common impurities. UOP 3111 [1.13]. ... 47
C
HAPTER2
Table 2.1 – Advantages of the supported membranes with respect to the self-supported ones. ... 62C
HAPTER3
Table 3.1 – Permeation elementary steps of the present model and comparison with the one of Ward and Dao [3.1].. 47Table 3.2 – Operating conditions considered in the simulation... 88
Table 3.3 – Geometrical data of the Pd-alloy supported membrane considered in the simulation... 102
Table 3.4 – Physical and kinetic constants of the model. Data taken from open literature... 103
Table 3.5 – Operating conditions considered by Ward and Dao [3.1] in their simulations... 117
Table 3.6 – Correlation parameters for the calculation of Ωμ and ηi. ... 123
Table 3.7 – Parameters of the correlation for Ωμ and Dij calculation. ... 124
C
HAPTER4
Table 4.1 – The most common definitions of concentration polarization coefficient in open literature... 136Table 4.2 – Limit values of CPC as defined in the present analysis. ... 138
Table 4.3 – Operating conditions for the simulation. ... 141
C
HAPTER5
Table 5.1 – Permeation law parameters from Roy [5.13]. ... 167
Table 5.2 – Catalyst geometrical data used in the calculation [5.17]. ... 171
Table 5.3 – Factors used to analyze the performances of the reactors considered here. ... 173
Table 5.4 – Operating conditions. ... 175
Table 5.5 – Geometrical data of the system. ... 175
Table 5.6 – Optimal lengths' distribution for the maximum conversion compared with the equi-sized case. The letters "R" and "P" indicate "Reactive" and "Permeative" stage, respectively... 181
Table 5.7 – Comparison among the CH4 conversions in the different membrane reactors... 182
Table 5.8 – Optimal lengths' distribution for the maximum RF compared with the equi-sized case. The letters "R" and "P" indicate "Reactive" and "Permeative" stage, respectively. ... 186
Table 5.9 – Comparison between x and RF in the different cases considered. δPd-layer = 1 μm and TFur = 600°C. The values in parentheses are differences in percentage with respect to the values of MR. ... 190
Table 5.10 – Power exchanged between furnace and retentate for the distributions considered. δPd-layer = 1 μm, TFur = 600°C. The values in parentheses are differences in percentage with respect to the value of MR. ... 190
Table 5.11 – Permeation law parameters from Tong et al. [5.16]. ... 194
Table 5.12 – Operating conditions. ... 196
Table 5.13 – Geometrical data of the system. ... 196
Table 5.14 - Optimal lengths distribution for the maximum conversion criterion in co- and counter-current flow. The letters "R" and "I" indicate "Reactive" and "Inert" stages, respectively... 201
Table 5.15 - Optimal lengths distribution for the maximum RY criterion in co- and counter-current flow. The letters "R" and "I" indicate "Reactive" and "Inert" stages, respectively... 205
Table 5.16 – Operating conditions. ... 214
Table 5.17 – Equilibrium constants and kinetic parameters for methane steam reforming ... 229
Table 5.18 – Adsorption parameters for methane steam reforming... 230
L
IST OF
F
IGURES
C
HAPTER1
Figure 1.1 – Scheme of raw materials and the respective hydrogen production processes... 26
Figure 1.2 – Scheme of the main steps of the MSR process. ... 29
Figure 1.3 – Scheme of the Dusty Cloud Reactor for chemical-solar reactions. The concentrated solar radiations are absorbed directly by aero-sol particles suspended in an appropriate gas. ... 35
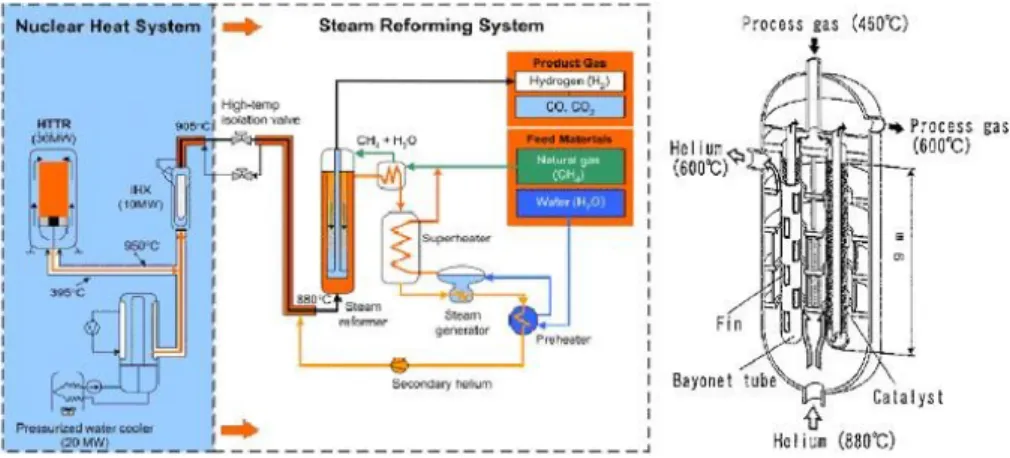
Figure 1.4 – Scheme of the JAERI plant for nuclear steam reforming and the corresponding reformer... 41
Figure 1.5 – Scheme of the thermo-chemical hydrogen production based on the I-S cycle... 44
Figure 1.6 – Operating principle of the PSA. UOP 3111 [1.13]. ... 46
Figure 1.7 – Effect of the operating pressures on the PSA process. UOP 3111 [1.13]. ... 47
Figure 1.8 – Hydrogen recovery as function of the hydrogen purity. UOP 3111 [1.13]... 48
Figure 1.9 – Scheme of a cryogenic process for hydrogen purification. UOP 3111 [1.13]. ... 50
Figure 1.10 – Typical performance relation of the cryogenic processes. UOP 3111 [1.13]... 51
Figure 1.11 – Example of integrated process for hydrogen separation [1.13]... 52
C
HAPTER2
Figure 2.1 – General scheme of a membrane separation process. ... 55Figure 2.2 – Phase diagram of the H-Pd system [2.3]... 63
Figure 2.3 – State diagram of the H-Pd system... 65
Figure 2.4 – Palladium inhibition degree by CO as function of CO concentration and temperature. ... 67
Figure 2.5 – Minimum thickness obtainable by means of several deposition techniques... 69
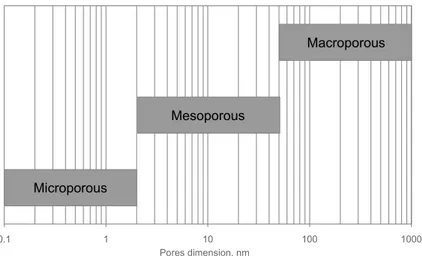
Figure 2.6 – Classification of the porous membranes according to the dimension of the pores... 77
Figure 2.7 – Comparison between the characteristic dimensions of some zeolites and kinetic molecular diameters of some chemical species. ... 79
C
HAPTER3
Figure 3.1 – a) Example of a multilayered Pd-based membrane (adapted from Höllein et al. [3.9]. b) Scheme of the multilayered membrane considered here. c) Mass transfer mechanisms of all the elementary steps involved in the permeation process... 90 Figure 3.2 – Scheme of the strategy adopted for the numerical solution of the model... 101 Figure 3.3 – Calculated hydrogen partial pressure profiles through the membrane and in the fluid phases adjacent to the membrane for different temperatures in laminar regime at δPd-layer = 1 μm. The lengths of the permeation steps are
not to scale. See Table 3.2 for the other operating conditions. ... 104 Figure 3.4 – Relative resistance of each permeation elementary step as a function of temperature in laminar flow conditions (see Table 3.2). δPd-layer = 1 μm. The non-reported steps do not provide any appreciable contribution... 106
Figure 3.5 – Calculated hydrogen partial pressure profiles through the membrane and in the fluid phases adjacent to the membrane for different temperatures in laminar regime at δPd-layer = 10 μm. The lengths of the permeation steps are
not to scale. See Table 3.2 for the other operating conditions. ... 107 Figure 3.6 – Relative resistance of each permeation elementary step as a function of temperature in laminar flow conditions (see Table 3.2). δPd-layer = 10 μm. The non-reported steps do not provide any appreciable contribution... 108
Figure 3.7 – Calculated hydrogen partial pressure profiles through the membrane and in the fluid phases adjacent to the membrane for different temperatures in turbulent regime at δPd-layer = 1 μm. The lengths of the permeation steps are
not to scale. See Table 3.2 for the other operating conditions. ... 109 Figure 3.8 – Relative resistance of each permeation elementary step as a function of temperature in turbulent flow conditions (see Table 3.2). δPd-layer = 1 μm. The non-reported steps do not provide any appreciable contribution... 110
Figure 3.9 – Calculated hydrogen partial pressure profiles through the membrane and in the fluid phases adjacent to the membrane for different temperatures in turbulent regime at δPd-layer = 10 μm. The lengths of the permeation steps
are not to scale. See Table 3.2 for the other operating conditions... 111 Figure 3.10 – Relative resistance of each permeation elementary step as a function of temperature in turbulent flow conditions (see Table 3.2). δPd-layer = 10 μm. The non-reported steps do not provide any appreciable contribution... 112
Figure 3.11 - Step-limited fluxes (dashed lines) and overall resulting flux (continuous line) as functions of temperature in laminar conditions. δPd-layer = 1 μm. The fluxes corresponding to the non-reported steps are very high and, thus, are
not shown. See Table 3.2 for the other operating conditions. ... 113 Figure 3.12 – Step-limited fluxes (dashed lines) and overall resulting flux (continuous line) as functions of temperature in turbulent conditions. δPd-layer = 1 μm. The fluxes corresponding to the non-reported steps are very high and, thus, are
not shown. See Table 3.2 for the other operating conditions. ... 115 Figure 3.13 – Hydrogen flux as a function of temperature for two Pd-based thicknesses and flow regimes. See Table 3.2 for the other operating conditions... 116 Figure 3.14 – Comparison between the simulation results of the present model and those obtained by Ward and Dao in the same operating conditions (see Table 3.5)... 118
Figure 3.15 – Comparison with some literature experimental data. The values of kinetic parameters used for simulation are that reported in Table 3.4... 120 Figure 3.16 – Resistances of permeation steps calculated by the present model for the experimental system of Dittmeyer et al. [3.4]. PFeed = 255 kPa. The non-reported steps do not provide any appreciable contribution. ... 121
C
HAPTER4
Figure 4.1 – Schematic representation of hydrogen permeation in a generic point of a tube-in-tube permeator (Figure 4.2). The solid and dashed lines indicate the forward and backward permeation case, respectively. The profiles are intended to be those of the hydrogen partial pressure, even in the membrane, where the concentration of the atomic hydrogen is expressed in terms of equivalent pressure. ... 134 Figure 4.2 – Scheme of a Pd-based membrane permeator in tube-in-tube configuration. The element of the equipment indicated by "dz" identifies the target volume used in Figure 4.1 for the mass transport analysis... 135 Figure 4.3 – Hydrogen permeating flux and both permeances (of bulk and membrane) as a function of the H2 molar
fraction in mixture for different membrane thicknesses at 500°C. The thicker arrows at 1 and 5 μm indicate the separation paths. PMixture = 1000 kPa and PPure = 200 kPa, Re ≈ 5200. ... 144
Figure 4.4 – Concentration polarization coefficient (CPC) as a function of H2 permeance of bulk and membrane for
different membrane thicknesses and hydrogen molar fractions in mixture. The thicker arrows at 1 and 5 μm indicate the separation paths. PMixture = 1000 kPa and PPure = 200 kPa, Re ≈ 5200. ... 144
Figure 4.5 – CPC as a function of the H2 molar fraction in mixture for different temperatures and membrane
thicknesses. The temperatures at higher thicknesses are the same as for 1 μm in the same order. The thicker arrows at 1 and 5 μm indicate the separation paths. Re ≈ 5200. ... 146 Figure 4.6 – CPC as a function of the H2 molar fraction in mixture for different total pressures of mixture and
membrane thicknesses. The total pressures for the higher thicknesses are the same as for 1 μm in the same order. The thicker arrows at 1 and 5 μm indicate the separation paths. Re ≈ 5200. ... 148 Figure 4.7 – Polarization maps as a function of the H2 molar fraction mixture for different total pressures of pure H2 and
membrane thicknesses. The thicker arrows at 1 and 5 μm indicate the separation paths. Re ≈ 5200... 149 Figure 4.8 – Polarization maps as a function of the H2 molar fraction in mixture for different Reynolds' number and
membrane thicknesses at 500°C, PMixture = 1000 kPa and PPure = 200 kPa. The intermediate curves between 2100 and
8000 for 15, 50 and 100 μm correspond to the same values of Re as indicated in the case of 5 μm. ... 151 Figure 4.9 – Normalized hydrogen permeating flux as a function of the H2 molar fraction in mixture for different
Reynolds' number and membrane thicknesses at 500°C, PMixture = 1000 kPa and PPure = 200 kPa. Each flux reference
value by which the normalization is made is reported in the respective plots. The curves at 15, 50 and 100 μm correspond to the same values as indicated at 5 μm. ... 152 Figure 4.10 – Comparison between the results obtained from the present model and some experimental data taken from literature [4.5] in terms of hydrogen permeating flux. The values of CPC for the experimental system are calculated by the present model. The experimental data are appropriately re-elaborated. ... 154
C
HAPTER5
Figure 5.1 – Scheme of the Permeative Stage Membrane Reactor (PSMR) considered... 163
Figure 5.2 – Scheme of the Membrane Reactor (MR) and Traditional Reactor (TR). ... 164
Figure 5.3 – Sketch of the generic spherical catalytic pellet considered for the effectiveness factor evaluation. ... 169
Figure 5.4 – Comparison between the model and some experimental data from Tong et al. [5.16]. ... 172
Figure 5.5 – Partial pressure profiles of some of the species involved in the process at TFur = 600°C and δPd-layer = 1 μm with an equi-sized reactive and permeative stages. The other operating conditions are specified in Table 5.4. The vertical dashed-lines show the boundaries of each stage. The letters "R" and "P" respectively indicate "Reactive" and "Permeative" stage and the subscripts are the progressive numbers of the stage... 176
Figure 5.6 – Temperature profiles at TFur = 600°C and δ Pd-layer = 1 μm with an equi-sized reactive and permeative stages. The other operating conditions are specified in Table 5.4. The vertical dashed-lines show the boundaries of each stage. The letters "R" and "P" respectively indicate "Reactive" and "Permeative" stage and the subscripts are the progressive numbers of the stage... 177
Figure 5.7 – CH4 conversion profiles at TFur = 600°C for different values of δ Pd-layer with an equi-sized catalyst and membrane distribution. The other operating conditions are specified in Table 5.4... 178
Figure 5.8 – RF profiles at TFur = 600°C for different values of δ Pd-layer with an equi-sized catalyst and membrane area distribution. The other operating conditions are specified in Table 5.4. ... 179
Figure 5.9 – Shape of the optimal distributions with maximized conversion for several membrane thicknesses at TFur = 600°C. The other operating conditions are specified in Table 5.4. ... 180
Figure 5.10 – CH4 conversion profiles at TFur = 600°C for different values of δPd-layer with the catalyst and membrane area distribution optimized with respect to the maximum conversion. The other operating conditions are specified in Table 5.4... 181
Figure 5.11 – Comparison among the CH4 conversion of a PSMR (with the catalyst and membrane area distribution optimized with respect to the maximum conversion), MR and TR as function of δPd-layer and TFur. The other operating conditions are specified in Table 5.4... 182
Figure 5.12 – RF profiles at TFur = 600°C for different values of δPd-layer with the catalyst and membrane area distribution optimized with respect to the maximum conversion. The other operating conditions are specified in Table 5.4... 183
Figure 5.13 – Comparison among the profiles of several optimal distributions by imposing the maximum conversion criterion. δPd-layer = 1 μm and TFur = 600°C. The other operating conditions are specified in Table 5.4. ... 184
Figure 5.14 – Profiles of x and RF in PSMR calculated by imposing the maximum and minimum conversion, respectively. TFur = 600°C, δPd-layer = 1 μm. The other operating conditions are specified in Table 5.4... 185
Figure 5.15 – Shape of the optimal distributions with maximized recovery factor for two membrane thicknesses at TFur = 600°C. The operating conditions are specified in Table 5.4... 186
Figure 5.16 – Profiles of x for different values of δPd-layer with the catalyst and membrane area distribution optimized with
respect to the maximum RF. TFur = 600°C. The other operating conditions are specified in Table 5.4. ... 187
Figure 5.17 – Profiles of RF for different values of δPd-layer with the catalyst and membrane area distribution optimized
with respect to the maximum RF. TFur = 600°C. The remaining operating conditions are specified in Table 5.4... 187
Figure 5.18 – Comparison among the performances of PSMR and MR. δPd-layer = 1 μm, TFur = 600°C. The dashed lines
indicate the MR values. The remaining operating conditions are specified in Table 5.4. ... 188 Figure 5.19 – Comparison among the performances of PSMR for which adiabatic permeative stages are considered and MR. δPd-layer = 1 μm, TFur = 600°C. The dashed lines indicate the MR values. The remaining operating conditions
are specified in Table 5.4. ... 189 Figure 5.20 – Hydrogen permeate molar flow rate for the PSMR (in the two optimization criteria considered) and MR at TFur = 600°C for all the δPd-layer considered. The other operating conditions are specified in Table 5.4. ... 191
Figure 5.21 – Scheme of the Staged Membrane Reactor (SMR) considered... 192 Figure 5.22 – Scheme of a Staged Traditional Reactor (STR) with the same catalyst distribution as the SMR shown in Figure 5.21. ... 193 Figure 5.23 – H2 and H2O (permeate only) partial pressure profiles along the reactor length in the reference
configuration in a) co- and b) counter-current flow. The arrows indicate the versus of the stream flow. The operating conditions are specified in Table 5.12... 197 Figure 5.24 – a) Hydrogen permeation driving force and b) transmembrane flux profiles (positive from reaction to permeation side) along the reactor length in the reference configuration in co- and counter current flow. The operating conditions are specified in Table 5.12... 198 Figure 5.25 – Conversion profiles along the reactor length in the reference configuration in co- and counter-current flow. The operating conditions are specified in Table 5.12. ... 199 Figure 5.26 – Reactor performances in terms of RY, RF and x in co- and counter-current flow in the reference catalyst distribution. The conversion of the corresponding staged TR is also reported for comparison in both the flow configurations. The operating conditions are specified in Table 5.12. ... 200 Figure 5.27 – Shape of the optimal distributions with maximized conversion. The operating conditions are specified in Table 5.12... 201 Figure 5.28 – H2 and H2O partial pressure profiles along the reactor length for the distribution obtained from the
maximization of the CH4 in a) co-current and b) counter-current flow. The arrows indicate the versus of the stream flow.
The operating conditions are specified in Table 5.12. ... 202 Figure 5.29 – Conversion profiles along the reactor length for the catalyst distribution obtained by maximizing conversion in co- and counter-current. The operating conditions are specified in Table 5.12... 203 Figure 5.30 – Temperature profiles along the reactor length for the catalyst distribution obtained from the maximization of the CH4 conversion in a) co- and b) counter-current flow. The arrows indicate the versus of the stream flow. The
Figure 5.31 – Reactor performances in terms of RY, RF and x in co- and counter-current flow for the catalyst distribution obtained from the maximization of x. The conversion of the corresponding staged TR is also reported for comparison in both the flow configurations. The operating conditions are specified in Table 5.12. ... 204 Figure 5.32 – Shape of the optimal distributions with maximized recovery yield. The operating conditions are specified in Table 5.12... 206 Figure 5.33 – H2 partial pressure profiles along the reactor length on both the membrane sides for the distribution
obtained from the maximization of RY in a) co- and b) counter-current flow. The arrows indicate the versus of the stream flow. The operating conditions are specified in Table 5.12... 207 Figure 5.34 – a) Hydrogen permeation driving force and b) transmembrane flux profiles along the reactor length for the catalyst distribution obtained from the maximization of RY in co- and counter-current flow. The operating conditions are specified in Table 5.12. ... 207 Figure 5.35 – Conversion profiles for the catalyst distribution obtained from the maximization of RY in co- and counter-current flow. The operating conditions are specified in Table 5.12. ... 208 Figure 5.36 – Reactor performances in terms of RY, RF and x in co- and counter-current flow for the catalyst distribution obtained from the maximization of RY. The conversion of the corresponding staged TR is also reported for comparison in both the flow configurations. The operating conditions are specified in Table 5.12. ... 209 Figure 5.37 – Comparison among the SMR performances for several catalyst distributions in co-current flow. The performances of the conventional MR (with the same membrane area as the SMR but a double amount of catalyst) are also reported. The operating conditions are specified in Table 5.12 ... 210 Figure 5.38 – Comparison among the SMR performances for several catalyst distributions in counter-current flow. The performances of the conventional MR (with the same membrane area as the SMR but a double amount of catalyst) are also reported. The operating conditions are specified in Table 5.12 ... 211 Figure 5.39 – Performances of the SMR (x, RF and RY) in co-current flow as a function of the number of equi-sized stages for different percentages of catalyst at TFur = 600°C. The performances of the conventional MR are also
reported for comparison. The remaining operating conditions are specified in Table 5.16. ... 215 Figure 5.40 – Performances of the SMR (x, RF and RY) in co-current flow as a function of the number of equi-sized stages for different percentages of catalyst at TFur = 500°C. The performances of the conventional MR are also
reported for comparison. The remaining operating conditions are specified in Table 5.16. ... 217 Figure 5.41 – Performances of the SMR (x, RF and RY) in counter-current flow as a function of the number of equi-sized stages for two furnace temperatures at a percentage of catalyst of 30%. The performances of the conventional MR are also reported for comparison. The remaining operating conditions are specified in Table 5.16... 219 Figure 5.42 – Conversion profiles for some numbers of stages and amounts of catalyst in co-current configuration at TFurnace = 600°C. The remaining operating conditions are specified in Table 5.16... 220
Figure 5.43 – Performances of the SMR (x, RF and RY) for TFurnace of a) 600°C, b) 500°C and c) 400°C in co- and
counter-current flow at a "high" number of stages (> 100 ca.) as a function of the catalyst fraction of the fully-filled conventional MR, whose performances are also reported for comparison. The remaining operating conditions are specified in Table 5.16. ... 221
Figure 5.44 – Catalyst saved as a function of performance losses with respect to the conventional MR (in terms of x and RY) for different furnace temperatures in co- (a) and counter-current (b). The remaining operating conditions are specified in Table 5.16. ... 222 Figure 5.45 – Advantage map for methane steam reforming carried out in a Staged Membrane Reactor. The remaining operating conditions are specified in Table 5.16. ... 224 Figure 5.46 – Performance indices a) as functions of the stages' number at 600°C and b) as functions of the furnace temperature for 100 or more stages in co-current flow. The dashed arrows (drawn only for conversion) indicate how to evaluate the advantage of adopting a high number of stages in terms of lower operating furnace temperature. ... 225 Figure 5.47 – Reduced furnace temperature that is possible to adopt instead of the one of the reference case (600°C and 10 stages) by adopting a high number of stages (>100 ca.) as function of the catalyst amount for conversion and recovery yield valid for co- and counter-current flow. ... 226 Figure 5.48 – Scheme of the porous Stainless Steel supported Pd-alloy membrane considered... 232
T
ABLE OF
C
ONTENTS
L
IST OFT
ABLES... 1
CHAPTER 1...1 CHAPTER 2...1 CHAPTER 3...1 CHAPTER 4...1 CHAPTER 5...2L
IST OFF
IGURES... 3
CHAPTER 1...3 CHAPTER 2...3 CHAPTER 3...4 CHAPTER 4...5 CHAPTER 5...6T
ABLE OFC
ONTENTS... 10
A
BSTRACT... 15
A
BSTRACT... 19
H
YDROGENP
RODUCTION ANDP
URIFICATIONP
ROCESSES... 23
1.1GENERALITIES...24
1.2HYDROGEN PRODUCTION PROCESSES...25
1.2.1METHANE STEAM REFORMING...26
1.2.2PARTIAL OXIDATION OF HYDROCARBONS AND AUTO-THERMAL PROCESSES...30
1.2.3ELECTROLYSIS OF WATER...33
1.2.4HYDROGEN PRODUCTION BY CHEMICAL-SOLAR PROCESS...34
1.2.5INNOVATIVE PROCESSES FOR HYDROGEN PRODUCTION: MEMBRANE-BASED PROCESSES...36
1.2.7COAL GASIFICATION...38
1.2.8NUCLEAR STEAM REFORMING...41
1.2.9THERMO-CHEMICAL HYDROGEN PRODUCTION...43
1.3HYDROGEN PURIFICATION PROCESSES...45
1.3.1PRESSURE SWING ADSORPTION (PSA)...45
1.3.2MEMBRANE-BASED HYDROGEN SEPARATION PROCESSES...48
1.3.3HYDROGEN SEPARATION IN CRYOGENIC...49
1.4LITERATURE CITED...53
M
EMBRANES FORG
ASS
EPARATION... 54
2.1GENERAL CONCEPTS...55
2.2MEMBRANES CLASSIFICATION...58
2.2.1POLYMERIC MEMBRANES...59
2.2.2INORGANIC MEMBRANES...60
2.2.2.1DENSE METALLIC MEMBRANES... 61
2.2.2.1.1PD-BASED DENSE MEMBRANES... 62
2.2.2.1.2PALLADIUM HYDROGEN SYSTEM... 63
2.2.2.1.3POISONING AND INHIBITION PHENOMENA IN PALLADIUM AND ITS ALLOYS... 66
2.2.2.1.4PREPARATION METHODS OF PD-ALLOY MEMBRANES... 68
2.2.2.1.5PEROVSKITES... 75
2.2.2.2POROUS CERAMIC MEMBRANES... 75
2.2.2.2.1ZEOLITIC MEMBRANES... 78
2.3LITERATURE CITED...83
M
ODELLING OFH
YDROGENP
ERMEATIONT
HROUGHS
UPPORTEDP
D-
BASEDM
EMBRANES... 85
3.1INTRODUCTION...86
3.2DESCRIPTION OF THE MODEL...89
3.2.1MASS TRANSFER IN THE FLUID PHASES ON RETENTATE AND PERMEATE SIDE...91
3.2.2DISSOCIATIVE ADSORPTION AND RE-COMBINATIVE DESORPTION...94
3.2.3TRANSITIONS "SURFACE-TO-BULK" AND "BULK-TO-SURFACE"...96
3.2.4DIFFUSION THROUGH THE PD-BASED BULK...97
3.2.5TRANSPORT THROUGH THE SUPPORT POROUS LAYERS...99
3.3STRATEGY FOR THE NUMERICAL SOLUTION...100
3.4.1LAMINAR FLOW CONDITIONS...103
3.4.2TURBULENT FLOW CONDITIONS...108
3.4.3LAMINAR VS. TURBULENT REGIME...113
3.5COMPARISON WITH LITERATURE...117
3.5.1COMPARISON WITH WARD AND DAO'S SIMULATION...117
3.5.2MODEL VALIDATION...119
3.6CONCLUSIONS...121
3.7APPENDICES...122
3.7.1APPENDIX A: CALCULATION OF THE PHYSICAL PROPERTIES...122
3.7.1.1VISCOSITY OF SINGLE GAS... 122
3.7.1.2VISCOSITY OF MIXTURE... 123
3.7.1.3BINARY MIXTURE DIFFUSIVITIES... 124
3.7.1.4KNUDSEN DIFFUSIVITY... 124
3.7.2APPENDIX B:CALCULATION OF THE PERMEATION RELATIVE RESISTANCES...125
3.7.2.1RELATIVE RESISTANCES OF THE ELEMENTARY STEPS... 125
3.7.2.2NORMALIZED OVERALL RESISTANCE... 125
3.8LIST OF SYMBOLS...126
3.9LITERATURE CITED...128
C
ONCENTRATIONP
OLARIZATION INS
ELF-
SUPPORTEDP
D-
BASEDM
EMBRANES... 130
4.1INTRODUCTION...131
4.2DESCRIPTION OF THE SYSTEM...133
4.3CONCENTRATION POLARIZATION COEFFICIENT...136
4.4RESULTS AND DISCUSSION...141
4.4.1INFLUENCE OF THE PERMEANCE ON CPC...141
4.4.2POLARIZATION MAPS...145
4.4.3MODEL VALIDATION...153
4.5CONCLUSIONS...155
4.6LIST OF SYMBOLS...156
4.7LITERATURE CITED...156
D
EVELOPMENT OFI
MPROVEDC
ONFIGURATIONS FORS
TAGEDP
D-
BASEDM
EMBRANER
EACTORS.
C
ASES
TUDY:
M
ETHANES
TEAMR
EFORMING... 159
5.1INTRODUCTION...160
5.2.1DESCRIPTION OF THE SYSTEM...163 5.2.2MATHEMATICAL MODEL...165 5.2.2.1SET OF EQUATIONS... 166 5.2.2.1.1MASS BALANCES... 166 5.2.2.1.2ENERGY BALANCES... 167 5.2.2.1.3PRESSURE VARIATION... 168
5.2.2.1.4EVALUATION OF THE CATALYST EFFECTIVENESS FACTOR... 169
5.2.2.2MODEL VALIDATION... 170
5.2.3OPTIMIZATION PROCEDURE...172
5.2.4RESULTS AND DISCUSSIONS...175
5.2.4.1EQUI-SIZED STAGES. ... 175
5.2.4.2OPTIMIZATION OF METHANE CONVERSION... 179
5.2.4.3OPTIMIZATION OF H2 RECOVERY FACTOR... 185
5.2.4.4ON THE ROLE OF THE HEAT EXCHANGE AREA IN THE PSMR,MR AND TR ... 188
5.2.4.5CHOICE OF THE "MOST CONVENIENT" OBJECTIVE FUNCTION... 191
5.3CASE STUDY II:INERT-STAGE MEMBRANE REACTOR...192
5.3.1OPTIMIZED STAGE LENGTHS...192
5.3.2MATHEMATICAL MODEL...193
5.3.2.1SET OF EQUATIONS... 193
5.3.2.2OPTIMIZATION PROCEDURE... 195
5.3.3RESULTS AND DISCUSSIONS...196
5.3.3.1CASE 1: THE CATALYST MASS ENTIRELY PLACED AT THE REACTOR INLET... 196
5.3.3.2CASE 2: MAXIMIZATION OF THE METHANE CONVERSION... 201
5.3.3.3CASE 3: MAXIMIZATION OF THE HYDROGEN RECOVERY YIELD... 205
5.3.3.4COMPARISON AMONG THE DIFFERENT DISTRIBUTIONS... 210
5.3.4ON THE EFFECT OF THE STAGES'NUMBER AND CATALYST AMOUNT...212
5.3.4.1DESCRIPTION OF THE SYSTEM... 213
5.3.4.2RESULTS AND DISCUSSION... 214
5.3.4.2.1ADVANTAGE MAPS OF THE PROCESS... 220
5.4CONCLUSIONS...227
5.4.1PERMEATIVE STAGE MEMBRANE REACTOR...227
5.4.2INERT STAGE MEMBRANE REACTOR...228
5.5APPENDICES...229
5.5.1APPENDIX A:PARAMETERS FOR METHANE STEAM REFORMING REACTION RATE...229
5.5.2APPENDIX B:EVALUATION OF THE PHYSICAL PROPERTIES OF THE SYSTEM...230
5.5.2.1VISCOSITY AND THERMAL CONDUCTIVITY OF PURE GASES... 230
5.5.2.2VISCOSITY AND THERMAL CONDUCTIVITY OF GAS MIXTURES... 230
5.5.3APPENDIX C:EMPIRICAL CORRELATION FOR THE HEAT TRANSFER COEFFICIENT...232
5.5.3.1CASE PSMR ... 233
5.5.3.2CASE ISMR ... 233
5.6LIST OF SYMBOLS...234
5.7LITERATURE CITED...237
O
VERALLC
ONCLUSIONS ANDP
ERSPECTIVES... 240
CONCLUSIONS...240
PERSPECTIVES OF FUTURE WORKS...242
L
IST OFP
UBLICATIONS... III
PUBLICATIONS ON INTERNATIONAL JOURNALS...III
PUBLICATIONS IN PROCEEDING ACTS OF CONGRESSES...III
A
CKNOWLEDGMENTS...V
A
BSTRACT
Il presente lavoro di tesi è rivolto all'analisi, modellazione e simulazione di membrane supportate dense metalliche a base di palladio e reattori catalitici dotati di membrana della stessa tipologia. La motivazione di tale studio si inquadra nella logica della cosiddetta "Process Intensification Strategy" il cui fine ultimo è quello di sviluppare apparecchiature innovative in grado di fornire, a parità di condizioni, le stesse o più alte prestazioni di quelle tradizionali, ma con costi di esercizio e volumi di impianto nettamente inferiori. In questo senso – e da qui il motivo di sviluppare un lavoro di tesi sull'argomento – la tecnologia delle membrane può certamente contribuire allo scopo in modo decisivo. Entrando più specificamente nel merito dei principali argomenti di questo studio, per inquadrare meglio il suo ambito, i primi due capitoli sono incentrati sullo stato dell'arte a) dei principali processi di produzione e separazione di idrogeno e b) della tecnologia delle membrane utilizzabile per la purificazione di correnti gassose, rivolgendo particolare attenzione a quello che è uno degli argomenti principali di questo lavoro di tesi, ossia le membrane dense metalliche a base di palladio.
In seguito, l'analisi condotta nei capitoli successivi può essere idealmente divisa in due parti, nella prima delle quali (Capitoli 3 e 4) sono studiate in dettaglio le membrane dense a base di palladio. In particolare, nel Capitolo 3 è sviluppato un nuovo modello di permeazione dell'idrogeno attraverso dette membrane che permette di tener conto di diversi aspetti e problematiche non ancora affrontati esaustivamente in letteratura. Tale modello prevede che il processo di permeazione nella sua globalità sia suddiviso in stadi elementari, ciascuno dei quali caratterizzato dalle proprie equazioni cinetiche e di trasporto. Gli stadi elementari considerati sono i seguenti: 1-2) trasporto esterno dell'idrogeno dal bulk fluido alla superficie metallica e vice-versa, 3-4) adsorbimento a desorbimento sulla/dalla superficie metallica, 5-6) transizione dell'idrogeno atomico dalla fase di adsorbimento superficiale a quella di dissoluzione nel bulk metallico e vice-versa, 7) diffusione dell'idrogeno atomico attraverso il
bulk metallico e 8) trasporto esterno di massa attraverso i diversi strati porosi di un opportuno supporto multistrato. Sebbene in questo tipo di membrane si abbia solo flusso di idrogeno, per il trasporto di massa nelle fasi fluide esterne allo strato selettivo vero e proprio è stato adottato un approccio multicomponente, in modo tale da poter descrivere correttamente situazioni più vicine alla realtà di quelle solitamente considerate in letteratura (miscele di idrogeno bi-componenti). Il modello così sviluppato, validato con opportuni dati di letteratura, permette di quantificare l'influenza di ciascuno stadio di permeazione e di identificare così quelli che controllano il processo al variare delle condizioni operative.
Nel Capitolo 4, lo stesso modello di permeazione è applicato alla quantificazione di un fenomeno che, in modo più o meno significativo, riguarda tutti i processi basati sulla tecnologia delle membrane: la polarizzazione per concentrazione, che consiste nel progressivo aumento della resistenza esterna al trasporto delle specie permeanti a causa della presenza delle altre che si addensano sulla superficie dello strato selettivo. Per molto tempo, tale fenomeno, dovuto proprio alla perm-selettività della membrana, è stato considerato del tutto trascurabile per i processi in fase gassosa, ma, con lo sviluppo di membrane sempre più sottili e performanti caratterizzate da alti flussi, esso ha assunto un'importanza sempre più rilevante nel corso degli ulitmi anni. L'analisi, sviluppata in questo lavoro per membrane auto-supportate a base di palladio, permette di predire l'influenza della polarizzazione per concentrazione al variare di diverse condizioni di processo tramite un coefficiente (di polarizzazione) opportunamente definito. Le diverse situazioni così ottenute sono riassunte nelle cosiddette "mappe di polarizzazione", grafici in cui è possibile visualizzare in modo diretto l'effetto del fenomeno sulle performance della membrana e che indicano le condizioni di funzionamento migliori da adottare in un processo di purificazione di idrogeno. Alla fine del Capitolo 4, si è provveduto ad un confronto con un sistema reale di letteratura, che, oltre a dimostrare la bontà dell'analisi, indica anche che questo fenomeno, in certe condizioni operative, può essere determinante al punto tale da costituire lo stadio limitante dell'intero meccanismo di permeazione dell'idrogeno in membrane a base di palladio.
La seconda parte del presente lavoro di tesi (Capitolo 5) è invece dedicata alla modellazione, l'analisi e la simulazione di reattori catalitici a stadi dotati di membrana a base di palladio in cui è condotta la reazione di steam reforming del metano. Per questi reattori si è proceduto all'individuazione di configurazioni ottimali tramite un appropriato strumento computazionale appositamente sviluppato in Matlab®. Entrando nel merito dello studio, due tipologie di
apparecchiatura costituiscono l'oggetto di indagine. La prima consiste in un reattore tubolare a membrana a stadi, composto di stadi esclusivamente reattivi (senza membrana) posti in serie alternata a stadi a membrana esclusivamente permeativi (senza catalizzatore) in cui avviene la separazione selettiva del prodotto chiave (l'idrogeno). La seconda apparecchiatura considerata è anch'essa un reattore tubolare a stadi dotato di membrana a base di palladio, ma assemblata in stadi reattivi ed inerti (entrambi costituiti di pellet), disposti anch'essi in serie alternata, in cui, diversamente dal caso precedente, la rimozione selettiva dell'idrogeno avviene in entrambe le tipologie di stadi. Dopo aver opportunamente validato il modello mediante dati di letteratura, si passa allo studio di ciascuna tipologia di reattore. In particolare, per il primo tipo si è fissato un certo numero di stadi (5 reattivi e 4 permeativi) considerando tre diverse distribuzioni di catalizzatore e di area di membrana. La prima di queste, presa come riferimento per valutare le prestazioni delle altre, è la distribuzione equi-spaziata, in cui tutti gli stadi (reattivi e permeativi) presentano la stessa lunghezza. Le altre due sono rispettivamente ricavate tramite una procedura numerica di ottimizzazione di due diverse funzioni obbiettivo, che nello specifico sono date dalla conversione di metano e dal fattore di recupero di idrogeno. Le variabili decisionali, in base alle quali ottimizzare, sono quelle che determinano la distribuzione stessa, ossia le lunghezze dei singoli stadi. Le prestazioni relative a tutte le distribuzioni considerate sono successivamente confrontate con quelle di un reattore a membrana convenzionale nelle stesse condizioni operative (stessa quantità di catalizzatore ed area di membrana), mostrando miglioramenti significativi rispetto a quest'ultimo in termini della variabile che di volta in volta è scelta come funzione obbiettivo. Un simile approccio è stato adottato per l'analisi del secondo reattore a stadi. In questo secondo caso, lo studio è suddiviso in due parti. Nella prima si sono fissate quantità di catalizzatore e numero di stadi (5 reattivi e 5 inerti), considerando tre
distribuzioni di catalizzatore, nella prima delle quali (quella di riferimento) tutto il catalizzatore è concentrato nella parte iniziale del reattore. Analogamente all'apparecchiatura precedente, la stessa procedura di ottimizzazione è stata applicata per ricavare la seconda e la terza distribuzione, massimizzando separatamente le seguenti funzioni obbiettivo: la conversione di metano e la resa in recupero di idrogeno (diversa dal fattore di recupero). Anche in questo secondo caso, i miglioramenti rispetto alla configurazione di riferimento risultano notevoli in termini delle variabili di interesse. Nella seconda parte dello studio è indagato l'effetto del numero di stadi e della quantità di catalizzatore, espressa in percentuale rispetto a quella che occupa l'intero volume del reattore a membrana convenzionale equivalente. Si trova che aumentando il numero di stadi le prestazioni del reattore crescono prima in modo significativo, per poi assestarsi ad un valore costante dipendente dalla quantità di catalizzatore considerata. Un analogo comportamento si nota facendo variare quest'ultimo parametro, poiché si osserva che, utilizzando un numero di stadi abbastanza elevato, dopo un certo punto, il reattore a stadi raggiunge in pratica le stesse prestazioni di un reattore a membrana convenzionale non mostrando significativi miglioramenti all'aggiunta di ulteriore catalizzatore. Ciò permette di quantificare l'ammontare del catalizzatore risparmiato utilizzando un reattore a stadi invece di uno interamente riempito, mostrando che tale risparmio può arrivare anche al 70-75% circa.
A
BSTRACT
The present work is focussed on analysis, modelling and simulation of the supported Pd-based membranes and Pd-based membrane catalytic reactors. The motivations of this study stay in the guide-lines of the so-called "Process Intensification Strategy", whose principal aim is developing innovative equipments able to provide the same or higher performances than the traditional ones with lower costs and smaller plant volumes. In this sense, the reasons of developing a dissertation on membranes and membrane equipments arise from the potential ability of membrane technology to provide a significant contribution to these goals. Specifically, the analysis is developed as follows. The first two chapters are focussed on the the state of art of a) the main hydrogen production and separazion processes and b) membrane technology for gas separation, with a particular attention to the Pd-based membranes, representing one of the principal topics of the present work. Then, the analysis carried out in the successive chapters can be ideally divided into two parts, in the first one of which (Chapter 3 and 4) the Pd-based membranes are studied in details.
In particular, in Chapter 3 a new hydrogen permeation model through this type of membranes is developed, allowing to take into account several aspects and problems not yet esaustively studied in literature. According with this model, the whole hydrogen permeation process is divided into several elementary steps, each of which is modelled by its own kinetic and mass transfer equations. The steps considered are: 1-2) hydrogen external mass transfer from the fluid bulk to the metallic surface and vice-versa, 3-4) adsoption/desorption to/from the metallic surface, 5-6) transition of the atomic hydrogen from the state of superficial adsorption to the one of dissolution in the metallic lattice and vice-versa, 7) diffusion of the atomic hydrogen through the metallic bulk, and 8) hydrogen mass transport through the porous layers of a multi-layered support. In modelling the mass transfer in the fluid phases external to the Pd-based selective layer, a multicomponent approach based on the Stefan-Maxwell equations is adopted
in order to be able describe more actual situations than those usually considered in literature (hydrogen binary mixtures). Such a model, validated by means of appropriate literature data, allows to quantify the influence of each step and identify the rate-determining ones as the operating conditions change.
In Chapter 4, the same permeation model is used to quantify a phenomenon regarding more or less significantly all the membrane-based processes: the concentration polarization, consisting in the progressive increase of the resistance to external mass transfer due to the presence of the other species concentrating towards the surface of the selective layer. For a long time this phenomenon (due to the perm-selectivity of membrane) has been considered negligible for those processes involving gas separation, but, as high-performance thinner membranes have been developed, it has assumes more and more importance. This analysis, developed in this work for self-supported membranes and applicable also to supported membranes in which the support has no influence, allows to predict the effect of the concentration polarization in several operating conditions by means of an appropriately defined coefficient. Several possible different situations are summarized in the here-called "polarization maps", being figures where the effect of this phenomenon on membrane performance is directly viewable and also the best working conditions are indicated. At the end of the Chapter 4 a comparison with some literature data demonstrates the validity of the analysis, indicating also that, in some cases, the concentration polarization in Pd-based membranes may reach such a level to become the rate-determining step of the whole permeation mechanism.
The second part of the present dissertation (Chapter 5) concerns the modelling and simulation of Pd-based membrane catalytic staged reactors where methane steam reforming is carried out. Several optimal axial distributions of catalyst and membrane area are determined for such reactors by means of a 1-D model solved by a computational tool appropriately home-developed in Matlab®. In particular, two types of reactor are considered. The first one –
here-called "Permeative Stage Membrane Reactor" – consists in a tube-in-tube membrane staged reactor composed of five reactive stages (without membrane) laid out in alternative series with four permeative ones, where the selective hydrogen separation occurs.
The second one – here-called "Inert Stage Membrane Reactor" – is also a tube-in-tube staged reactor composed of several reactive and inert stages in series (both constituted of pellets) with the membrane placed along its whole length. Hence, differently than before, the hydrogen removal occurs in both types of stages. After validating the model by means of opportune literature data, each reactor is studied. As concerns the PSMR, three different distributions are considered. The first one is characterized by equi-sized stages, whilst the remaining ones are obtained by optimizing two different objective functions, which in the specific case are methane conversion and hydrogen recovery factor. The decisional variables of optimization are the ones characterizing the distribution, i.e., the single stages' lengths. The performance related to all the obtained distributions are then compared to the ones of the equivalent conventional membrane reactor (with the same catalyst amount and membrane area).
A similar approach is adopted for the second reactor, whose analysis is divided into two parts. In the first one, stages' number and catalyst amount are set as fixed values, focussing the study on a ten stages membrane reactor (5 reactive and 5 permeative). Analogously to what done for the PSMR, three catalyst distributions are considered, in the first of which (set as reference one) the whole catalyst pack is entirely placed at the reactor inlet. The other two are achieved by optimizing methane conversion and hydrogen recovery yield by means of the same procedure as developed for the PSMR, showing higher performances than the reference distribution. In the second part of the analysis, the effect of the stages' number and catalyst amount are investigated, this last one expressed in terms of percentage with respect to the whole catalyst amount contained in the conventional membrane reactor, which is fully filled of catalytic pellets. The results of the study show that as the stages' number increases, the ISMR performances are significantly improved up to a certain point, their influence becoming negligible from this point on, whose value strictly depends on the catalyst amount.
An analogous behaviour is shown by analyzing the effect of the catalyst amount. In fact, according with the results achieved, if using a high enough stages' number (>100 ca.), the staged reactor leads up to the same performance as the conventional one with significantly lower catalyst amount. This very important result allows to quantify for the specific process the
level of catalyst saved using the staged membrane reactor instead of the conventional one, showing that this level may lead up to even 70-75%.
C
HAPTER1
H
YDROGEN
P
RODUCTION AND
1.1
G
ENERALITIESThe possible exhaustion of the fossil resources has led in the last three decades to search innovative technologies for energy production. These ones has been oriented towards energetic systems compatible as much as possible with a fully sustainable development of the human industrial activities, since the environment of the whole earth is more affected by the effects of the greenhouse gases. The principal systems of clean energy production, set up till now with good results, are the following:
¾ Wind-power.
¾ Solar power (by means of photo-voltaic cells). ¾ Geo-thermal power.
¾ Bio-mass conversion.
¾ Power production from hydrogen.
Among the above-mentioned energy production, a very promising process is that involving the power production directly from hydrogen streams. In fact, hydrogen is the most diffused chemical species in the universe and represents, at least virtually, a potentially inexhaustible resource. The use of this element as combustible (in a pure state) would present the great advantage of avoiding any kinds of harmful emissions, the water being the only product of its combustion. However, it has several drawbacks related to the storage and distribution, as it is possible to notice from the evaluation of some its physical properties:
¾ Critical temperature: -240°C. ¾ Boiling point: -253°C.
¾ Energy density (at 15°C, 100 kPa): 10.3 MJ m-3.
Hence, in order to avoid the hydrogen vaporization, it is necessary to keep very low values of temperature, achievable only in super-isolated storage-boxes (for the storage) and "thermos tanks" (for locomotion use by cars). The hydrogen "lightness" implies a non-favourable energy density to be stored as gas. In fact, at 200 bar, its volume is four times larger than that of natural gas at a constant energetic content. A higher pressure is not economically convenient, since the energy compression costs would not be balanced by the hydrogen used as a
compressed combustible. Nevertheless, the company Air Liquid has already developed a gaseous hydrogen distribution net in the north of France, in Belgium and in The Netherlands. Furthermore, the BP Company built in Barcelona the first refuelling station in Europe for bus fed with hydrogen, first produced by electrolysis and then compressed for the feed. A certain amount of energy necessary for the process is obtained from solar source (5% ca.). This station represents one of the steps of the program "Clean Urban Transport for Europe" (European Community) [1.1].
At present, for hydrogen separation, the petrochemical industry exploits integrated processes, like the PSA (Pressure Swing Adsorption) or cryogenic, all techniques not adapted to be carried out in refuelling stations. A possible solution may consist in utilizing membrane-based separation modules, which are more compact, versatile and commercially already available (polymeric membranes). However, the sole polymeric membranes are not sufficient to obtain the target purity, thus it is necessary to use another kinds of membranes, like, for example, the Pd-based ones, having a virtually infinite selectivity towards hydrogen with respect to all the other gases (this type of membrane will be the main argument of the Chapter 3 and 4 of this thesis). In this sense, one of the most important challenges of the next future is to design a large-scale system where the most of the separation is carried out in polymeric modules, leaving the purification process to be operated in Pd-based modules. Obviously, in order to make this possible, the behaviour of such a kind of membranes has to be studied in the different operating conditions, which may occur in an actual hydrogen distribution system.
1.2
H
YDROGEN PRODUCTION PROCESSES.
Hydrogen can be obtained from several raw materials by means of different techniques, as shown in Figure 1.1, where it is possible to notice that different hydrogen sources need different production methods. At the moment, the main hydrogen production processes can be summarized in:
9 Methane Steam Reforming (MSR).
9 Dry Reforming. 9 Water Electrolysis. 9 Separation of coking gases. 9 Separation of refinery gases. 9 Some innovative processes.
Figure 1.1 – Scheme of raw materials and the respective hydrogen production processes.
1.2.1
M
ETHANES
TEAMR
EFORMINGThe overall reactive mechanism describing Methane Steam Reforming (MSR) involves methane and water vapour, as indicated in Eq. 1.1. This mechanism includes the following two reactions (Eq. 1.2, 1.3).
1 0 r 2 2 2 4
2H
O
CO
4H
,
Δ
H
165
kJ
mol
CH
+
=
+
~
=
− (1.1) 1) "Principal Reforming": 1 0 r 2 2 2 4H
O
CO
3H
,
Δ
H
2
kJ
mol
CH
+
=
+
~
=
06
− (1.2) 2) "Water-Gas Shift (WGS)": 1 0 r 2 2 2O
CO
H
,
Δ
H
-
41
kJ
mol
H
CO
+
=
+
~
=
− (1.3)In Table 1.1 the operating conditions of each single step are reported. The reaction in Eq. 1.1 is highly endothermic, equilibrium limited and favoured by a high temperature and quite low pressure, implying an increase of the mole number. On the contrary, the reaction in Eq. 1.3 is moderately exothermic and, thus, favoured by a low temperature. Hence, operating at higher temperature, a larger CO production is achieved. In general, the industrial plants operate the MSR at 800-900°C, but, despite of these high values of temperature, they need appropriate catalysts. Usually, tubular reactors with a diameter of about 100 mm are used. These tubes, made of Cr alloys, are laid out in a combustion furnace [1.2]. The catalysts used are Ni-based wise supported on alumina. These types of catalysts are rapidly poisoned by sulphurated compounds, thus the impurities in the feed need to be less than 1 ppm. Another decrease of the process performance is caused by the formation of coke, which progressively covers the active catalytic sites. On an industrial point of view, this problem is solved adopting an appropriate feed ratio H2O/CH4. The sulphuric compounds eventually present in the natural
gas are mainly H2S, COS, CS2, RSH and tiophene. In order to reduce their concentration up to
reach acceptable values, the following separation methods can be used: 9 Regenerative absorption.
9 Oxidative absorption (on sulphur).
9 Treatment with alkali.
9 Fastening technique on ZnO, NiO or Fe2O3.
Table 1.1 – Main steps of Methane Steam Reforming.
Stage Operating conditions
Compression Pressure: 28 - 40 bar.
De-sulphuration
Hydro-desulphuration by Mo- and Co-oxides based catalyst Adsorption on active carbon
Principal Reforming
Alumina supported Ni-based catalysts Temperature: 700-900°C
Medium pressure Secondary Reforming Temperature: 1000 °C
Appropriate catalyst
CO conversion (Ware-Gas Shift)
Two step process:
Step1: Temperature of 350 - 450 °C with Fe- and Cr-oxide based catalyst Step2: Temperature of 200 - 250 °C with
Zn- and Al-oxide based catalyst.
CO2 Separation -
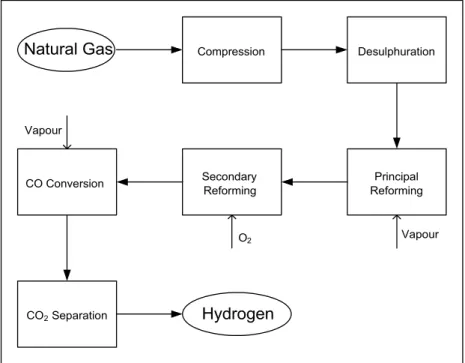
The industrial plants for hydrogen production operate at such a high temperature that, in order to obtain a CO-free stream, it is necessary to cool the products of the principal reforming and use a subsequent reactor for the WGS operated at 400-450°C. The consequent yield obtained is of the order of 85-90%, but it is possible to improve it by using a post-combustion step ("Combined Reforming"). The main steps of the combined reforming are shown in Figure 1.2. In this case, a complete conversion is not necessary, since the remaining methane is took away by means of the combustion step, carried out in adiabatic conditions. This step, catalyzed by nickel, leads to the formation of CO2 and water, which move the MSR reaction towards the
production of CO and H2. For reducing the content of CO, the process can be operated at high
water/CH4 feed ratio, but in this way the volumes in the plant would be too large and a pressure
higher than 40 bar (limit indicated in the plant) should be used.
Desulphuration Compression
CO2Separation
Principal Reforming CO Conversion Secondary Reforming
Vapour
O2 Vapour
Natural Gas
Hydrogen
Figure 1.2 – Scheme of the main steps of the MSR process.
For all these reasons, a feed ratio of 3-4 is adopted. Another possibility to limit the CO presence is represented by the use of different feed types (like the Virgin Naphtha), but this implies the formation of gas black, which, however, is a more important inconvenient than the same CO. In the last decade, the KTI S.p.A. has introduced some technological innovations allowing a decrease of operating and initial capital costs [1.3]. The hearth of this innovative technology is a new type of reformer, the "Heat Exchanger Reformer" (HER) combined with the "Advanced Reforming Technology" (ART). As mentioned above, in the MSR it is necessary to
supply the required heat through the external surface, but, because of some design constrains, it is not possible to recover the heat exiting the outlet in such a way to cover at least a part of the energetic requirement. On the contrary, the process HER is based on the use of a tube-in-tube configuration, where the catalyst is laid out in the annulus. The whole reactor is located in the furnace, where the combustible gases are introduced. The external tube is protected by some sleeves, inside of which the hot fumes come up from the furnace bottom to the top. The temperature is controlled by tuning the fuel flow rate. In 1993 a prototype of such a plant was started up in Rozemburg (The Netherlands) for producing about 100 Nm3 h-1 of hydrogen.
The tubes utilized have an ID of 6-8 in, but, because of this low diameter, the maximum line pressure is 19 bar. For large enough plants up to handle the flow rate coming from the refineries, the requested pressure is higher and, hence, tubes with an ID of 4 in should be used. The KTI company patented a new riser with larger heat exchange area and a small enough crossing area in such a way to allow the installation of the catalyst in standard tubes.
1.2.2
P
ARTIALO
XIDATION OF HYDROCARBONS AND AUTO-
THERMAL PROCESSES In the auto-thermal processes several hydrocarbons can be utilized as reactants, from the natural gas to the heavy oils. Generally speaking, the main operations for obtaining hydrogen from the hydrocarbons partial combustion processes are the following:a. Partial oxidation reaction.
b. Removal of the eventual gas black formed during the step a). c. Conversion of CO by means of water vapour (WGS). d. Removal of the CO2 formed and of residuals of CO and H2S.
Two kinds of process exist for the partial oxidation (mainly of methane): 9 Thermal process.
9 Catalytic process.
In the thermal process, the temperature necessary to obtain acceptable yields is quite high, since no catalyst is used. On the contrary, in the catalytic process, the presence of the catalyst allows to operate at lower temperature and increase the selectivity of the reaction. The partial
oxidation of methane is carried out by auto-thermal way, e.g., the exothermic reaction supply the heat required by the endothermic ones. In the specific case, it is important utilizing pure oxygen instead of air, since the presence of nitrogen would increase the thermal capacity of the system and more fuel should be consumed to reach the requested temperature. In the practise, in order to reduce the oxygen and hydrocarbon consumption, it is convenient to pre-heat the reactants up to the highest allowable temperature. Generally, it is possible to reach a temperature of 500°C. Above this temperature, the oxygen becomes very reactive also towards the material of which the heat exchanger is made and methane begins to crack. Working in these conditions, a reaction temperature of about 1200°C is reached, thing that requires high costs materials of the equipments involved in the process. It is important to notice that the role of the catalyst is to accelerate the endothermic reactions in such a way that these occur at the same time as the exothermic ones (oxidations). Hence, the furnace temperature can be kept below 1200°C, allowing certain working regularity of the process and the maximum durability of the catalyst. In order to do this, the spatial catalyst distribution has to be laid out to avoid the sintering of the pellets and the formation of gas black. In the thermal process, this last occurrence (presence of gas black) is particularly important, not as much because the gas black indicates lower yields, but rather because its removal is difficult on a technological point of view. Furthermore, its presence is bad for the process successive steps, since the carbon micro-particles are involved in heterogeneous reactions with water and CO2 which do not reach
the thermodynamic equilibrium. The formation of the gas black can be explained with the following considerations. The oxygen present in the reaction mixture reacts rapidly with methane to form in a first time CO2 and water. As a consequence, a flame develops, increasing
locally the temperature. If the process is operated in defect of oxygen, in the first part of the reactor there is a mixture containing mainly CO, CO2, water and CH4 non-reacted. Because of
the local high temperature, the methane in excess tends to decompose, causing the formation of carbon micro-particles depositing on the solid particles. Hence, in the second part of the reactor, the following chemical reactions are possible (Eq. 1.4).
( )
( )
( )
s
CO
2CO
C
H
CO
O
H
s
C
2H
s
C
CH
2H
2CO
CO
CH
2 2 2 2 4 2 2 4=
+
+
=
+
+
=
+
=
+
(1.4)The first reaction is homogeneous and tends to reach rapidly the thermodynamic equilibrium. The same does not occur for the last three that are heterogeneous. Thus, if the residence time in the reactor is not long enough, the system does not reach the equilibrium corresponding to the operating temperature and gas black is found in the reaction products. As concerns the working pressure, the thermodynamics of the overall mechanism is favoured by low pressures. Nevertheless, at a high enough temperature, the conversion is quite high even at high pressures. Moreover, if the syngas produced has to be fed in an ammonia or methanol synthesis plant, it is more convenient to carry out the process under pressure. Generally speaking, in methane partial oxidation processes, a total conversion is usually reached. In the thermal processes, the absence of catalyst allow to use hydrocarbon feeds containing sulphuric compounds, which are found at the end of reactor as H2S, COS, CS2, S and tiophene,
poisons for the catalyst, as said before.
After the reaction, the gases have to be subjected to quenching, which has to be as rapid as possible in order to avoid some undesirable reactions. In the industrial practise, the exiting gases are cool down by means of water, which has also a role in catching eventual traces of carbon-wise products. In thermal process, the reactor is constituted of a simple cylindrical part in which a true combustion occurs between hydrocarbon and oxygen. In order to avoid explosive phenomena, the reactants are fed separately and then mixed in a burner. Since at the exit of the burner the temperature is of the order of 3000°C, it is necessary to protect the reactor by means of refractory materials. The reactor has to be designed in such a way to allow a rapid heat transfer from the zones of the exothermic reactions to the ones where the
endothermic reactions occur. In the catalytic process, the reactor is constituted of cylindrical tubes where the Ni-based catalyst is packed. When the gases pass through the cooling zone, they bring with them water vapour, utilized successively by the WGS. A high CO conversion in this step is particularly important if hydrogen for ammonia synthesis is being produced, because CO represents a poison for the catalyst used. These kinds of reactors need quite accurate control systems, especially as concerns temperature and reactants feed ratio. In fact, even small variations of the feed ratio O2/hydrocarbon may lead the reactor up to run-away
problems, with consequent explosion risks.
1.2.3
E
LECTROLYSIS OF WATERThe production of hydrogen from electrolysis of water at industrial level is quite rare, because of the high costs of electrical energy. However, the development of an appropriate sun-based technology may render it attractive in the next future. The main advantage of this process is that it is possible to reach a stream purity up to 99.8%, even though Pd-based membrane techniques may lead to a more economical processes reaching the same purity level. The reactions involved in the electrolysis are shown in Eq. 1.5.
O
H
0.5O
2e
2OH
:
Anode
2OH
H
2e
O
2H
:
Catode
2 2 2 2+
+
→
+
→
+
− − − − (1.5)As a sub-product of this process, only oxygen is obtained. The electrolyte is composed of an aqueous solution of sodium or potassium carbonate for increasing the electrical conductivity of the cells, decreasing in this way the voltage drop. The choice of the hydroxides is based on the following considerations. Set the concentration, the solution of sodium carbonate has a lower cost, but is more corrosive, presents a lower conductivity and has a higher vapour tension. The water to fed in the cells has to be de-mineralized (max 8-10 mg L-1 of salts), in order to avoid a
too much ions accumulation with consequent precipitation of low-soluble compounds. The voltage to apply between the electrodes depends on factors like: equilibrium voltage, initial
surge voltage of the metallic electrodes and surge voltage due to concentration. In fact, the voltage drop in the cell is higher than the theoretical one related to its conductivity and geometry, since the gas produced during the process causes the formation of gaseous droplet representing segregation zones with a very low conductivity. Another important factor is the system temperature, which should be as high as possible in the limits of the operating conditions, in order to make the over-voltage minimum. However, it is not possible to exceed 70-80°C to avoid a too significant evaporation which can lead to an increase of the gas humidity and corrosion intensification. Meanly, the consumption of electrical energy is about 5 kWh Nm-3. A possible method to reduce the costs of the process can be represented by
integrated generators of electrical energy: the energy in excess can be used for hydrogen production. The advantage for the energy producers would concern the production stabilization and transient phenomena limitation, even though at the moment companies like Enel adopt policies of costs diversification basing on time slots.
1.2.4
H
YDROGEN PRODUCTION BY CHEMICAL-
SOLAR PROCESSThe process in object is carried out as described in succession. The solar radiations are conveyed in the focus of a parabolic solar mirror, increasing the temperature over 2000°C. The heat so produced can be used in two ways.
9 On one hand to feed a thermal machine in order to produce electric energy. For example, in USA and Spain there are pilot-plants with large mirror field conveying the solar radiations in a tower located in the focus.
9 On the other hand, the high temperature in the focus can be exploited to start up chemical reactions not possible at lower temperatures. In Paul Scherrer Institut (PSI), some cyclical thermo-chemical processes are studied. In these processes water is broke down in its elements by means of several thermal reactions, like, for example, the cycle of the iron-oxide (Eq. 1.6). The reduction of Fe3O4 in FeO is an endothermic
reaction, whilst the second step is exothermic. The calorific value of the FeO produced is higher than that of hydrogen, thus, this process develops energy. On a
thermodynamic point of view, the transformation of Fe3O4 in FeO requires a
temperature of almost 2200°C, whereas the water decomposition occurs at about 500°C generating heat. 2 2 2 2 4 3 2 nd 2 4 3 st O 2 1 H O H : Overall C) 500 (T H O Fe O H 3FeO : step 2 C) 2200 (T O 2 1 3FeO O Fe : step 1 + → ° ≅ + → + ° ≥ +
→
(1.6)Figure 1.3 – Scheme of the Dusty Cloud Reactor for chemical-solar reactions. The concentrated solar radiations are absorbed directly by aero-sol particles suspended in an appropriate gas.


![Table 1.4 – Relative adsorption strength of the most common impurities. UOP 3111 [1.13]](https://thumb-eu.123doks.com/thumbv2/123dokorg/2878138.10091/50.637.129.514.138.344/table-relative-adsorption-strength-common-impurities-uop.webp)
![Figure 1.8 – Hydrogen recovery as function of the hydrogen purity. UOP 3111 [1.13].](https://thumb-eu.123doks.com/thumbv2/123dokorg/2878138.10091/51.637.112.535.389.685/figure-hydrogen-recovery-function-hydrogen-purity-uop.webp)