ISSN 1828-5961
Danilo Marques de Magalhães Laurea e Master in Geografia presso l’Università Federale di Minas Gerais. Ha esperienza in applicazioni di GIS per la diagnostica ambientale, ana-lisi del paesaggio e la pianificazio-ne urbana. Attualmente è docente presso il Centro Universitario di Belo Horizonte, dove insegna a Remote Sensing ed applicazioni che coinvol-gono geotechnologies.
Ana Clara Mourão Moura Architetto e urbanista. Specialista in Pianificazione Territoriale e Urba-na, Dottorato di ricerca in Geografia (GIS) presso l’Università Federale di Rio de Janeiro. Professore associato presso l’Università Federale di Minas Gerais, Facoltà di Architettura. Do-cente di Progettazione Urbanistica e coordina il Laboratorio GIS. Coor-dina il gruppo di ricerca del CNPq: “GIS nella gestione del paesaggio e dell’ambiente urbano”.
Questo studio ha l’obiettivo di dimostrare l’ap-plicabilità dell’analisi metrica del paesaggio in porzioni di tessuto urbano. Più in particolare, ci si concentra sull’uso della vegetazione bassa, vegetazione arborea e arbusti, e sulla loro distri-buzione nell’uso del territorio. Vengono spiegate anche le differenze di copertura vegetale per le aree urbane. Il testo descrive brevemente lo stato dell’arte sull’ecologia del Paesaggio e sull’analisi metrica del paesaggio. È sviluppato, come esem-pio, un caso di studio a Belo Horizonte, Minas Ge-rais, Brasile. Attraverso quest’analisi, il contributo propone la definizione di aree prioritarie per la conservazione di parchi urbani, di parchi lineari e corridoi verdi. Per la progettazione del paesaggio urbano, gli studi di rappresentazione del paesag-gio sono ancora interessanti, ma si deve consi-derare anche la relazione sistemica tra i diversi fattori relativi alla forma e all’uso del territorio.
The study demonstrates the applicability of lan-dscape metric in urban analysis. It focuses in low vegetation cover, arboreal and shrubbery vegeta-tion and their distribuvegeta-tion on land use. Discusses briefly the state-of-the-art Landscape Ecology and landscape metrics and develops the case stu-dy of Belo Horizonte, Brazil. For this stustu-dy, it was selected the use of the measure of area’s metrics, the relation between area, perimeter, core, and circumscribed circle. From this analysis, this pa-per proposes the definition of priority areas for conservation, urban parks, free spaces of com-mon land, linear parks and green corridors. It is demonstrated that the studies of two-dimension landscape representations are still interesting, but should consider the systemic relation betwe-en differbetwe-ent factors related to shape and land use.
Morfologia delle metriche di paesaggio in aree urbane: analise del ruolo della vegetazione nella gestione della
qualità ambientale urbana
Landscape morphology metrics for urban areas: analysis of the role of vegetation in the management of the
quality of urban environment
Parole chiave: metriche di paesaggio urbano;
copertura della vegetazione urbana; uso del suolo urbano
Keywords: landscape metrics; urban vegetation
ISSN 1828-5961 Landscape morphology metrics for urban areas 1. INTRODUCTION
From the expressive evolution of information technologies and, especially, geo-information, we ask ourselves if there is still room for studies related to two-dimensional representations and interpretations, and the answer is positive, as long as they are developed in a systemic manner, integrating different thinking.
It is necessary to comprehend that two-dimensional representation is necessarily a synthesis or summary of an information conjoint, studied though shared codes, meaning: the readers must be instructed in the decomposition of shapes and will create, in their minds, an interpretation of what means any given simplified symbolization of the reality.
When an architect or urban planner specialist acts in the process of project design, their thinking is primarily analytical, since several variables are considered, and the proposition is synthetic, hence, in this moment, a selection is undertaken between land occupancy shapes and manners, which translate best a sum of values evaluated. Two-dimensional representation, on the other hand, is the graphic expression of this process. It is an expression of a zenithal view over a landscape, which demands the reader to recognize the code used, in order to dismantle it in their minds and apprehend its meaning, creating a bridge between represented and projected space, while, in sequence, projected space and its materialization in real space.
Synthetic views offered by plans and maps will still hold an important role, but will continuously be enriched by new communication abilities and associating themselves with new media, seeking ways to best communicate with community, so that the urban planner or designer can be more of a manager of collective thinking, and less of a mere designer, closed off from reality. It is hoped, as Umberto Eco’s Open Work (1962) summarizes, that spatial reality is in constant composition, once interaction and participation of a user result in its transformation, and that each individual, according to individual and collective values shall undergo a personal reading and an appropriation of the land.
It is necessary, therefore, to return to the guiding question: are studies based on two-dimensional land representations still interesting? The answer is yes, but only as long as they are designed as variable integration systems, and extrapolate traditional two-dimensional limitations into representation codes dealing with complex realities.
Architecture, as a field specialized in metric studies, morphology and their meanings, traditionally remains interested in this thematic, since the selection of shapes (which translate specific functions) is in the nature of project designing.
Since the beginning of land occupation, human beings have structured their settlements’ shapes, and those fulfill specific functions. These would thus inform about the site’s land conditions, and would express the group’s cultural values. We may present sketches of known forms of occupancy and describe their functions’ meaning, such as: city shaped as stars, and each star point being an advance point of observation and protection; circular city plans, with obvious hierarchy and social distribution of locations, with the center as the hierarchy’s highest point; plans shaped as an uniform grid, with equal occupancy distribution, but valuing central locus, were are placed elements of greater civic value; and so on. Relations between shape and function are fundamental do architecture, and were very well described and investigated by many researchers, such as the classic modernist axiom of “form follows function”, practiced by L. Sullivan, F.L. Wright, and many others. They used it without dogmatism, but understanding that architecture is the art of these two variables combined. Therefore, it is part of DisegnareCon process that the designer will imagine that shapes are the synthesis of many values there contained, fulfilling the condition of specializing in uses conditions, use manners and use intentions. From these assertions, the acceptance of Landscape Ecology theories, and, mainly, landscape metrics, are still very pertinent, especially if the principal is understood as explained by Leitão et al (2006, p. xix): “Landscape
ecology focuses on three main characteristics: structure, functional, and change. Landscape ecology-based metrics quantify landscape structure or pattern. Structure relates to the composition and spatial distribution patterns of landscape elements: ecosystems, or, at a coarser level, land cover types (LCTs).”
In the study of landscape shapes and their metrics, two approaches are produced: “One
dimension is composition: the number, type and extent of these elements without explicit consideration of their spatial distribution”; while
the second aspect is “configuration, which is
the spatial character, arrangement, position, or orientation of landscapes elements” (Leitão, op.
cit.).
Landscape metrics in urban studies may be applied to different land cover types. A researcher may prefer to study urban areas and their shapes, which could result in interpretations on connectivity and dynamics of urban fluxes; stability and dynamics of existing settlements’ transformations; relations between city and country side in predominantly urban landscape composition, or integrated and diffuse landscapes during a spreading process; in amongst many other investigation possibilities. The Architecture Laboratory (Laboratório de Arquitetura) of Federal University of Minas Gerais (Universidade Federal de Minas Gerais) has already developed studies and offered modules on metric morphology of urban areas, aiming to identify characteristics, tendencies and vocations of urban sites, in the arrangement of a metropolitan region (Moura, 2010).
This paper investigates the role of vegetation cover in urban areas, seeking to analyze quality of urban life indicator, in order to support management of land use and occupancy proceedings, regarding, specifically, vegetation cover.
Coming from the principal that urban occupancies are of a complex nature, especially of the chosen area, which is the capital of a 2.500.000 people in metropolitan region, with high population density, it is necessary to better understand the role that vegetation cover plays in urban spaces. The logic or interpreting metrics cannot
ISSN 1828-5961 Landscape morphology metrics for urban areas follow values applied in studies of conservation
units and predominantly natural landscapes. Adaptations are needed to investigate anthropic areas and the role that vegetation covers play. The goal is equilibrium in landscape composition, resulting in urban quality of life, although understood as urban life as such, with all its vicissitudes, contradictions and complexities. The so much expected for sustainability of land use is therefore called for by Leitão et al (2006, p. xvii): “Ecology is concerned with the functioning of
systems and resources, and planning focuses on their use for human benefit. However, planning has only recently accepted ecological principles, and ecology has traditionally focused on the biophysical dimensional where humans were viewed as separate from natural systems.”
It is needed to know, within the context of urban densities, how the spatial arrangements of vegetation cover areas are, as well as their conditions of dimension and form. We ask which are the desired forms within an urban environment of occupancy, and also, in this case, of vegetation cover dispersion.
Coming from the principals laid out by Landscape Ecology, it may be considered that urban landscapes is as a mosaic, composed by a matrix, which corresponds to a predominant element in space occupancy. This matrix is filled with dispersed fragments and by linear (corridors) elements. A matrix of anthropic occupancy is composed by impenetrable surfaces (pavement and edifications) and naked soil (mining activities, areas during land division process, and so on). This urban matrix is intercut by arboreal, shrubbery, and low vegetation, dispersed in fragments of several sizes and shapes, such as parks, squares, road trees, and so on.
It is observed that the study of metrics in urban areas may be undertaken in different scales, both in the understanding of urban environmental conditions as a whole and according to the reality of its regions, such as a very local scale, which reaches a land plot unit scale. They define parameters for urban occupancy, which is in the best interest of planning strategies, and, consequently, of public policy.
The expectation is that landscape metric analysis of vegetation cover will result in a definition regarding which landscape it is desired to create, in the search for urban quality of life. Baring in mind the definition of landscape value, when considering vegetation cover, a challenge rises of transforming knowledge into urban parameter proposals.
2. LANDSCAPE METRICS
Environmental data modeling is a wide field for geo-technologies, especially geoprocessing, map algebra processes, and measuring spatial occurrences, in order to support land occupancy characterization. Amongst modeling studies of recent spatial data, we highlight the ones focusing on identifying patterns which aid motives’ comprehension, and leading to a certain spatial distribution; predictive studies of occupancy’s expansion tendencies; and studies of urban quality of life.
Models of landscape metric application were proposed initially by Landscape Ecology and Conservation Biology. The goal was to identify and characterize landscape fragments in order to select units with better conditions for environmental preservation; as well as to aid choices in spatial arrangements, which favor biodiversity, species balance, gene flux amongst units, and formation of ecological corridors, which would be in balance with anthropic land occupancies (Forman and Gordon, 1986). The term “landscape metrics” is exclusively referent to indexes developed for categorical map patterns. Landscape metrics are algorithms quantifying specific spatial characteristics of clusters, classes of clusters, or an entire landscape mosaic. Landscape Ecology is based on the fact that landscape spatial patterns strongly influence ecological processes (Couto, 2004).
Analysis supported by measurement and quantification of landscape elements mainly aid the interpretation of dynamics within landscape mosaics formed by heterogeneous and interactive units (Metzger, 2001). According to Lang and Blaschke (2009, p. 107), “landscape
structures result in that the landscape dimension
is divided in spatially variant combinations, of different compartments’ features”. Thusly,
an understanding of spatial configuration of structuring elements (such as size, shape, geographic position and type) allows interpretations of several processes associated to the analyzed landscape.
Calculus of a landscape’s structure aids discussions on each element’s function, as well as helps monitoring space-time transformations. Not only it is possible to identify patterns, but also it is possible to evaluate desirable landscape patterns, which contributes effectively to landscape monitoring and planning (Forman & Gordon, 1986; Turner & Gardner, 1991; Haines-Young, Green e Cousins, 1993; Lang & Blaschke, 2009).
When analyzing vegetation reminiscent in an urban cluster, great preserved vegetation areas, which may hold significant environmental roles and be extremely beneficial to the environment, may be observed. However, these areas may not be available or near populations land use and appropriation. We defend that more stretched and complex shapes – which allow a larger contact area, favoring its penetration, and are understood as frail, in terms of biodiversity conservation – may be more appropriate for urban areas, because they are more accessible to population’s daily uses. Vegetation cover clusters fulfill not only an environmental purpose, but also may fulfill the social function of maintaining free spaces for public use, by equipment insertion such as leisure equipment, sports, and so on. Falcón (2007, p. 40) defends that: “the importance
of a green space does not depend solely on its dimensions or of the vegetation it contains, but of the effective fulfillment of its function in the city’s green system, which is formed by elements of different sizes and uses, and their roles are complementary and interrelated”.
What must prevail, is certainly is a mixture of this composition, once any given area, with its corresponding size and location in urban grid, will perform a different function. Great areas present best environmental conditions and have greater power to influencing its surroundings,
ISSN 1828-5961 Landscape morphology metrics for urban areas in particle absorption, climate and in air quality
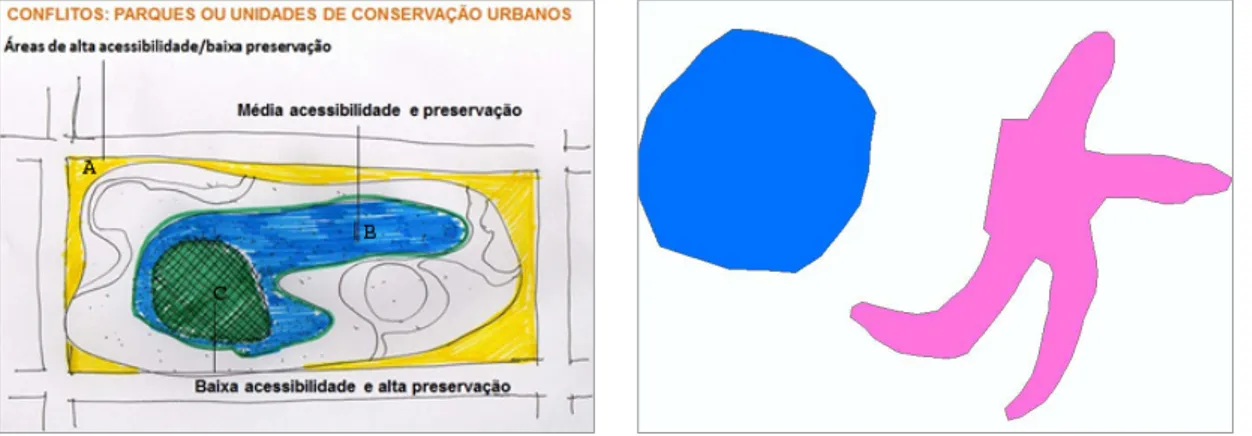
improvements, and, also, larger capacity of users. However, many times they have distant locations and with certain access restriction. Therefore, small spaces with vegetation are important, to ease the daily use of several social strata and age groups. Since they present smaller biomass, they will also suffer stronger impact from its surroundings, which will demand high maintenance frequency and cost. Nevertheless, they are alternatives for building cluster locations. Also, it is important to mention that trees placed in roads, private gardens, and urban parks, for instance, must be treated in different manners, since they fulfill different roles in the city. A sketch made by Bessa (2012) of an urban park clearly explains how use conflicts may be understood to better use green spaces reminiscent in urban grid.(Figure 1).
In this example, a same area would hold different functions and would accommodate environmental preservation and free spaces promotion for population use. It is observed that regions presenting better accessibility and smaller preservation are stretched and present more complex forms. In other words,
they show a higher relation perimeter/area. On the other hand, high preservation zones are constituted by a coherent nucleus, where there is less accessibility and, consequently, suffers less external interference. In case landscape metric were used to understand this example, aiming to identify priority areas for environmental preservation and priority areas for population use, the preserved nucleus would be identified by the existence of a large central area and a low relation perimeter/area, meaning, a stable less complex shape, closer to a circle. Areas of low preservation and high accessibility would be represented by a high relation perimeter/area, meaning, complex and extended shapes.
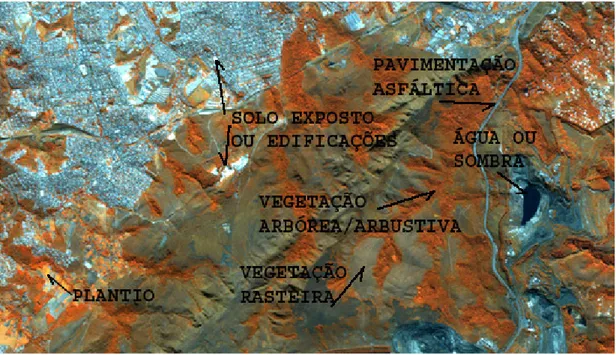
A complexity comparison between several shapes must be considered. (Figure 2).
What is intended is that landscape metrics opened new diagnostic and comparison possibilities. Hence, it also contributes in the prediction of possible impacts caused by landscape structure alterations. These results are being incorporated in environmental studies since the 1980’s, especially aiding the monitoring of anthropic transformations on the environment. Recently they were also used in urban environments, as an
aid to landscape planning (Lang, S., Blaschke, T. 2009, and Haines-Young, R.; Green, D. R; Cousins, S. 1993).
Due to this topic’s wide acceptance in the field of research, there are many software which perform space measurements of landscape’s fragments, resulting in their classifications according to measurement factor or fragment matrix; edge effects and core area; size, shape and isolation level of fragments; conditions evaluation of meta-population (related to gene flux); connectivity between fragments through corridors, and ecologic trampolines (steppingstones). From all software analyzed, we recommend Fragstats. Baring in mind the need to comprehend how free software work and their potential, Fragstats, developed by the Department of Natural Resources Conservation of Massachusetts University, is the focus of this paper. According to McGarigal et.al. (2002), Fragstats quantifies spatial configuration of a landscape’s fragments. Its developers inform that users must establish the bases which will define landscape patterns. 3. METHODOLOGY
This paper presents the results obtained in the application of landscape metrics on reminiscent vegetation within Belo Horizonte’s urban cluster (Minas Gerais, Brazil).
In order to reach the results, the following methodological script was used:
· Interpretation, supervised classification and post-classification of 2010 RapidEye images, in Springs 5.2.1 software;
· Conversion of matrix data on land use for vector data in ArcGIS 9.3;
· Selection of Belo Horizonte urban cluster and urban area fragments, up to 50m distant from it, to create a conurbation cluster;
· Fragment selection of arboreal, shrubbery and low vegetation, circumscribed by the conurbation cluster polygon;
· Conversion of data referent to vegetation within the conurbation cluster for ASCII matrix format;
· Applying Patch (fragments) metrics with Fragstats 3.3 software;
Figure 1 – Conflicts: Urban Parks or Urban Conservation Units. A- High acces-sibility, low preservation. B – Medium accessibility and preservation. C – Low accessibility and high preservation.
ISSN 1828-5961 Landscape morphology metrics for urban areas · Table with the landscape metric results in Excel
2010 and Access 2010;
· Association of numeric data to cartographic data, and vegetation fragments;
· Confection of thematic maps for result interpretation.
3.1. RAPIDEYE IMAGES
The urban cluster’s identification, as well as the identification of the exiting vegetation fragments, was undertaken from interpreting and supervised classification of images captured by RapidEye satellite in 2010. RapidEye satellites are equipped with REIS sensors (RapidEye Earth Imaging System) which operate in five tracks, three of which are in the electromagnetic spectrum known as “visible”. The other bands present the satellite’s major differential for vegetation monitoring. Red-Edge bands (690-730mm) and Near-Infrared (760-850mm) are able to identify alterations on, in that order, chlorophyll levels and cell structure of plants. Thusly, it is possible to map vegetation with much clarity and differentiate them from neighboring targets. Red-Edge band presents high correlations with chlorophyll’s fluorescence, which favors detailed and precise vegetation type discernment. Also, the image presents a spatial resolution of 5m and it is generated with 12 bits, meaning, it presents 4096 shades of gray, favoring discrimination of several targets found on the surface (RapidEye, 2012). Each image covers an area of 25km x 25km, meaning 625km² and 5 scenes were necessary to cover the entire area studied.
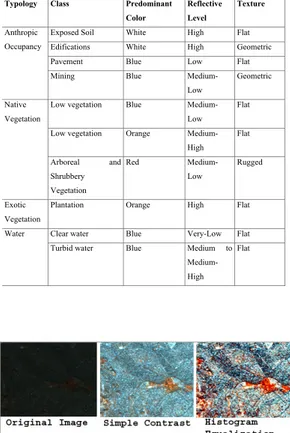
Due to all these characteristics, we chose to create compositions in RGB color, from 543 satellite’s bands, respectively, since they favor the distinction of vegetation from all other targets. It´s interesting to observe the objects identified on the surface, as well as the image’s characteristics. (Figure 3)
In the area studied, main targets identified were: · Exposed soils or edifications: highly reflect
electromagnetic radiation and, therefore, appear extremely light tones, tending to white; · Arboreal and shrubbery vegetation: due to
higher chlorophyll levels, they are captured
more intensely by the satellite’s 4 and 5 bands, and appear red and rugged, due to specie’s heterogeneity;
· Low vegetation: varies between blue and orange tones, with flat texture, due to specie’s homogeneity and low soil cover;
· Plantations: orange tones, detached from its surroundings, and flat textured, due to homogeneity of soil cover;
· Pavement: color tending to blue and flat texture;
· Clear waters: dark blue tones, tending to black, due to high absorbencies of electromagnetic energy. It is important to stress out that regions shadowed by buildings or mountain ranges appear in similar tones, making impossible to automatically distinguish these elements.
However, our focus was the separation of vegetation fragments from other elements and there were no costs in this case;
· Turbid waters: due to the presence of suspended sediments, and of a relatively high electromagnetic energy reflection, turbid waters appear light blue.
These targets correspond to land use classes, mapped accordingly to the procedure is now described.
3.2. SUPERVISED CLASSIFICATION IN SPRING 5.2.1 SOFTWARE
Interpretation and classification of satellite’s images were undertaken in Spring 5.2.1. It is Brazilian free software, developed by the National Institute of Space Research (Instituto Nacional de
Figure 3 – Color composition RGB-543 of RapidEye 2010 image. Água ou sombra = Water or shadows. Pavimentação asfáltica = Pavement. Solo exposto ou edificação = Exposed soil or edifications. Vegetação arbórea-arbustiva = Arboreal and shrubbery vegetation. Vegetação Rasteira = Low vegetation.
ISSN 1828-5961 Landscape morphology metrics for urban areas Pesquisas Espaciais - INPE). The classification is
the process of information extraction in images in order to recognize patterns and homogeneous objects. The result is composed by a digital image, constituted by classified pixels, individualized by graphic representation. The process of supervised classification proposes a user sample collection from known areas, sorting all image features from sampling (Santos, Peluzio and Saito, 2010).
However, some pre-processing tasks are necessary for a sorting result faithful to reality. This preparation aids sample collection. Consequently, tests were taken for image enhancement and contrast improvement, to obtain better target discretization. The option which made best vegetation sorting possible in urban areas was the software’s option “equalize histogram” The goal of this technique is to improve human eye visualization (Figure 4).
The second stage of supervised classification process was the “training”, consisting in capturing spectral samples of known features, which were going to be used to guide the image classifying algorithm. Therefore, each pixel within the image, in or out of the training area, is evaluated and assigned to the most probable class for it to belong (Santos; Peluzio; Saito, 2010).
For the sample collection, it is necessary visual inspection of the image and feature recognition, mapped by class definition. Classes must present similar color and texture, so that automatic sorting errors can be minimized. As described in the previous item, the following sorting key was planned.
Several classifiers were tested to better evaluate the result. The method “pixel to pixel sorting” was selected, due to processing time and result detailing level. This process consists in investigating spectral information of each isolated pixel, in order to create homogeneous classes. Amongst algorithms made available by Spring, the one presenting best result was MAXVER-ICM. In a first phase, image is classified by MAXVER algorithm, attributing classes to “pixels”, and considering digital level values. In the next phase, it is taken into account image’s contextual information, meaning, attributed class
Typology Class Predominant Color Reflective Level Texture Anthropic Occupancy
Exposed Soil White High Flat Edifications White High Geometric Pavement Blue Low Flat Mining Blue
Medium-Low
Geometric Native
Vegetation
Low vegetation Blue Medium-Low
Flat Low vegetation Orange
Medium-High Flat Arboreal and Shrubbery Vegetation Red Medium-Low Rugged Exotic Vegetation
Plantation Orange High Flat Water Clear water Blue Very-Low Flat
Turbid water Blue Medium to Medium-High
Flat
Several classifiers were tested to better evaluate the result. The method “pixel to pixel sorting” was selected, due to processing time and result detailing level. This process consists in investigating spectral information of each isolated pixel, in order to create homogeneous classes. Amongst algorithms made available by Spring, the one presenting best result was MAXVER-ICM. In a first phase, image is classified by MAXVER algorithm, attributing classes to “pixels”, and considering digital level values. In the next phase, it is taken into account image’s contextual information, meaning, attributed class depends on the pixel’s observed value, as well as of classes attributed to other near it. An algorithm attributes classes to a certain “pixel”, considering, interactively, its neighbors. This process ends when change percentage (reclassified pixels percentage), defined by user is satisfied. In our case, after testing we defined a 15% value for change.
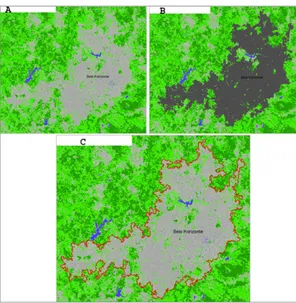
The result of the image classification detailing level is presented. (Figure 5). A mosaic of all five classified images was undertaken (each image has 25 x 25 km and we needed 5 of them to cover the entire municipal territory), in order to select Belo Horizonte’s urban cluster, conurbation which includes its surrounding municipalities. This process used ArcGIS 9.3 software, by Spatial Analyst module.
Figure 4 – Image and contrast application and equalization, and their respec-tive histograms. A = Original Image, B = Simple Contrast, C = Histogram Equalization.
depends on the pixel’s observed value, as well as of classes attributed to other near it. An algorithm attributes classes to a certain “pixel”, considering, interactively, its neighbors. This process ends when change percentage (reclassified pixels percentage), defined by user is satisfied. In our case, after testing we defined a 15% value for change.
The result of the image classification detailing level is presented. (Figure 5).
A mosaic of all five classified images was undertaken (each image has 25 x 25 km and we needed 5 of them to cover the entire municipal territory), in order to select Belo Horizonte’s urban cluster, conurbation which includes its surrounding municipalities. This process used ArcGIS 9.3 software, by Spatial Analyst module. 3.3. EXTRACTION OF A CONURBATION CLUSTER AND VEGETATION FRAGMENT SELECTION The choice over conurbation cluster is justified by the concept of metric application. Landscape structure calculus, which is this case is composed of vegetation fragments, considers fragments’ shape and size. Therefore, it is imperative that a fragment is not selected by divisions such as administrative limits, which is not a natural division. Also, it was included fragments of anthropic occupancy, up to 50m distant from the contiguous cluster. (Figure 6).
In order to create a delimitating polygon for this analysis’ scope, which corresponds to the conurbation cluster, all low, shrubbery and arboreal vegetation was selected for the landscape metric application. (Figure 7).
3.4. APPLICATION OF LANDSCAPE METRICS IN FRAGSTATS 3.3
Landscape metrics’ calculus was carried out separately to low vegetation and shrubbery and arboreal vegetation, as they present distinct urban environment use and management potentials. However, we have undertaken a result association, in the attempt to identify potential areas to integrate a green space system, in a regional scale.
Metric calculus of fragments allows several
ISSN 1828-5961 Landscape morphology metrics for urban areas
analysis and applications, in several scales. This case study has as a goal to demonstrate the techniques’ applicability in proposing a green spaces regional system. Thus, initially were analyzed greater fragment’s conditions, but we are planning to develop studies considering also smaller fragments, once they hold significant importance in residents’ daily lives.
It was also preferred to work with fragment metrics, in order to investigate use potentials for certain areas, from their shapes and geographic positions. For meeting our proposed goals, the metrics calculated were: area, core area, relation perimeter/area, and circumscribed circle. However, there are other metrics which can meet other demands, such as perimeter calculus, core area quantity, core area index, proximity, shape complexity index, spin radius, contiguousness, Euclidian distance, and similarity index.
A total of 27952 arboreal-shrubbery vegetation fragments and 85305 low vegetation fragments were analyzed. The results can be processed in several manners, according to a researcher’s intention and goal. In this study, the focus given
is to large vegetation areas, in order to identify areas with potential for large equipment, such as parks, conservation units, and green corridors. 3.4.1. AREA CALCULUS
The area is the mostly disseminated structure measurement, and therefore, it is considered the most important one by Lang and Blaschke (2009). Many other measurements are built directly and indirectly based on it. Ecology considers it an important tool, since it may determine the species potential number or even area demand for certain species.
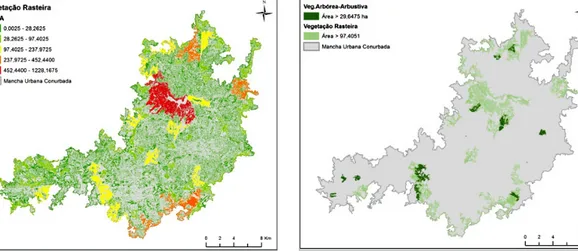
In this study, area calculation may represent a vegetation fragment hierarchy, within the area analyzed. From area’s metrics, we may seek for large fragments and propose investments, to transform them into large urban parks, in case they are not being used for it already. Arboreal vegetation presents a minimal area of 25m² and a maximum of 2317m². The average value is 2500m². However, most fragments (25779) present areas inferior to the average, in a way only 2173 fragments are superior to average. Within these fragments, large sized ones are predominant. (Figure 8).
Within these fragments, the ones presenting area larger then 29,65ha are incorporated to the final proposal of a regional green space system, with potential areas for creating large urban parks or conservation units. We stress out that since they are areas of expressive vegetation, these areas must be preserved in order to guarantee reminiscent biodiversity maintenance. In other words, the recommendation is not to directly intervene on these spaces, but to qualify their surroundings, generating more accessibility areas, favoring their use.
Low vegetation fragments represent areas of high use and appropriation potentials, since they constitute free spaces, without the environmental appeal of preservation. These areas may present different uses to the ones presented by arboreal vegetation, with leisure equipment’s, sports, and so on, and with greater accessibility, constant use by population and smaller preservation. It is in total 84305 fragments, and the area average
Figure 5 – Segment of a classified image. A = Original Image. B = Classified Image.
Figure 5 – Segment of a classified image. A = Original Image. B = Classified Image.
Figure 6 – Classification. A = Image classification result. B = Conurbation cluster selection. C = Delimitation of the area.
ISSN 1828-5961 Landscape morphology metrics for urban areas
is 96,228m². Only3118 fragments present areas above the average value, meaning 81187 remaining fragments present areas below 9,62ha. (Figure 9).
Amongst these fragments will be selected those with area larger then 97,40ha, in order to compose macro system of green spaces. It is highlighted that these fragments present a potential for constituting areas of free public use. A synthesis map is presented below, showing the areas’ large green spaces. (Figure 10).
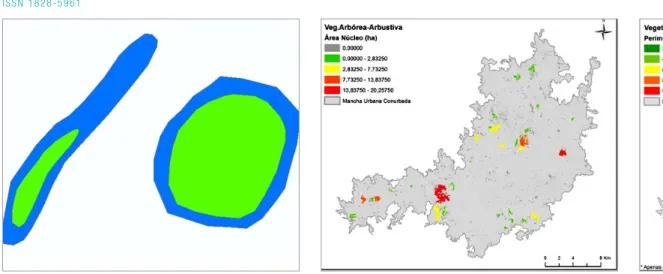
3.4.2. CORE AREA
Core area represents the internal spaces of spatial units, meaning, it is based on identifying a greater core possible, from the edge’s distance. (Figure 11).
The edge distance should be indicated by the researcher and, for conservation biology, it is based on the animals’ behavior or vegetation sensitive to edge effect. The use of these metrics, in general, presupposes that edge sectors are influenced by certain effects coming from exterior areas, and which; as a consequence, in the internal sector other conditions are
predominant. In animal ecology it is interesting for the work with species sensitive to edges. The analysis of core-areas must take into account a preference for certain spaces, considering a certain distance from the edge (Lang and Blaschke, 2009).
In urban environments, the same logic can be applied for specific preservation areas, such as forest gardens. However, it is important to say that this kind of interpretation focuses in the ability to aid fauna and flora, within a preservationist frame of mind, not in the search for spaces with multiple uses.
This metric’s result indicates the level of cohesion of vegetation fragments and, therefore, its stability levels. Fragments of greater core-area indicate areas of more preserved ecological relations. These areas may be interpreted as high potential zones for influencing its surrounding and may be considered as the “heart” of the green spaces system, since they are a greater gene source. This result reinforces vegetation fragment hierarchies, especially the ones to be preserved for reminiscent biodiversity maintenance. For this paper’s case
study, we focus on expressive vegetation, once low vegetation areas present more accessibility and require less preservation.
To compute this metric, a user must inform edge distance value, so that a fragment comprises core-area. We used a 70m value, since it corresponds to the approximate block radius of Belo Horizonte municipality, averaging 10000m². The class division follows the same criteria used for area’s metric presentation. However, fragments with no core-area were set aside (core-area 0,00ha), in order to highlight the others. (Figure 12).
The result confirms the importance of preserving great fragments of arboreal-shrubbery vegetation, for biodiversity maintenance. In order to propose a green spaces system, fragments with core-area above 2,8325ha were considered most suitable for environmental preservation.
3.4.3. RELATION PERIMETER/AREA
The relation perimeter/area, in general, may be used as an index for shape complexity: the higher a fragment’s perimeter (regarding its area), more
ISSN 1828-5961 Landscape morphology metrics for urban areas
this fragment distances from a stable shape (circle). This means, fragments with stretched shapes or with many ramifications present large perimeters and small area, what makes it more complex, as showed (Figure 2).
For ecologic studies, this metric is used to analyze the level of landscape fragmentation, seeking to identify more degraded areas and areas more susceptible to edge effects, which is not desirable for certain species. However, when considering urban spaces, a high perimeter/area index can be taken as positive, since it represents a high exchange (with its surroundings) potential. These fragments present greater accessibility and are easier to transpose, and can be used as free common use spaces, generating social and environmental benefits, by means of penetrable areas maintenance.
Considering our proposed goal, in the first approach, only large fragments are interpreted and with greater potential for composing a regional system. It is important to bring out that result comparison of perimeter/area relations for one of more fragments is only possible when similar area fragments are considered. The
reason for this is that there is not a constant formula value, meaning, when area is increased, the value perimeter/area diminishes.
Thusly, only low vegetation fragments with area above 97,4051ha were studied. (Figure 13). The analysis of this result, along with satellite images, demonstrates that larger and more complex fragments are composed of road vegetation and intra-blocks vegetation. Therefore, it is interesting to motivate this area’s use not only for free public use, but also for maintenance of penetrable areas and creation of green corridors.
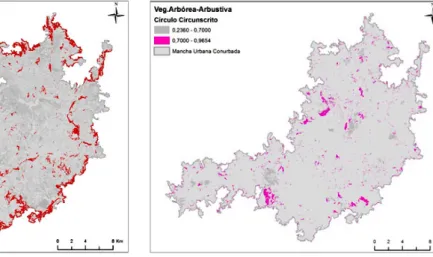
3.4.4. CIRCUMSCRIBED CIRCLE
This is a simple compacting metric. It corresponds to the greater circumscribed circle within a shape. It is obtained by a spin in its own gravity axial. More elevated values correspond to long forms, however presenting low fragment compaction. More compact fragments, with shapes more similar to a square or a circle, present low value (Lang e Blaschke, 2009; McGarigal et. al., 2002). The figure below shows how this metric is calculated and the difference
between high and low results. (Figure 14). The result can be considered an index for fragment linearity, which contributes to visualize areas with potential for green corridors. Due to detailed resolution for worked data, a simple division in classes has not generated pertinent results, since the majority of fragments present long, fragmented and linear structures. In this case, testing was necessary to interpret which values respond for the total’s main linear elements, both for low as for arboreal-shrubbery vegetation. Low vegetation presented main linear fragments with 0.87 of index (value without defined measurement unit). (Figure 15). It is observed that there are large linear elements, with great potential for green corridors.
For arboreal-shrubbery vegetation fragments, we applied the same investigation principals, in order to identify values corresponding to linear fragments. The result was 0,70. (Figure 16). As can be seen, linear elements are more expressive in low vegetation, while arboreal-shrubbery vegetation is predominant in smaller linear areas. These areas can be transformed into small linear parks, of easy access for the
ISSN 1828-5961 Landscape morphology metrics for urban areas
population, disperse throughout the territory, and in greater quantity then larger parks. A few of these fragments of arboreal-shrubbery vegetation were separated due to their long shapes, however they will be considered by other types of uses in the final syntheses. 4. RESULTS AND DISCUSSIONS: PROPOSAL OF A GREEN SPACES SYSTEM
A city’s green spaces must be considered as a system, transcending the simple idea of sparse and unconnected pieces. This is the goal of working with landscape metrics: to diagnose spaces in need for vegetation and those with potential to be integrated into the system. The desire is that there is an interaction between them, favoring exchange, to ecologic and social fluxes.
From using landscape metric, it was possible to undertake a diagnostic of the existing vegetation cover, and, from the produced data, we identified potential areas for several uses, from pre-established premises. These momentary definitions are only a trial of this methodology’s potential. Below, a proposal of potential areas
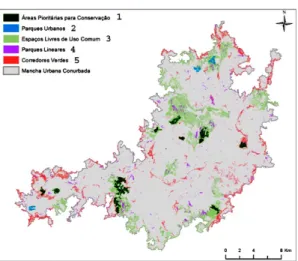
to be inserted in a large green spaces system is presented. (Figure 17).
The use of metrics offers a diagnostic of the analyzed landscape, aiming to identify, for example, the use potential from fragment morphology of arboreal-shrubbery and low vegetation. Mapped possibilities are:
(1) Priority areas for conservation: areas
composed of vegetation fragments, of arboreal-shrubbery vegetation, with core-areas in values higher than the other fragments’ average. They differ from the other fragments, for the possibility they offer as fauna refuges and floral biodiversity, in an urban context;
(2) Urban Parks: fragments of
arboreal-shrubbery vegetation, with significant areas, which do not present large core-areas and, therefore, present some degree of fragmentation. Since urban parks present a greater relation between perimeter/area then priority areas for conservation, they have higher population use potential, due to greater accessibility and contact with its surroundings;
(3) Free and common use spaces: great areas
with the presence of low vegetation. They hold great use potential by population, since they present great dispersion throughout the territory and high accessibility. The absence of expressive vegetation favors interventions, appropriations, and transformations in space. These are distributed mainly throughout streets and backyards, and may also fulfill functions of green corridors, favoring gene, material and energy fluxes;
(4) Linear parks: small arboreal-shrubbery
vegetation fragments with linear and long shapes dispersed throughout the territory. They present potential for constituting themselves in small pulverized parks, with infrastructure for population use. They also may serve as steppingstones, or small points of fauna refuge, especially for birds;
(5) Green corridors: large long fragments, linear,
composed of low vegetation. They may fulfill functions also of linear parks, favoring fluxes, especially of people. They may be used as an alternative for urban mobility, by creating
Figure 14 – Circumscribed Circle calculation, with high (left) and low (right)
ISSN 1828-5961 Landscape morphology metrics for urban areas
cyclist and walking tracks. 5. CONCLUSIONS
There are many forms of interpreting and working with landscape metric results. It is interesting to complement investigations with studies on exiting or potential functions in fragments.
The analysis of natural landscapes, in preserved environments, is favored, since natural ecosystems’ dynamics are more easily identified then complex social processes within urban grid. Morphology of existing fragments within an urban cluster holds great quantities of information, materialized throughout the years, by agents who have acted in that space. Therefore, with a clear definition of functionalities, landscape analysis methodology with two-dimensional resources, as landscape metrics, still presents high value for landscape planning. Especially landscapes in wide regional scales (since resources of geoprocessing and remote sensing) make possible to work with an intense data volume, referent to large areas, and generating a wider view of the whole.
It is worth mentioning the need to produce studies which evaluate small areas and their dispersion throughout the territory, measuring, for instance, their isolation levels, and their relations with aid ability. The next step, that is planned to be developed by us, is to choose de level of smaller fragments, to understand the factors of inclusion and equilibrium in urban occupation, even in particular lots. The argument that we defend is that the greater parks and green areas are very important to urban territory in a whole sense, especially for environmental aspects, but the citizens don’t have time and opportunity to visit them constantly. So, the smaller fragments represented by the individual properties, in backyards and lots, can be of interests to a public politics.
When we mention public politics, it means those decisions defined as interesting by the citizens, which can agree to give benefits to the maintenance of some individual properties that keeps the vegetation cover. In this case, the metrics to be studied are those related to connectivity (Euclidean distance) and form factors related to the integration with the urban
aggregation (the perimeter/area factor and form linearity). The aspects to be observed are those of form and function of the fragments. This case study’s result is considered satisfactory, since the premises used regarding space-function of vegetation fragments made possible to map occurrences meeting contemporaneous tendencies in green spaces planning.
Figure 17 – Green spaces system proposal. (1) - Priority areas for conserva-tion. (2) - Urban Parks. (3) - Free and common use spaces. (4) - Linear parks. (5) - Green corridors.
ISSN 1828-5961 Landscape morphology metrics for urban areas
BIBLIOGRAFIA
Bessa, Altamiro, (2012), Os espaços livres e a esfera da vida pública, in Costa, Oficina da Biodiversidade Urbana, Universidade Federal de Minas Gerais, Belo Horizonte. Couto, Paula, (2004), Análise factorial aplicada a métricas da paisagem definidas em Fragstats. Investigação Operacional, Vol., 24, N°1, páginas. 109-137. Available: <http://www.scielo.oces.mctes.pt/ pdf/iop/v24n1/24n1a07.pdf>. Ac-cess: 10th feb. 2010.
Eco, Umberto, (1989), A obra ab-erta, Perspectiva, São Paulo [Opera aperta].
Falcón, Antoni. (2007), Espacios verdes para una ciudad sostenible: planificación, proyecto, manten-imiento y gestión, Pili, Barcelona. Forman, Richard. T. T., Gordon, Mi-chael, (1986), Landscape Ecology, John Wiley & Sons, New York. Haines-Young, Roy; Green, David R.; Cousin, Steven, (1993), Landscape
Ecology and GIS, Taylor & Francis, London.
Lang, Stefan; Blaschke, Thomas, (2009), Análise da paisagem com SIG. Oficina de Textos, São Paulo. Leitão, André Botequilha et al., (2006), Measuring Landscapes: a planner’s handbook, Island Press, Washington.
McGarigal, Kevin; Cushman, Sam A.; Neel, Maile C.; Ene, Eduard, (2002), Fragstats: Spatial Pattern Analysis Program for Categorical Maps, in Computer software pro-gram produced by the authors at the University of Massachusetts, Amherst. Available: <www.umass. edu/landeco/research/fragstats/ fragstats>. Access: 15th nov. 2009. Metzger, Jean Paul, (2001), O que é Ecologia de Paisagens?, in Biota Neotrópica. 1(1), pp. 1-9. Moura, Ana Clara, (2010), Aplica-ções de modelos de mensuração de métricas de paisagem nos estudos da dinâmica de ocupação urbana no Quadrilátero Ferrífero e Região
Metropolitana de Belo Horizonte – MG, in Anais do XXIV Congresso Brasileiro de Cartografia, Instituto Nacional de Pesquisas Espaciais, pp. 1545-1554.
Santos, Alexandre Rosa dos; Peluzio, Telma Machado de Oliveira; Saito, Nathália Suemi, (2010), SPRING 5.2.1: Passo a passo, aplicações práticas, CAUFES, Porto Alegre. Turner, Monica Goigel; Gardner, Rob-ert H., (1991), Quantitative Methods in Landscape Ecology, Springer, New York.