improvement in the Synthesis
conditions and Studying the
physicochemical properties of the
Zeolite Li-A(BW) obtained from a
Kaolinitic Rock
Daniela novembre
1*, Domingo Gimeno
2& Alessandro Del Vecchio
1crystallization of zeolite Li-A(BW) from kaolinite (Standard porcelain by the iMeRYS Minerals Ltd) through a conventional hydrothermal treatment is here achieved for the first time with no additives as reported in the literature. Moreover lower kaolin calcination temperatures and lower synthesis temperatures are tested and verified in this work. The synthesis process is rather simple as the reaction of kaolinite with alkali occurs very readily after calcination of at 650 °C. Metakaolin is mixed with calculated amount of aluminum hydroxide and lithium hydroxide and the experiment is performed at ambient pressure and 180 ± 0.1 °C. Li-A(BW) is characterized by powder X-ray diffraction, high temperature X-ray diffraction, scanning electron microscopy, inductively coupled plasma optical emission spectrometry, thermal analysis and infrared spectroscopy. calculation of cell parameters (through Rietveld Refinement) and density, specific surface and pore size are also achieved. The amount of amorphous phase in the synthesis powders is estimated with quantitative phase analysis using the combined Rietveld and reference intensity ratio methods. The results become notably attractive in view of a possible industrial transfer of the synthesis protocol.
Zeolites are a group of tectosilicates of about 50 minerals with synthetic analogues. Their structure is made of three-dimensional networks of Al/Si tetrahedra arranged to form channels containing water and exchangeable alkaline or alkaline earth cations.
Zeolite Li-A(BW) is a synthetic low silica zeolite, which possesses the ABW framework topology. Low silica zeolites such as Li-A(BW), are widely involved in several technological applications, such as ion exchangers, adsorbents and catalysts, in radioactive-waste water treatments, sewage effluent treatments, agricultural-waste water treatments, as materials for ferroelectric devices1.
Zeolite Li-A(BW) was first synthesized by Barrer and White2 and the framework structure and water
posi-tions were later determined by Kerr3 by X-ray powder diffraction (Pna2
1, a = 10.31, b = 8.18; c = 5.00 Å). Krogh
Andersen & Ploug-Sorensen4 confirmed this structure by X-ray single crystal refinement and later Norby et al.5
gave the lithium and hydrogen positions by neutron powder diffraction. From the above structural investigations, it results a framework characterized by 4-, 6-, and 8-rings of TO4 tetrahedra and a fully ordered Si/Al distribution.
The result is a zig-zag chain of 4-rings running along the c- axis. These chains are linked together, forming 8-ring channels, in which water molecules and lithium ions are situated.
Li-A(BW) is characterized by limited reversible rehydration5 and undergoes to a displacive transition
col-lapsing into the anhydrous phase γ-eucriptite at 650 °C6. The response to compression of Li-A(BW) zeolite was
explored by synchrotron X-ray powder diffraction experiments in the range Pamb-8.9 GPa resulting in a cell
vol-ume decrease of 12%7.
1Dipartimento di Ingegneria e Geologia, Università di Chieti-Pescara, Via dei Vestini 30, 66013, Chieti, Italy. 2Department Mineralogia, Petrologia i Geologia Aplicada, Universitat de Barcelona, 08028, Barcelona, Spain. *email:
open
Synthesis of Li-A(BW) zeolite was performed in the past by the use of lithium hydroxide, aluminum hydrox-ide ad silica gel2,8; Andrade et al.9 added also a tetramethylammonium hydroxide as structure directing agent.
Norby et al.6 and Dong et al.10 prepared the precursors gels using zeolite NaA and lithium chloride.
The large demand for low silica zeolites, due to their great technological potential, has led researchers to look for less expensive starting materials in order to obtain economically beneficial industrial results. In the light of reducing synthesis costs Yao et al.11 synthesized Li-A(BW) by fusion method using fly ash as raw material.
Another attempt at synthesis of zeolite Li-A(BW) was carried out starting from kaolinite12. Among clay
minerals, in fact, Kaolinite is the most common phyllosilicate involved in successful zeolitic synthesis because of its particularly ample supply and availability and the well-known reactivity of thermally treated kaolin clays (metakaolin) with alkali13–17.
Lin et al.12 synthesized JBW, CAN, SOD and Li-A(BW) by the hydrothermal transformation of China
meta-kaolin in the presence of inorganic additives. Synthesis of Li-A(BW) was operated starting from meta-kaolin and lithium hydroxide; optimal condition for the synthesis were: calcination temperature of kaolin, 800 °C, synthesis temperature of 200 °C, reaction period of 96 h and molar composition in reactant of 1Al2O3-2SiO2-1.5Li2O-31H2O.
In this paper we present the results of a research carried out to define the most favorable conditions for the synthesis of zeolite Li-A(BW) from metakaolin. The aim is to improve previous mineral synthesis attempts start-ing from kaolinite; i.e. by developstart-ing a synthesis protocol that does not include the use of additives and secondly working on the reduction of calcination and synthesis temperatures and on the reduction of synthesis times. Here for the first time an in-depth physico-chemical characterization of zeolite Li-A(BW) synthesized from meta-kaolinite is reported. Moreover, the synthesis of minerals starting from natural rocks can lead to final prod-ucts that can be characterized by various degrees of impurities12 deriving from the starting material in fact used.
For this purpose, in this work the degree of purity of the synthesized zeolite is defined through a quantitative phase analysis using the combined Rietveld and reference intensity ratio methods.
Materials and Methods
The kaolin sample used in the present study is Standard Porcelain from IMERYS MINERALS LTD (Cornwall, UK). For the chemical composition of kaolin and its mineralogical, morphological and spectroscopic character-ization, see Novembre et al.16,18. Preliminary calcination of kaolin was carried out using the following procedure:
aliquots of kaolin were placed in open porcelain crucibles which were heated in a Gefran Model 1200 furnace (GEFRAN SPA, Brescia, Italy) to the calcination temperature of 650 °C ±1° at a pressure of 1 atm. The heating rate of the sample was 1.5 °C s−1. Once the calcination temperature was reached, the crucibles were left in the furnace
for 2 h and then removed and cooled at room temperature.
The Al(OH)3 and LiOH pellets used in the synthesis protocol were purchased from HONEYWELL
RIEDEL-DE HAËN (HONEYWELL RIEDEL-DE HAËN, Bucharest, Romania). The purity of the reagents was of 99%.
1.35 g of LiOH pellets have been dissolved in 22 ml of distilled water. 0.8 g of Al(OH)3 (65%, p/v) and 3.10 g of kaolin were mixed with the LiOH solution. The initial mixture had the composition: 1.75 SiO2-1 Al2O3-1,75
LiO2-1,26 H2O.
The mixture was homogenized for two hours with a magnetic stirrer. Then was put inside a stainless-steel hydrothermal reactor and heated at 10 °C/min until 190 °C and kept for 2, 6, 15, 30 and 140 h. Synthesis products were sampled periodically from the reactor, filtered with distilled water and dried in an oven at 40 °C for a day.
Kaolin and products of synthesis were analysed by powder X-ray diffraction (XRPD); the instrument was a SIEMENS D5000 operating with a Bragg-Brentano geometry (CuKα = 1.518 Å, 40 kV, 40 mA, 2–45°, 2–90° 2theta scanning interval, step size 0.020° 2theta). Identification of Li-A(BW) and relative peak assignment was performed with reference to the following JCPDS code: 00-041-0554.
Both the crystalline and amorphous phases in the synthesis powders were estimated using quantitative phase analysis (QPA) applying the combined Rietveld and reference intensity ratio (RIR) methods; corun-dum NIST 676a was added to each sample, amounting to 10%, and the powder mixtures were homogenized by hand-grinding in an agate mortar19. Data for the QPA refinement were collected in the angular range 5–120°
2theta with steps of 0.02° and 10 s step−1, a divergence slit of 0.5° and a receiving slit of 0.1 mm.
Data were processed with the GSAS software and the graphical interface EXPGUI20,21 starting with the
struc-tural models proposed by Krogh Andersen and Ploug-Sorensen4 for Li-A(BW). The following parameters were
refined: background parameters, zero shift, cell parameters and peak profiles.
Morphological analyses were obtained by means of scanning electron microscopy (JEOL JSM-840 served by a LINK MICROANALYSIS EDS system, with operating conditions of 15 kV and window conditions ranging from18 to 22 mm)22.
Induced coupled plasma optical emission spectroscopy technique (ICP-OES, PERKIN ELMER OPTIMA 3200 RL) was performed on synthesized powders through previous fusion (Pt meltpot) in lithium meta-tetra borate pearls and subsequent acid solubilisation and analytical determination23.
Li-A(BW) density was calculated by He-picnometry using an ACCUPYC 1330 pycnometer. The specific sur-face and porosity were obtained by applying the BET (BRUNAUER-EMMETT-TELLER) method with N2 using
a MICROMERITICS ASAP2010 instrument (operating from 10 to 127 kPa)19.
The infrared analysis was performed with a spectrometer FTLA2000, served by a separator of KBr and a DTGS detector; the source of IR radiation was a SiC (GLOBAR) filament. Samples were treated according the method of Novembre et al.24 using powder pressed pellets (KBr/sample ratio of 1/100, pressure undergone prior
determi-nation 15 t/cm2); spectra were processed with the program GRAMS-Al (THERMO SCIENTIFIC COMPANY).
Thermal stability and phase transformations were studied using high-temperature X-ray diffractometry with a PANALYTICAL X’PERT PRO MPD (CuKα = 1.518 A °, 45 kV, 40 mA, X’CELERATOR DETECTOR with active
length of 2.122 °, θ/2θ scan from 5 to 50° 2θ with step size of 0.017° and measuring time of 100 seconds per step), equipped with a high temperature camera ANTON PAAR HTK1200N (thermocouple Pt 10% RhPt). The sam-ple holder was a platform with a 16 mm diameter equipped with a ceramic cup (0.8 mm deep and 14 mm inner diameter) for holding powder. The analyses were taken at different temperatures: from 28° up to 1200 °C, every 100 °C. Slope was 10 °C/min. The program pakage GSAS - EXPGUI was used for the calculation of cell parame-ters, using the Rietveld full-profile method starting with the structural models proposed by Krogh Andersen and Ploug-Sorensen4 for Li-A(BW), and Norby6 for γ-Eucryptite and β-Eucryptite.
Differential thermal analysis (DTA) and thermogravimetry (TG) were performed on the zeolitic powder using a Mettler TGA/SDTA851e instrument (10°/min, 30_1100 °C, sample mass of ~10 mg, Al2O3 crucible) (METTLER
TOLEDO, GREIFENSEE, SWITZERLAND25.
Results
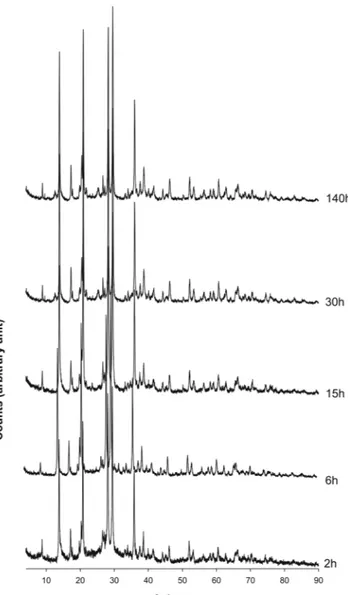
Results of XRPD analyses performed on the synthesis run are illustrated in Fig. 1. Appearance of Li-ABW phase begins at about 2 h. The existence field of the Li-A(BW) zeolite is very large, in fact the phase remains isolated up to 140 hours.
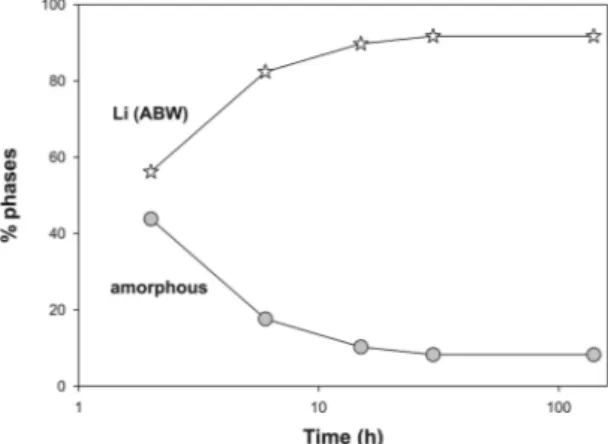
Results of the QPA analyses conducted on samples at 2, 6, 15, 30 and 140 h are reported in Table 1. Figure 2
illustrates the volume or weight fractional changes in the participating phases as a function of time. About 50% of the crystallization of the Li-ABW zeolite takes place in the first two hours of the synthesis run. The zeolitic per-centage increases over time to the detriment of the amorphous component and reaches its climax at 30 hours. In fact, subsequently the trend of the graph becomes horizontal up to 140 hours. So the climax in the crystallization of the zeolite is reached at 30 h and the sample is dominated by the presence of Li-A(BW)zeolite (91.75%).
For the sample at 30 h the observed and calculated profiles and difference plots for LiABW and corundum NIST 676a are reported in Fig. 3. Cell parameters of Li-A(BW), refined with orthorombic simmetry space group
Pna21, are reported in Table 2. Cell parameters remain constant within error as a function of the experimental
run time.
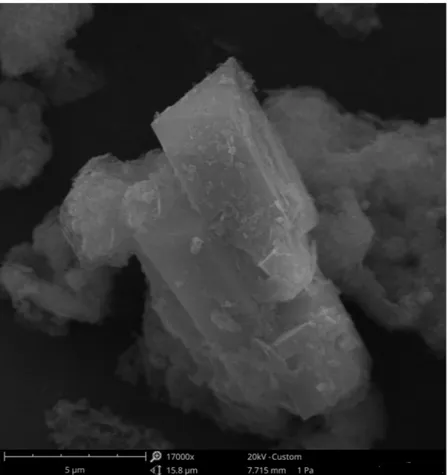
Further characterizations have been performed on the sample at 30 h. Figure 4 reports a SEM image of Li-ABW crystals from this sample with a column like morphology, with an average maximum length of crystals observed to be around 6.5 µm. Chemical analysis resulted in the stoichiometry of (Li
3.98)(Al4.03Si3.98)O16. The density
of Li-A(BW) from this sample was determined to be 2.176(9) g/cm3, and the average volume of 0.115(9) cm3.
Figure 5 illustrates the infrared spectrum of sample at 30 h. The significant broad peaks are located at 3620– 3440 and 1592 cm−1 for O-H stretching and bending, respectively. The bands at 981, 989 and 922 cm−1 are
assigned to the asymmetric stretching vibration of Si-O-Si bond within SiO4. The bands at 697 and 602 cm−1 are
attributed to Si-O-Si symmetric stretching vibration. Data are coherent with those available in the literature5,11.
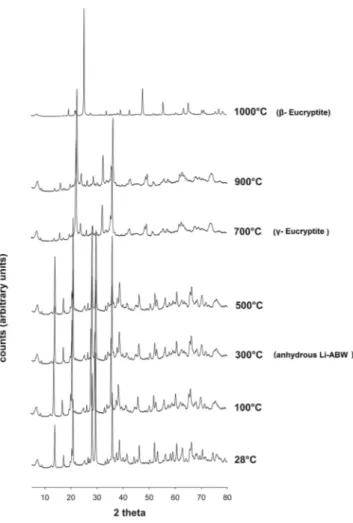
The study of thermal incidence on phase evolution has been completed with x-ray diffractometry at high temperature (Fig. 6). Progressive changes can be seen in the PXRD pattern of Li-A(BW) with increasing temper-ature and associated not only to the removal of water but also to polymorphic changes. No amorphous phases are evidenced in these transformation processes. A major change is visible in the xrd spectrum at about 300 °C which
sample 2h 6h 15h 30h 140h Wavelenght (Å) 15.418 15.418 15.418 15.418 15.418 No. of observation 7574 7543 7428 7857 7605 Rwp 0.15 0.15 0.19 0.18 0.17 Rp 0.11 0.11 0.14 0.14 0.13 CHI2 1.78 1.64 2.51 2.41 2.23 % amorphous 43.82 (11) 17.64 (8) 14.24 (13) 8.25 (7) 8.25 (17) % Li-ABW 56.17 (14) 82.36 (8) 85.75 (18) 91.75 (9) 91.75 (14)
Table 1. Results of the QPA analyses conducted on samples at 2, 6, 15, 30 and 140 h.
Figure 2. Weight fractional changes of phases as a function of time.
Figure 3. Rietveld refinement plot: Observed (+) and calculated profiles and difference plt for Li-A(BW)
zeolite and corundum NIST 676a with tick marks at the position of the Bragg peaks. From the bottom: Li-A(BW) zeolite, curundum NIST 676a.
testifies the transition to anhydrous Li-A(BW). Passing from the zeolite Li-A(BW) to the anhydrous zeolite Li (ABW) we can appreciate a slight contraction of the a- and c-axes while a modest contraction of the elementary cell appears more evident for the parameter b passing from 8.104 Å to 7.034 Å (see Table 3). Another change in the xrd spectrum is visible at about 700 °C and related to the transition to γ-eucryptite; the space group changes in R-3. Final transformation in β-eucryptite is evidenced in the spectrum at about 1000 °C with a new change in the space group (P6422). There is good agreement with data by Norby6 who testifies these transformation for a
Li-A(BW) prepared hydrothermally from zeolite 4 A and LiCl; the author fix the transformation into anhydrous Li-A(BW) at 300 °C, the passage at γ-eucryptite at about 650 °C and the final transformation in β-eucryptite at 900–1000 °C. Li - ABW Pna21 a (Å) 10.3372 (34) 2h b (Å) 8.1971 (12) c (Å) 5.0111 (18) a (Å) 10.3322 (38) 6h b (Å) 8.2022 (14) c (Å) 5.0093 (15) a (Å) 10.3107 ((29) 15h b (Å) 8.2013 (16) c (Å) 5.0082 (19) a (Å) 10.3104 (33) 30h b (Å) 8.2018 (16) c (Å) 5.0082 (17) a (Å) 10.3124 (36) 140h b (Å) 8.2012 (12) c (Å) 5.0073 (17)
Table 2. Cell parameters of Li-A(BW) zeolite at different time sas desumed by Rietveld analysis.
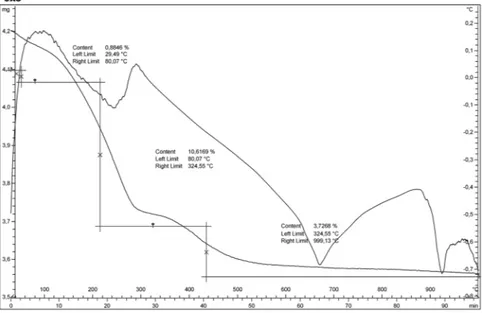
Thermogravimetric analysis conducted on sample at 30 h revealed a gradual and continuous water loss up to 1000 °C (Fig. 7). In particular, it indicates a three-stage mass loss. At the first stage, c.a. 0.88% loss occurred at about 80 °C; this was reasoneable due to the loss of the adsorbed and occluded water molecules in the zeolite crys-tals. The second stage occurred between 80° and 324 °C with a mass loss of 10,61%; the third is evidenced between 324° and 1000 °C and associated to a mass loss of 3,72%.
Figure 5. IR spectrum of the zeolite Li-ABW at 30 h.
The endothermic peaks revealed by the DTA curve are in agreement with findings of high temperature X ray diffraction and allow the temperatures of the transformations to be fixed more precisely. The peak at about 250 °C reflects the dehydration process following the structural collapse of the phase (anhydrous Li-ABW). This is con-firmed by tg measurements where at the initial weight loss of about 0.88% follows a major weight loss of 10.61% correlated to the cell contraction. Further heating of anhydrous Li-A(BW) results in the formation of γ-eucriptite at about 665 °C as visible in the endothermic peak of Fig. 6. The sharp endothermic peak at 922 °C is due to the transformation of γ-eucriptite to β-eucriptite. In our case there is an excellent correspondence between the data of the high temperature x-ray diffractometry and the thermal ones. In fact all the transformations shown by dif-fractometry are matched by endothermic peaks present in thermal curves. Norby6 for example, does not highlight
the endothermic peak related to the transition from anhydrous zeolite Li-A(BW) to the γ-eucriptite. On the other hand, Yao et al.11 does not show the endothermic peak at about 900 °C, saying that the structure of γ-eucriptite is
stable up to that temperature.
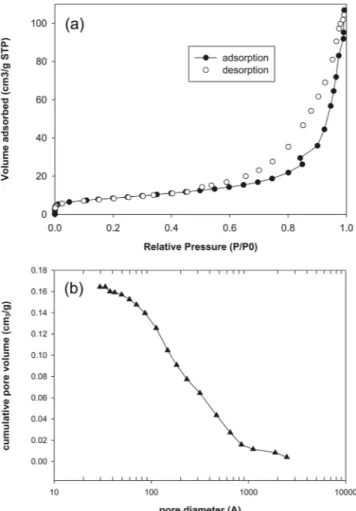
Figure 8a shows the N2 adsorption-desorption plots at 77 K for zeolite Li-A(BW). There is evidence of a
hys-teresis loop indicating the presence of mesopores; the vertical hyshys-teresis loop indicates cylindrical mesopores, as just observed for this zeolite by Yao et al.11. The sample evidences a monomodal pore average size distribution
with maximum value 29.6 Å (Fig. 8b).
conclusion
This work describes the synthesis of zeolite Li-A(BW) using a kaolinitic rock. Appearance of Li-A(BW) phase begins at about 2 h of the synthesis run. The existence field of the Li-A(BW) zeolite is very large, in fact the phase remains isolated up to 140 hours. An in-depth characterization of zeolite Li-A(BW) synthesized. The chemical-physical, morphological and spectroscopic characterization of experimental products proved the effi-cacy of the experimental procedure proposed here.
When our results are compared with those of other authors who have synthesized the same zeolite starting from a natural precursor, an improvement in the quality of crystalline products and a reduction of the calcination temperature of kaolinite, of synthesis temperature, and crystallization times is evident. Lin et al. in fact operate a calcination temperature of kaolinite of 800 °C, while we reduced it to 650 °C. Moreover, the same authors synthe-tize the zeolite at 200 °C, while in this paper there is a reduction to 180 °C. In addition, here the synthesis protocol does not include the use of additives. Another substantial difference between our work and that of Lin et al. lies in the effective assessment of the degree of success of the experiment from calculation by QPA of the percentage
temperature
(°C) a (Å) b(Å) c (Å) β(°) space group
Li-ABW 28 10.347 (2) 8.104 (1) 5.011 (3) Pna21
Li-ABW anhydrous 300 10.012 (2) 7.034 (2) 5.007 (1) Pna21
γ-eucryptite 700 8.255 (2) 5.084 (1) 8.159 (3) 103.443 (2) R-3 β-eucryptite 1000 10.503 (2) 10.503 (2) 11.153 (2) P6422
Table 3. Cell parameters for Li-A(BW), anhydrous Li-A(BW), γ-eucriptite and β-eucriptite.
of crystallization vs. amorphous material and other impurities. The industry requires at least 90% pure products. And our powders reach 91.75% purity; this means that are valid results in order to try an effective transference to the productive scale. Moreover, Lin et al. only offers morphological and nuclear magnetic resonance characteriza-tions for this zeolite synthesized from kaolinite. This work provides a full spectrum of physico-chemical analysis in order to characterize the synthesis products. The results of the QPA analyses and the wide temporal range of stability of this zeolite suggests that transfer to an industrial production scale would be possible.
Received: 15 January 2020; Accepted: 17 March 2020; Published: xx xx xxxx
References
1. Fois, E., Gamba, A., Tabacchi, G., Quartieri, S. & Vezzalini, G. Water Molecules in Single File: First-Principles Studies of One-Dimensional Water Chains in Zeolites. J. Phys. Chem. B 105, 3012–3016 (2001).
2. Barrer, R. M. & White, E. A. D. The Hydrothermal Chemistry of Silicates. Part I. Synthetic Lithium Aluminosilicates. J. Chem. Soc.
283, 1267–1278 (1951).
3. Kerr, I. S. Crystal structure of a synthetic lithium zeolite. Z. Kristallogr. 139, 186–195 (1974).
4. Krogh Andersen, E. & Ploug-Sorensen, G. The structure of zeolite Li-A(BW) determined from single crystal data. Z. Kristallogr. 176, 67–73 (1986).
5. Norby, P., Christensen, A. N. & Krog Andersen, I. G. Hydrothermal Preparation of Zeolite Li-A(BW), LiAlSiO4.H2O, and Structure
Determination from Powder Diffraction Data by Direct Methods. Acta Chem. Scand. A 40, 500–506 (1986).
6. Norby, P. Thermal transformation of zeolite Li-A(BW). The crystal structure of γ-eucryptite, a polymorph of LiAlSiO4. Zeolites 10,
193–199 (1990).
7. Fois, E. et al. High pressure deformation mechanism of Li-ABW: Synchrotron XRPD study and ab initio molecular dynamics simulations. Micropor. Mesopor. Mat. 115, 267–280 (2008).
8. Aiello, R., Barrer R. M. & Kerr, S. Stages of Zeolite Growth from Alkaline Media. Adv. Chem Ser 101, Molecular Sieve Zeolite I, 44–50 (1974).
9. Andrade, E. et al. Ion Beam Analysis of zeolites type Li-A(BW) synthesized by hydrothermal method. Rev. Mex. Fis. S 56(1), 58–61 (2010).
10. Dong, J., Wang, X., Xu, H., Zhao, Q. & Li, J. Hydrogen storage in several microporous zeolites. Int. J. Hydrogen Ener. 32, 4998–5004 (2007).
11. Yao, Z. T., Xia, M. S., Ye, Y. & Zhang, L. Synthesis of zeolite Li-ABW from fly ash by fusion method. J. Hazard. Mater. 170, 639–644 (2009).
Figure 8. (a) Nitrogen adsorption-desorption isotherms of the zeolite Li-A(BW) and (b) corresponding pore
12. Lin, D. C., Xu, X. W., Zuo, F. & Long, Y. C. Crystallization of JBW, CAN, SOD and ABW type zeolite from transformation of meta-kaolin. Micropor. Mesopor. Mat. 710, 63–70 (2004).
13. Novembre, D., Di Sabatino, B. & Gimeno, D. Synthesis of Na-A zeolite from 10 Å halloysite and a new crystallization kinetic model for the transformation of Na-A into HS zeolite. Clay. Clay Miner. 53(1), 28–36 (2005).
14. Novembre, D., Gimeno, D., Pasculli, A. & Di Sabatino, B. Synthesis and characterization of sodalite using natural kaolinite: an analytical and mathematical approach to simulate the loss in weight of chlorine during the synthesis process. Fresen. Environ. Bull.
19(6), 1109–1117 (2010).
15. Novembre, D., Pasculli, A., Pace, C., Gimeno, D. & Di Sabatino, B. Synthesis of sodalite from natural kaolinite. A way to simulate the loss in weight of chlorine during synthesis process by an analytical and mathematical modelling. Rend. Online Soc. Geol. It. 11(2), 548–549 (2010).
16. Novembre, D., Di Sabatino, B., Gimeno, D. & Pace, C. Synthesis and characterization of Na-X, Na-A and Na-P zeolites and hydroxysodalite from metakaolinite. Clay Miner. 46, 336–354 (2011).
17. Novembre, D., Gimeno, D., d’Alessandro, N. & Tonucci, L. Hydrothermal synthesis and characterization of kalsilite by using a kaolinitic rock from Sardinia, Italy, and its application in the production of biodiesel. Mineral. Mag. 82(4), 961–973 (2018). 18. Novembre, D. & Gimeno, D. The solid-state conversion of kaolin to KAlSiO4 minerals: the effects of time and temperature. Clays and
Clay Min. 65(5), 355–366 (2017).
19. Novembre, D., Gimeno, D. & Poe, B. Synthesis and Characterization of Leucite Using a Diatomite Precursor. Sci. Rep. 9, 10051–10061 (2019).
20. Larson A.C. & Von Dreele, R.B. Document Laur 86-748 Los Alamos National Laboratory (1997). 21. Toby, B. H. J. EXPGUI, a graphical user interface for GSAS. Appl. Crystallogr. 34, 210–213 (2001).
22. Novembre, D., Gimeno, D. & Poe, B. Diatomite as natural precursor for the synthesis of KAlSiO4-O1. Eur. J. Mineral. 30, 1127–1132
(2018).
23. Novembre, D., Pace, C. & Gimeno, D. Synthesis and characterization of wollastonite-2M by using a diatomite precursor. Mineral.
Mag. 82(1), 95–110 (2018).
24. Novembre, D., Di Sabatino, B., Gimeno, D., Garcia Valles, M. & Martinez-Manent, S. Synthesis of Na-X zeolites from tripolaceous deposits (Crotone, Italy) and volcanic zeolitised rocks (Vico volcano, Italy). Micropor. Mesopor. Mat. 75, 1–11 (2004).
25. Novembre, D., Pace, C. & Gimeno, D. Synthesis and characterization of seolites K-F and W tupe using a diatomite precursor.
Mineral. Mag. 78(5), 1209–1225 (2014).
Acknowledgements
The authors greatly acknowledge the technical staff at CCiT (UB) for their help during the development of the work.
Author contributions
D.N., D.G. and A.D.V. wrote the main manuscript text and D.N. prepared Figs. 1–9. All authors reviewed the manuscript.
competing interests
The authors declare no competing interests.
Additional information
Correspondence and requests for materials should be addressed to D.N. Reprints and permissions information is available at www.nature.com/reprints.
Publisher’s note Springer Nature remains neutral with regard to jurisdictional claims in published maps and
institutional affiliations.
Open Access This article is licensed under a Creative Commons Attribution 4.0 International
License, which permits use, sharing, adaptation, distribution and reproduction in any medium or format, as long as you give appropriate credit to the original author(s) and the source, provide a link to the Cre-ative Commons license, and indicate if changes were made. The images or other third party material in this article are included in the article’s Creative Commons license, unless indicated otherwise in a credit line to the material. If material is not included in the article’s Creative Commons license and your intended use is not per-mitted by statutory regulation or exceeds the perper-mitted use, you will need to obtain permission directly from the copyright holder. To view a copy of this license, visit http://creativecommons.org/licenses/by/4.0/.