ScienceDirect
Available online at www.sciencedirect.com
Transportation Research Procedia 30 (2018) 275–284
2352-1465 Copyright 2018 Elsevier Ltd. All rights reserved.
Selection and peer-review under responsibility of the scientific committee of the EURO Mini Conference on “Advances in Freight Transportation and Logistics" (emc-ftl2018).
10.1016/j.trpro.2018.09.030
www.elsevier.com/locate/procedia
10.1016/j.trpro.2018.09.030 2352-1465
Copyright © 2018 Elsevier Ltd. All rights reserved.
Selection and peer-review under responsibility of the scientific committee of the EURO Mini Conference on “Advances in Freight Transportation and Logistics” (emc-ftl2018).
ScienceDirect
Transportation Research Procedia 00 (2018) 000–000
www.elsevier.com/locate/procedia
2352-1465 © 2018 The Authors. Published by Elsevier Ltd.
This is an open access article under the CC BY-NC-ND license (https://creativecommons.org/licenses/by-nc-nd/4.0/) Selection and peer-review under responsibility of the scientific committee of the EURO Mini Conference on "Advances in Freight Transportation
and Logistics" (emc-ftl2018).
EURO Mini Conference on "Advances in Freight Transportation and Logistics" (emc-ftl-2018)
Revealing urban goods movements:
empirical evidences from some European cities
Antonio Comi
a*, Luca Persia
b, Andrea Campagna
b, Antonio Polimeni
a aUniversity of Rome Tor Vergata, Department of Enterprise Engineering, Via del Politecnico 1, 00133 Rome, Italy bCentro di ricerca per il Trasporto e la Logistica, Sapienza University of Rome, Via Eudossiana 18, 00184 Rome, ItalyAbstract
The paper compares the characteristics of urban freight transport in some European cities, implementing a methodology which uses similar interviews with retailers and transport operators. The main objective of this study is to evaluate the similarities and differences in terms of socio-economic characteristics and commercial structures, and current distribution patterns followed by different transport and logistics operators. The study shows the flexibility of the methodology used in different applicative contexts and points out that there are some different patterns of urban distribution that need to be taken into account when implementing city logistics measures.
© 2018 The Authors. Published by Elsevier Ltd.
This is an open access article under the CC BY-NC-ND license (https://creativecommons.org/licenses/by-nc-nd/4.0/) Selection and peer-review under responsibility of the scientific committee of the EURO Mini Conference on "Advances in Freight Transportation and Logistics" (emc-ftl2018).
Keywords: urban goods transport; city logistics, urban goods data
1. Introduction
The city logistics measures most suited to a specific urban area should be decided and monitored through ex-ante and ex-post assessments. This process requires data on freight movements and freight demand characteristics, albeit for different purposes: to provide an understanding of delivery operations, to set up urban freight models for forecasting and monitoring the effects of policy measures. Data are essential in helping public and private sector
* Corresponding author. Tel.: +39.06.72597061; fax: +39.06.72597061
E-mail address: [email protected]
Available online at www.sciencedirect.com
ScienceDirect
Transportation Research Procedia 00 (2018) 000–000
www.elsevier.com/locate/procedia
2352-1465 © 2018 The Authors. Published by Elsevier Ltd.
This is an open access article under the CC BY-NC-ND license (https://creativecommons.org/licenses/by-nc-nd/4.0/) Selection and peer-review under responsibility of the scientific committee of the EURO Mini Conference on "Advances in Freight Transportation
and Logistics" (emc-ftl2018).
EURO Mini Conference on "Advances in Freight Transportation and Logistics" (emc-ftl-2018)
Revealing urban goods movements:
empirical evidences from some European cities
Antonio Comi
a*, Luca Persia
b, Andrea Campagna
b, Antonio Polimeni
a aUniversity of Rome Tor Vergata, Department of Enterprise Engineering, Via del Politecnico 1, 00133 Rome, Italy bCentro di ricerca per il Trasporto e la Logistica, Sapienza University of Rome, Via Eudossiana 18, 00184 Rome, ItalyAbstract
The paper compares the characteristics of urban freight transport in some European cities, implementing a methodology which uses similar interviews with retailers and transport operators. The main objective of this study is to evaluate the similarities and differences in terms of socio-economic characteristics and commercial structures, and current distribution patterns followed by different transport and logistics operators. The study shows the flexibility of the methodology used in different applicative contexts and points out that there are some different patterns of urban distribution that need to be taken into account when implementing city logistics measures.
© 2018 The Authors. Published by Elsevier Ltd.
This is an open access article under the CC BY-NC-ND license (https://creativecommons.org/licenses/by-nc-nd/4.0/) Selection and peer-review under responsibility of the scientific committee of the EURO Mini Conference on "Advances in Freight Transportation and Logistics" (emc-ftl2018).
Keywords: urban goods transport; city logistics, urban goods data
1. Introduction
The city logistics measures most suited to a specific urban area should be decided and monitored through ex-ante and ex-post assessments. This process requires data on freight movements and freight demand characteristics, albeit for different purposes: to provide an understanding of delivery operations, to set up urban freight models for forecasting and monitoring the effects of policy measures. Data are essential in helping public and private sector
* Corresponding author. Tel.: +39.06.72597061; fax: +39.06.72597061
decision makers to ensure an efficient and sustainable urban freight transport. The overall objective is to guarantee that transport systems meet society’s environmental, economic and social needs, at the same time minimizing negative repercussions on the environment, economy and society (Taniguchi et al., 2013; Russo and Comi, 2016; Russo and Comi, 2017). The rapid growth of urban freight transportation, due to changes in the supply chain (e.g. just-in-time and home deliveries) produces smaller deliveries and more frequent freight vans movements in residential areas. There are some concerns about the growing number of freight vehicles in these areas, since they contribute to congestion, air pollution and noise (environmental), and involve an increase in logistics costs, with a consequent increase of product prices (economic). In addition, a combination of different types of vehicles on the road increases the risk of accidents (social). Importantly, sustainable development objectives can be pursued by means of measures that are sometimes conflicting, and generate impacts that are influenced by the acceptance of stakeholders and external factors (Gatta and Marcucci, 2014; Comi et al., 2017). The new challenge for urban planners have to face is thus to find solutions that can reduce the impacts of urban goods mobility without penalizing the life of the city (sustainable city logistics solutions/measures).
As noted by Ogden (1992), it is not possible to make definitive comments about data requirements when studying urban freight transport. These will vary depending on the issues studied, the planning and policy framework in which the issue arises, established practice in data collection, and the availability of previous collected data. In the recent literature, the methods used for collecting data have been extensively investigated (Allen and Browne, 2008; Holguín-Veras and Jaller, 2012; Campagna et al., 2017; Hounwanou et al., 2018), even if few of the above contributions have investigated the transferability of their results in line with sustainability goals (Dablanc, 2007; Browne et al., 2007; Nuzzolo et al., 2016; Russo et al., 2016).
Some researches (Ambrosini and Routhier, 2004; Bestufs, 2008; Cirianni et al., 2013; Nuzzolo et al., 2016) found much less availability of freight data at urban level than at national level, as well as less data availability for freight than for passengers. Data at the national scale are often collected on a continuous basis, while urban data are collected within one-off projects, which are not repeated over time. This circumstance can be viewed as reflecting the somewhat limited interest of policy makers in this mobility segment. That said, data collection presents several difficulties related to costs and to the fact that information is often held by private organizations and is not made available to the public. It is therefore important to investigate the transferability of survey results in order to improve their use and to assess whether the results obtained are dependent on any particular conditions, and whether the lessons learnt in one city can be transferred to others.
In this context, since urban freight systems are complex, and cities differ in size and other characteristics, site-specific data for the development of assessment methodologies (including models) could be hard to be collected. it might thus be useful to have an outline of city similarities or dissimilarities in relation to freight transport that can be considered in the project/scenario in relation to the goals to be pursued. Since city logistics measures have to be specifically designed and assessed in order to implement the most effective, this type of framework could be an useful guideline for ex-ante assessment in order to identify, for each sustainability goal, the different classes of factors to be noted. It should also allow planners to verify whether the experimented results in a city match the results obtained in other cities in the way of defined goals.
Therefore, the paper aims to contribute to reduce the above identified literature lacks and moving from the novel paper by Nuzzolo et al. (2016) where the urban freight distribution system of three European cities were investigated. An analysis of the similarities and differences in terms of socio-economic characteristics and commercial structures, and current distribution patterns followed by different transport and logistics operators is hence presented. It thus provides the basis for classifying cities according to most suitable measures for reaching sustainability goals, too. Besides, the study shows that there are some different patterns of urban distribution that need to be taken into account when implementing city logistics measures in order to meet desired sustainability goals.
The paper is organized as follows. Section 2 recalls the results of previous similar analyses. Section 3 introduces the analyses of the cities Bologna, Poznan, Budapest and Rijeka, and provides an overview of the investigated cities in terms of demographics, business and employment, and hence describes the survey areas. Besides, Section 3 presents, for each city, a first analysis and a summary of the collected data. Finally, some conclusions and the road ahead are drawn in Section 4.
2. Previous analysis results
Nuzzolo et al. (2016) compared the characteristics of urban freight transport in Rome, Barcelona and Santander and the logistics measures being implemented in the three cities. The developed methodology was based on three similar surveys involving interviews with retailers and transport operators. The main objective of the study was to evaluate the similarities and differences in terms of spatial patterns and current regulations, socio-economic characteristics and commercial structures, freight demand characteristics and current distribution patterns followed by different transport and logistics operators.
The comparison allowed to point out a number of major findings, although the three case studies differed both in size and economic structure. The study area in Rome and Barcelona are located in the historical centre of the city, but the commercial structure is quite different, there being fewer commercial activities in Barcelona than in Rome. In Santander, the study area corresponds to a typical medium-size urban area.
As regards spatial form, the inner area of Rome is surrounded by radially distributed warehouses. Barcelona is a typical coastal city in this respect, with the study area in the centre and hence the supply areas in the north-east and south-west of the city. Santander is located longitudinally on a peninsula, with the supply areas located in the south, limiting the entry roads to the city.
Rome is the city with the strictest freight regulations, comprising access limits for vehicles, which do not comply with specific environmental standards. This is probably due to the fact that the two Spanish cities have less acute air pollution problems owing to their more favourable coastal location and climatic conditions. In this regard, new measures have been planned in Rome to take effect from 2012 to achieve higher levels of environmental sustainability. In relation to freight demand, there are major differences between retailers, which are strictly linked to the size of the cities. In the two largest cities, Rome and Barcelona, freight transport is more structured with a low share of retailers transporting on their own account. In Rome and Barcelona, this share is about 20%, while in Santander it is about double. Another difference between Santander and the two European capitals concerns the average size of deliveries, which are larger in Santander, especially in foodstuffs type. The reason for this difference is that in the Santander study area there are larger shops requiring bigger deliveries than the other two cases. On the other hand, distribution of freight type, in the Spanish cities, follows a very similar pattern, while in Rome there are also other important categories like home accessories and stationery (i.e. not daily consumption goods) due to the high presence of visitors. Finally, the average quantity per employee is quite similar in Rome and Santander.
In-depth comparison between Rome and Santander showed that the share of commercial vehicles is not strictly dependent on the size of the cities, but it is related to vehicle type (due mainly to current regulations). Santander has a higher percentage of heavy vehicles (more than 3.5 tonnes), while in Rome the lighter vehicles dominate. Analysis of freight origin shows that, in both cases, most goods come from neighboring areas outside the study area. There is also a very similar behaviour in relation to time distribution of freight, although Rome sees activity in the early afternoon, and Santander does not. The same is reflected in departure hours from the warehouses.
The first difference emerging in both cities is one of vehicle type. In the case of Santander, there are vehicles over 3.5 tonnes, light vehicles being less prevalent, as in Rome. This result is related to the fact that, within the study area in Santander, there are shops with sufficient size to require larger deliveries and hence the use of larger vehicles is preferable. This also affects the amount transported in vehicles. The greatest difference is in small vehicles (<1.5 t), which in Rome are used to transport three times more than in Santander, where there are more retailers who have their own vehicle and make only one low-quantity daily delivery.
The other difference between the two cities is related to tours. In Rome, there is a considerable percentage of tours with only one stop and hence with a small distance and temporal length. Moreover, as regards routes with two or more stops, the average travel time is slightly greater in Rome, although routes in Santander have a larger average number of stops. This confirms that in Santander loading and unloading operations are faster than in Rome.
In conclusion, the differences between Rome and Santander are primarily due to two factors. The first is city morphology: the study area in Rome has a road network with narrow streets and where space is very limited, and it favours the use of smaller vehicles. These vehicles have less capacity and necessarily require that the routes are shorter. The second reason is the regulations in each city. While Rome has two time windows and more specifics regulations (this may explain that in Rome there are deliveries in the afternoon and not in Santander), in the case of Santander
circulation is always allowed in the morning (retailers prefer to receive freight in the morning in order to reduce interference with customers). Then, the possibility of making longer tours is provided.
According to these first results, although some similarities have been found, the transferability of results in terms of sustainability issues is not direct, and city specific surveys are needed. Then, the general conclusion is that a more systemic approach has to be used in assessing city logistics trying to define a more comprehensive and no-spot surveys able to capture the characteristics of all the involved decision makers, taking into account that some features are city-specific. The campaigns for the data collection through surveys involve a large investment. Results such as those derived in the paper, can contribute to more effective and rational management of resources. Besides, the proposed analysis may be a useful pre-guide for city planners or administrations that need to ascertain whether a successful approach in one city can be transferred to another and whether the necessary conditions and organizations required for such an approach are already in place.
Furthermore, a great diversity in city logistics solutions to solve also similar traffic problems was revealed. It demonstrates that such studies are welcome because they provide a benchmark when measures have to be implemented for improving city environments. Currently, each city implements measures without considering that transport and logistics operators are not city-specific. Therefore, in the future, the uniformity of implementation may be a focus of investigation, even if different patterns of urban distribution exist and need to be point out when implementing city logistics measures.
3. Results of new analyses
Within the Interreg project Sustainable Urban Logistics PlannIng To Enhance Regional freight transport (SULPiTER), the local administrators of some cities in EU as Bologna, Poznan, Budapest and Rijeka, with city logistics researchers and planners focused on freight transport aiming at design Sustainable Urban Logistics Plans (SULP) and some surveys were carried out according to the methodology proposed by Nuzzolo et al. (2016). Besides, as the same method was used for data collection, a comparison among the four cities can be made.
The surveys were carried out in 2017; one of the goals was to build a comprehensive database in order to help decision makers in the field of city logistics. The surveys are a mean to monitor the current state of the system and to develop a modeling framework able to support ex-ante assessment of future scenarios for SULP design. The survey consisted of:
interviews with economic activity actors in order to obtain information about the goods distribution in the study area;
traffic counts of commercial and private vehicles.
In the following, the characteristics of the investigated cities, the carried-out surveys and the first results of the analyses are reported.
3.1 Overview of the investigated cities
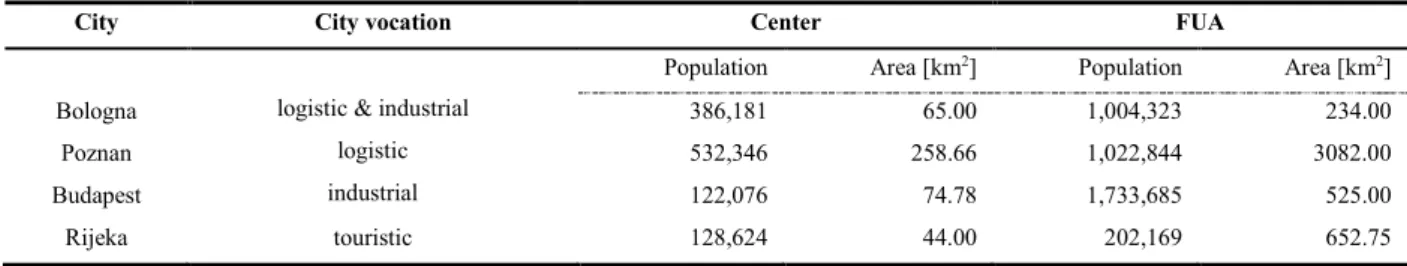
Table 1 reports some characteristics of the cities involved in SULPiTER, related with both the city center and the FUA (functional urban area, OECD 2013). In fact, urban freight issues need to be tackled in the perspective of FUA, taking into consideration the functional transport and economic relations between inner urban centers and the surrounding urban territories, as well as the functional transport and economic relations within FUAs.
Table 1. An overview of investigated cities.
City City vocation Center FUA
Population Area [km2] Population Area [km2]
Bologna logistic & industrial 386,181 65.00 1,004,323 234.00
Poznan logistic 532,346 258.66 1,022,844 3082.00
Budapest industrial 122,076 74.78 1,733,685 525.00
Bologna is a city located in Northern Italy. The center of the city covers an area of about 65 km2 with approximately 386,181 inhabitants (a density of 5,941 residents per km2). Territory is characterized by an historical core, with many shops, bars, restaurants, homes and citizen’s services. Road design is radial and merges into the ring which delimits the historical centre. The Metropolitan City of Bologna is a local authority (established in 2015) with policy and institutional competence on the whole Bologna FUA (the FUA coincides with the metropolitan city).
Poznan is a city located in Western-Central Poland, with approximately 532,346 inhabitants who were distributed over an area of 258.66 km2 and a density of 2,058 residents per km2. The number of employees in the city is 25,328. The study area was divided into five zones alluding to the former division of the city into districts.
Budapest is the capital of Hungary and has about 1,700,000 inhabitants who were distributed over an area of 525 km2 and a density of 3,238 residents per km2. Budapest is composed of 23 local municipalities having almost the same rights and responsibilities as the city of Budapest. In the city, 51,369 companies in various economic sectors operate. The study area was divided into 922 zones.
Rijeka is the principal seaport and the third-largest city in Croatia, with a population of 128,624 inhabitants distributed over an area of 44 km2 and a density of 2,923 residents per km2. The study area includes five cities and five municipalities. The study area of the Rijeka FUA was divided into five zones, according to size, population density, and intensity of commercial activity and transport routes. Two important land transport routes start in Rijeka due to its location: the first one is to the Pannonian Basin given that Rijeka is located alongside the narrowest point of the Dinaric Alps (about fifty kilometres); the second one across Postojna Gate connects Rijeka with Slovenia, Italy and beyond.
3.2 Questionnaire
The method used allows us to collect and analyze data taking into account if shops are independent stores or belong to retail chains. The interviews with retailers (in the FUA) allowed us to collect data of restocking processes for each goods type sold, e.g. type of restocking origin (i.e. from warehouse, distribution center, producer), shipment size and frequency, type of transport service used (i.e. own account or third party). Thus, the different supply-chains was able to be identified according to characteristics of goods moved and characteristics of delivering process.
The questionnaire was structured as follows:
Economic sectors: the economic sectors, identified by NACE codes, interesting the economic activity; Availability of a store: if the economic activity has/uses a store and if the store is internal or external;
Vehicle fleet and type (owned): if the economic activities has an own vehicle fleet and of what type (e.g. car, van); Restocking method: three methods are possible
delivered duty paid (DDP): the seller is responsible for arranging carriage and delivering the goods at the named place, cleared for import and all applicable taxes and duties paid (e.g. VAT, GST),
ex-works delivery: this rule places minimum responsibility on the seller, who merely has to make the goods available, suitably packaged, at the specified place, usually the seller’s factory or depot. The buyer is responsible for loading the goods onto a vehicle, for all export procedures, for onward transport and for all costs arising after collection of the goods,
off truck delivery: a supplier tries to sell directly the goods to a shop, without a previous order; Restocking frequency: the frequency of restocking (e.g. daily, weekly);
Number of suppliers: the number of suppliers that restock the economic activity; Delivery time: time slice in which the restocking takes place;
Type of packaging: the packaging used for the restocking the goods (e.g. box, pallet); Average duration of delivery: the time spent to make the delivery.
3.3 Surveys and results for each study area
In this sub-section, a description of the collected data for each city and a brief comment on the obtained results are reported.
Bologna
The survey was carried out by the Statistical Office of the Metropolitan City of Bologna and consists of interviews with commercial activities owners. A sample of 1,208 economic activities was selected randomly belonging to the following economic sectors: vehicles reparation; wholesale trade; retail trade; hotels and accommodation; restaurants and food services.
One of the elements taken into consideration in the surveys is the availability of a store. The analysis of this information makes it possible to verify which macro-sectors use external stores and, as can be seen from the results, the resulting hypothesis is that in all the categories the activities that do not use external stores prevail, only wholesale trades use external stores (8%).
The presence of an own vehicle fleet varies considerably depending on the sector of goods that is taken into account. Examining in detail the data related to the fleets of the vehicles available to carry out the commercial activity, it emerges that the most used fuel is diesel (higher value for wholesalers of 74%) with the exception of hotels and of the structures where gasoline prevails (100%). The van is the own vehicle type that is mostly used in three macro-sectors of the five considered. In the wholesale trade (51%) and in the vehicle repair sector (54%), van is the vehicle used by more than half of the respondents. The same is true, with slightly different percentages (46%), for the retail sector.
With regard to the restocking method, the results show a clear predominance of supplies delivered with delivery duty paid method. All macro-sectors have similar value for delivery duty paid (between 83% and 70%), for delivery at place the highest value is 28% for wholesales trades and the minimum (16%) for restaurants and food services.
The restocking frequency is prevalently one or more times a week for hotels and accommodations (88%), the same applies to restaurants and food services but with a percentage of 68% which is accompanied by a 28% supply for one or more many times a day. For retail trades, the two values are more balanced, 42% for weekly deliveries and 31% for daily ones; wholesales trades show the two equivalent values (39%). Finally, daily deliveries are higher (53%) than weekly (27%) for vehicles reparations. The monthly deliveries reach a maximum of 20% in the retail trades, while the annual deliveries counts for the 7%.
The delivery time in which most of the restocking operations take place are those of the early hours of the day. In particular, for retail operations, the prevalent time slice is that between midnight and six in the morning. For the restaurant and catering sectors the intervals between 0-6 am and 6-7 am show the same levels of activity. The interval between 6 and 7 am is also widely used by vehicle repairs and wholesalers (28% and 33% respectively). For hotels and accommodation, the most used time slot is between 7 and 8 in the morning. The day of the week in which the restocking is performed is mainly Monday for all the investigated economic sectors.
The main type of packaging used in all the macro-sectors considered is the roll. In particular, for the restaurants and food services sector and the retail trade, such a packaging type accounts for 70%. For the wholesale sector, pallets makes up 35%.
The average duration of delivery is, in most cases, less than 10 minutes and rarely exceeds 20 minutes, only in the case of wholesale trade the duration exceeding 20 minutes, but a significant portion is interested by transactions (around 30%).
Poznan
The survey was carried out between 14th and 28th of November 2017. The method applied was the direct interview by means of paper questionnaires. A sample of 302 economic activities was randomly selected belonging to the following economic sectors:
wholesale trade (excluding the wholesale trade in motor vehicles); retail trade (excluding wholesale trade in car vehicles);
housing and services associated with alimentation; services and handicraft.
The first surveyed element was the availability of a store by the surveyed economic activities. Based on the collected data, it is possible to indicate that an average company has 50 m2 of selling area (the median is 45 m2). At the same time, around 15% of economic activities have a selling area smaller than 20 m2. Almost a fourth of the surveyed companies owns an area within the range of 50-75m2, and only 15% of economic activities own an area larger (in the sector of trade and gastronomy). Only four economic activities (out of 302) declared the possession of an external store. The remaining economic activities, for storing their goods, use parts of the selling area. Almost 40%
of respondents indicated that their storage area does not exceed 5 m2. A slight number (above the 33% of the general number of respondents) declared to have a separate storage area of 6-10 m2 at their disposal. Only one on five respondents declared to have a store does not exceeding 20 m2, and only 2.65% declared having larger (not exceeding 65 m2). The average storage area of the surveyed entities varied around the value of 8.76 m2.
Regarding the availability of an own vehicle fleet, around 45% of the surveyed economic activities owns a car, used by the company to carry out deliveries. None of the surveyed companies declared possession of a lorry. During working hours, the cars owned by the companies are parked at indicated street parking (46%) or private parking/parking spots of the company (38%). Sometimes these are specially indicated parking spots or informal parking lots (4%).
Besides, the participants were asked in relation to the restocking method. Approximately 75% of respondents declare that the costs of delivery and payment of duties, insurance remain on the seller’s side (delivery duty paid). Such a distribution of responses may be because approximately 60-80% of total deliveries are made by means of transport belonging to the suppliers of goods. The remaining 20-30% are deliveries by shipping companies and couriers.
About the restocking frequency, more than half of the surveyed economic activities use supplies at least once a week (about 55%). Every third of them (about 34%) does it once or several times a month. Some surveyed economic activities (about 10%) replenishes stocks more often because of the specificity of the activity or of very small store backgrounds.
The participants were asked to list the number of suppliers (with a reservation that the number could not exceed 3). Approximately half of all economic activities declare that they have only one main supplier. Approximately the 33% have two main suppliers and around thirteen have three companies supplying goods.
The delivery time in which most of the restocking operations take place are asked to the economic activities. The delivery peak of goods to stores/points of business takes place between 8 am and 12 pm. Out of these hours, the frequency of delivery is significantly lower. At the same time, more than 80% of respondents believe that there is a possibility of receiving deliveries in different hours.
The main type of packaging are the boxes or the cartons (over 80% of all delivered goods). About 10% are chests, rarely pallets (5.44%) o roller containers (1.36%).
Another issue examined is the weight of a typical delivery to the store. Among the delivered goods, the most are light weighted items (the weight of a single piece does not exceed 5 kg). 38.5% of the delivered items falls within the limits of 5-10 kg (29.8%). Occasionally, single packages weigh more than 20 kg: these types of items account for only 12% of the total number of delivered goods to the surveyed stores.
The average duration of delivery in most cases (80% in total) does not exceed 20 minutes, only five of them are longer. At the same time, as much as 40% of restocking is no longer than 10 minutes.
Budapest
A sample of 302 economic activities was selected randomly, some belong to the following economic sectors: restaurants, bar, cafe, confectionery;
food and drink; clothes, shoes shops; flower and plants.
About the availability of a store, the 22% of the shops does not have a store inside the shop, the others’ inside store takes up one third of the whole area of the shop on an average. The 14% of the shops has an external store, more than 50% of which located in Budapest, on an average 29 km distance from the shop.
The 39% of the economic activities has their own vehicle fleet, which usually means only one vehicle.
In relation to the own vehicle type, the 47% of the vehicles is car, 23% van, but truck, motorcycle, cargo-bike is also used in some cases. Concerning the fuel supply type, 96% of the vehicles uses gasoline or diesel, only 3,1% is electric and 0,44% is hybrid.
On average one shop has 5.2 suppliers, but most of them has less, often just one or two suppliers.
From the three restocking methods (off-truck, ex works, delivery duty paid), the off-truck are used only in a few cases, the others are more common (34 % and 66%, respectively). Within all the supplying processes, 39% use the services of a third party and 12.6% of the shops uses the services of express couriers.
The restocking frequency is in most cases (about 75%) weekly (or more rarely). Only 12% takes place at least once a day.
Concerning the type of packaging, the most common, which is used in almost half of the deliveries, is the box. More than half of the load units is below 200 liters and 40% of them is below 20 kg.
Rijeka
A sample of 232 economic activities was selected randomly belonging to the following economic sectors: caffe bar, restaurant, hotel;
food products; consumer goods; textile products.
From the three modes of restocking methods, the 49.47% of interviewees use delivery duty paid delivery mode, while the others use ex-works (5.60%) and off-truck deliveries (44.83%).
The 45% of economic activities have a restocking frequency of three or more times per week. Monday and Wednesday are the busiest days in the week in terms of deliveries with the share of 62% and 59%, respectively.
Kiosks receive from 1 to 10 items which usually weigh up to 3 kg. Cafe-bars receive up to 30 items, and stores (supermarkets, retail stores, grocery stores) can receive from 1 up to a 100 items that can weigh up to 2,000 kg depending on delivery. The number of load units per deliveries is max 200, with an average of 13.82. Over 53 % of suppliers use private parking when delivering goods, but more than 35 % park illegally.
Regarding the number of suppliers, most of economic activities have, on average, 3.9 suppliers.
In relation to the delivery time, over 90% of suppliers complete deliveries from 6 am until 12pm, and 10% deliver in the afternoon hours. The number of items per delivery varies according to the destination of delivery.
While most of shop employees have said that the average duration of deliveries is up to 10 minutes, transport operators say that it is rarely or never less than 10 minutes per delivery.
3.4 Results summary
Table 2 reports a summary of the collected data in the four cities. Each row is for an element of the questionnaire, each column for a city. It can be noted that each city has differently chosen the commercial activities to be interviewed according to its main economic vocation (e.g. industrial, touristic). As an example, Bologna and Poznan consider retail and wholesale trade, in all the cities it is chosen a field related to the food (service or products). The presence of a depot is investigated asking if the depot is inside the shop or outside. The presence of an owned vehicle fleet is complementary with the type of vehicle: from the data, less than the 50% of the respondents use an owned vehicle for supply, in this case, the vehicle is (mostly) a car or a van. Regarding the supplying method, in Bologna the delivery duty paid is the service mainly used and it is similar for Budapest and Rijeka. Besides, ex-works one is used in the 34% of cases in Budapest, and in 5.60% in Rijeka. The off-truck is not used at Budapest, used in about the 45% of cases in Rijeka. The frequency of supply is different for the four cities, in relation to the monitored activities (range from the daily to the monthly). In Bologna, the delivery is permitted at night. The type of packaging ranges from the box to the pallet, the average duration of delivery is in some cases less than 10 minutes, comes up to twenty minutes in others.
Table 2. A summary of the results.
Economic sectors Bologna Poznan Budapest Rijeka
wholesale trade X X
vehicles reparation X
retail trade X X X
food and drink X X
services and
handicraft X
clothes and shoes X
textile products X
flower and plants X
Ho.re.ca. X X
hotels and
accommodation X restaurants and food
services X X Availability of a store NA no: 3% yes (internal): 95.7% yes (external): 1.3% no: 22% yes (internal):64% yes (external):14% NA Vehicle fleet
(owned) no: 70% yes: 30% no: 65% yes: 45% no: 61% yes: 39% NA Vehicle type
(owned) van car, van car, van NA
Restocking method
mainly, Delivery Duty Paid (between 70% and 83%)
mainly, Delivery Duty Paid (75%)
Delivery Duty Paid: 66% Ex-Works: 34% Off-truck: 0% Delivery Duty Paid: 49.47% Ex-Works: 5.60% Off-truck: 44.83% Restocking
frequency Daily, weekly, monthly Daily, weekly, monthly Daily, weekly 3 or more times per week Number of
suppliers NA less than 3 5.2 (average) 3.9 (average)
Delivery time between 0:00am-08:00am between 08:00am-12:00pm 6:00am - 12:00am Type of
packaging Roll, pallets Boxes, cartons, chests, pallets, roller containers Box NA Average duration
of delivery less than 10 minutes less than 20 minutes NA up to 10 minutes
NA = not available
4. Conclusions
This paper reports a first data analysis of surveys carried out in some European cities and related to the restocking processes. A literature methodology was implemented and its flexibility to different applicative contexts was shown. The considered cities are different in dimension (from 120,000 to 500,000 inhabitants in the city center) and in vocation (e.g. industrial, touristic). The survey, completed in 2017, was carried out on a sample of economic activities, randomly selected from those belonging to some economic sectors (identified with the NACE code). In general, each city has different economic sectors in relation to the city vocation. The questionnaire is the same for each city and aims to detect the main characteristics of the restocking process (e.g. restocking method, frequency, number of
suppliers). The urban freight issues are tackled in the perspective of FUA, taking into consideration the functional transport and economic relations between inner urban centers and the surrounding urban territories.
It emerges that the restocking process is different from city to city, depending also from the mainly impacting economic sector. Differences can be noted in restocking frequency, in the number of involved supplier (from one to more than five), in the time slot for restocking (in a case the night delivery is permitted), in the packaging (from the box to the pallet). The restocking method mainly used in the four cities is the delivery duty paid, the off-truck is a method used only in Rijeka.
Further analyses are also in progress to improve these first results, developing other analyses through the inclusion of zonal and level-of-service attributes (e.g. accessibility) and the characteristics of end consumer that reach these areas for purchasing. In particular, the similarities and dissimilarities in terms of spatial patterns, current regulations and freight demand characteristics have been developing. In addition, a comparative analysis between the degree of transferability of the obtained outcomes is under development. Finally, the development and the testing of a modelling framework for forecasting urban freight transport flows and urban freight transport performances will be carried out. These results could be used to evaluate through quantitative methods the outcomes obtainable from the implementation of different city logistics scenarios and to verify if it possible to identity the types of measures more suitable for reaching the sustainability goals according to main city characteristics.
References
Allen, J., Browne, M., 2008. Review of Survey Techniques Used in Urban Freight Studies. Report produced as part of the Green Logistics Project: Work Module 9 (Urban Freight Transport), London, UK, http://www.greenlogistics.org.
Ambrosini, C, and Routhier, J.L., 2004. Objectives, Methods and Results of Surveys Carried out in the Field of Urban Freight Transport: An International Comparison. Transport Reviews 24 (1), Taylor & Francis, pp. 57-77.
BESTUFS, 2008. D3.2 BESTUFS Best practice in data collection, modeling approaches, and application fields for urban commercial transport models. BESTUFS II Project (Best Urban Freight Solutions), Sixth Framework Programme, www.bestufs.net.
Browne M., Allen J., Woodburn A., Patier D., Routhier J.L., Ambrosini C., 2007. Comparison of urban freight data collection in European countries. Proceedings of the 11th WCTR, Berkeley, 24-28 June.
Campagna, A., Stathacopoulos, A., Persia, L., Xenou, E., 2017. Data collection framework for understanding UFT within city logistics solutions. Transportation Research Procedia 24,Elsevier, pp. 354-361.
Cirianni, F., Panuccio, P., Rindone, C., 2013. A comparison of urban planning systems between the UK and Italy: Commercial development and city logistic plan. WIT Transactions on the Built Environment, 130, pp. 785-797
Comi, A., Buttarazzi, B., Schiraldi, M. M., Innarella, R., Varisco, R. and Rosati, L., 2017. DynaLOAD: a simulation framework for planning, managing and controlling urban delivery bays. Transportation Research Procedia 22, DOI: 10.1016/j.trpro.2017.03.049, pp. 335–344. Dablanc, L., 2007 Goods transport in large European cities: Difficult to organize, difficult to modernize. Transportation Research Part A 41 (3),
Elsevier, 280 – 285.
Gatta, V. and Marcucci, E., 2014. Urban freight transport and policy changes: Improving decision makers' awareness via an agent-specific approach. In Transport Policy 36, pp. 248-252.
Holguín-Veras, J. and Jaller, M., 2012. Comprehensive freight demand data collection framework for large urban areas. Proceedings of 91st Annual Meeting of Transportation Research Board (TRB), Washington DC, USA.
Hounwanou, S., Comi, A., Gonzalez – Feliu, Gondran, N., 2018. Inner city versus urban-periphery retailing: store relocation and shopping trip behaviours. Indications from Saint-Etienne. Transportation Procedia - EURO Mini Conference on "Advances in Freight Transportation and Logistics" (emc-ftl-2018).
Nuzzolo, A., Comi, A., Ibeas, A. and Moura, J. L., 2016. Urban Freight Transport and City Logistics Policies: Indications from Rome, Barcelona and Santander. International Journal of Sustainable Transportation 10 (6), DOI: 10.1080/15568318.2015.1014778, Francis & Taylor, pp. 552-566.
OECD, 2013. Definition of Functional Urban Areas (FUA) for the OECD metropolitan database. https://www.oecd.org/cfe/regional-policy/Definition-of-Functional-Urban-Areas-for-the-OECD-metropolitan-database.pdf
Ogden, K. W., 1992. Urban Goods Movement. Ashgate, Hants, England.
Russo, F. and Comi, A., 2016. Urban Freight Transport Planning towards Green Goals: Synthetic Environmental Evidence from Tested Results. In
Sustainability, 8 (4), 381.
Russo, F. and Comi, A., 2017. From the analysis of European accident data to safety assessment for planning: the role of good vehicles in urban area. European Transport Research Review 9 (9), DOI 10.1007/s12544-017-0225-0, Springer Berlin Heidelberg.
Russo, F., Rindone, R., P. Panuccio, 2016. European plans for the smart city: from theories and rules to logistics test case. European Planning
Studies, 24(9), 1709-1726.
Taniguchi, E., Fwa, T. F. and Thompson, R. G., 2013. Urban transportation and logistics: health, safety, and security concerns. Baca Raton: CRC Press, 2013.