DOTTORATO DI RICERCA
IN
INGEGNERIA CIVILE, AMBIENTALE E DEI MATERIALI
Ciclo XXVIII
Settore Concorsuale di afferenza: 08A3
Settore Scientifico Disciplinare: ICAR/04
USE OF INDUSTRIAL RECLAIMED FILLER TO MODIFY ASPHALT
MIXTURE AND BINDER PERFORMANCES
Advanced rheological performance evaluation and 3D DEM Modeling of bituminous binders and mastics
Presentata da: DOTT. ING. FRANCESCO MAZZOTTA
Coordinatore Dottorato
Relatore
PROF. ING. ALBERTO LAMBERTI PROF. ING. GIULIO DONDI
Co-Relatore
DOTT. ING. CESARE SANGIORGI
2
ABSTRACT
The mechanical performance of an asphalt mixture is largely dependent on the properties of its constituents and by the way they reciprocally interact in the bituminous layer. In particular, the stress-strain response of the road pavements is closely related to the rheological behavior of the bituminous binder and of its interaction with the finest part of the lytic skeleton. Therefore, it is important to study in the laboratory by means of advanced rheological tests, how mastics (Bitumen-Filler Systems) and mortars (Bitumen-Filler-Sand Systems) react to dynamic loads and thermal stresses. Moreover, the understanding of the contacts mechanisms within the bitumen-filler system, through 3D micro-mechanical models, should allow for a deeper analysis of the mastic rheological behavior. Based on these considerations, in a socio-economic context in which it is necessary to reduce the environmental impact caused by the construction and maintenance of transportation infrastructures, bituminous mastics containing different reclaimed fillers from the industrial production wastes were studied. For this purpose, advanced rheological tests have been first validated and then implemented and combined with the 3D DEM models development. Results showed that the methods used to study the bituminous mastics and mortars allowed to understand the effects due to the addition of innovative and recycled fillers within the mixtures blend, highlighting as these can increase the asphalt mixture performance during its service life.
3
Le prestazioni meccaniche di una miscela di conglomerato bituminoso dipendono in gran parte dalle proprietà dei materiali che la compongono e dalle modalità con cui interagiscono reciprocamente. In particolare, la risposta tenso-deformativa delle sovrastrutture stradali è strettamente legata al comportamento reologico del legante bituminoso ed all’interazione che questo ha con la parte più fine dello scheletro litico. Risulta pertanto di fondamentale importanza studiare in laboratorio, attraverso test reologici avanzati, come mastici (sistema Filler) e mortar (sistema di Bitume-Filler-Sabbia) reagiscono alle sollecitazioni dinamiche e termiche imposte. Inoltre la comprensione dei meccanismi di contatto del sistema bitume-filler attraverso modelli micro-meccanici in 3D permette di approfondire l’analisi del comportamento reologico del mastice. Sulla base di tali considerazioni, e in un contesto socio-economio in cui è necessario ridurre l’impatto ambientale causato dalla costruzione di nuove infrastrutture, con i metodi precedentemente descritti, si sono studiati mastici bituminosi contenenti filler da recupero industriale. A tale scopo sono stati prima validati e poi implementanti test reologici avanzati, associati allo sviluppo di modelli 3D. I metodi validati ai fini dello studio del comportamento reologico dei mastici e dei mortar bituminosi, hanno consentito di studiare gli effetti apportati dall’aggiunta di filler innovativi all’interno della miscela, evidenziando quanto questi possano incrementare le prestazioni in opera della misce
4
TABLE OF CONTENTS
ABSTRACT ... 2 ABSTRACT ITALIANO ... 3 LIST OF FIGURES ... 11 LIST OF TABLES ... 15 1. INTRODUCTION ... 172. LITERATURE REVIEW: MATERIALS ... 20
2.1 Introduction ... 20
2.2 Bitumen - Filler System: Mastic ... 21
2.2.1 Bitumen ... 21
2.2.1.1 Bitumen structure and constitution: SARA fractions ... 21
2.2.1.2 Bitumen physical and chemical properties ... 24
2.2.1.3 Bitumen colloidal model ... 28
2.2.2 Mineral Filler ... 30
2.2.2.1 Limestone Filler ... 31
2.2.2.2 Portland cement ... 32
2.2.3 The role of mineral fillers in asphalt mastics ... 33
2.2.3.1Mastic characteristics depending on filler physical properties ... 33
2.2.4 The role of mineral fillers in asphalt mixtures - The Stone Mastic Asphalt (SMA) ... 36
2.4 Bitumen - Filler - Sand System: The Mortar ... 40
2.5 Bitumen modified with non-traditional filler ... 42
2.5.1 Nanoclay filler in bituminous mixtures ... 42
2.5.2 Filler from waste materials in bituminous mixtures ... 45
2.5.2.1 Filler from Construction & Demolition (C&D) waste materials ... 45
2.5.2.1 Filler from industrial waste materials ... 46
2.6 Bitumen modified with Crumb Rubber... 52
2.6.1 Tyre ... 52
2.6.2 Management and procedures for recovery of ELTs ... 54
2.6.3 Crumb rubber in bituminous mixtures ... 57
2.6.3.1 WET technology ... 58
5
3 LITERATURE REVIEW: METHODS ... 66
3.1 Introduction ... 66 3.2 Rheology ... 68 3.2.1 Elastic solid ... 68 3.2.2 Viscous flow ... 69 3.2.3 Viscoelastic models ... 72 3.2.3.1 Hooke model ... 72
3.2.3.2 Linear viscosity model (Newton viscous dasphot) ... 74
3.2.3.3 Maxwell model ... 75
3.2.3.3 Kelvin-Voigt model ... 77
3.2.3.4 Burger model ... 78
3.2.3.4 Generalized model ... 79
3.3 Rheological parameters of bituminous binder ... 81
3.3.1 Oscillatory rheological bitumen parameters ... 81
3.3.2 Data representation on sinusoidal oscillatory test ... 83
3.3.2.1 Black Diagram ... 83
3.3.2.2 Cole-Cole Diagram ... 83
3.2.2.3 Time-temperature superposition principle (TTS) ... 84
3.3.3 Master curve and empirical model ... 87
3.3.3.1 Christensen and Anderson (CA) Model ... 88
3.3.3.2 Christensen, Anderson and Marasteanu (CAM) Model ... 90
3.3.3.3Modified Christensen, Anderson and Marasteanu Model ... 91
3.3.3.4 Sigmoidal model (CAM) ... 93
3.4 Dynamic Oscillatory Test using DSR ... 95
3.4.1 Dynamic Shear Rheometer ... 95
3.4.2 Plate – Plate configuration ... 96
3.5 Mortar configuration test ... 98
3.5.1 Viscoelastic stress analysis of torsional circular bars ... 98
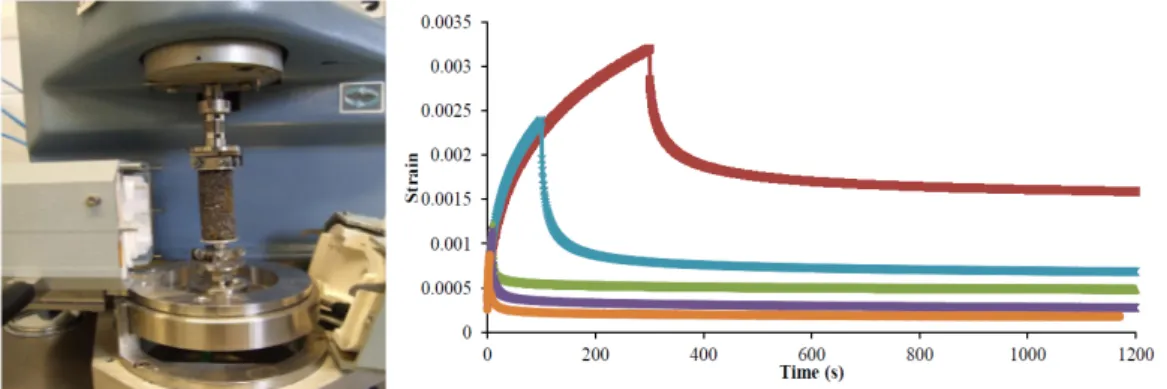
3.5.1 Dynamic Mechanical Analyzer ... 100
3.6 Permanent Deformation Behavior and testing of bituminous binders ... 103
3.6.1 Introduction of Rutting Phenomena ... 103
3.6.2 Creep characterization of bituminous binder ... 106
6
3.6.3.1 Elastic Recovery Test ... 106
3.6.3.2 Repeated Creep Recovery Test ... 108
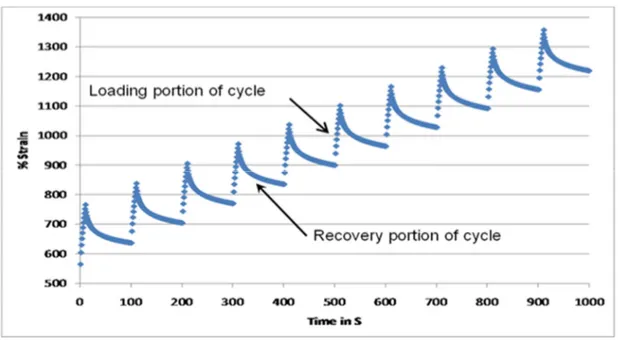
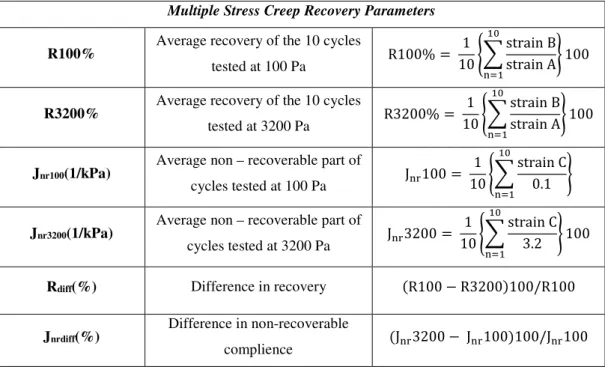
3.6.3.3 Multiple Stress Creep Recovery Test ... 108
3.7 3D Discrete Element Method (DEM) ... 112
3.7.1 Introduction of Discrete Element Method ... 112
3.7.1.1 DEM Fundamental Principles ... 113
3.7.1.2 Particles DEM ... 114
3.7.1.3 Force - Displacement law ... 117
3.7.1.3 Equations of motions ... 120
3.7.1.3 Damping law ... 121
3.7.1.4 Time critical range ... 121
3.7.2The use of DEM to study rheological behavior of bitumen ... 122
3.7.3 The use of DEM to study rheological behavior of Asphalt Mixtures ... 128
4 RHEOLOGICAL AND 3D DEM CHARACTERIZATION OF TRADITIONAL BITUMINOUS MASTIC: METHODS VALIDATION ... 132
4.1 Introduction ... 132 4.2 Materials ... 134 4.2.1 Bitumen ... 134 4.2.2 Limestone Filler ... 134 4.2.3 Cement ... 135 4.3 Mastics ... 136 4.3.1 Mastics Design ... 136 4.3.2 Mastics Preparation ... 136 4.4 Test Programme ... 137
4.4.1. Test Equipment and Sample Preparation ... 137
4.4.2 Amplitude Sweep Test ... 137
4.4.3 Frequency Sweep Test ... 137
4.4.4 Repeated Creep Recovery Test ... 138
4.4.5 Multiple Stress Creep Recovery Test ... 138
4.5 Discrete Element Test Simulation ... 140
4.5.1 Model geometry ... 140
4.5.2 Contact material properties ... 142
7
4.6 Test Results and Discussion ... 145
4.6.1 Master Curves ... 145
4.6.2.1 Frequency Sweep Test Results ... 145
4.6.2 Creep Test Results ... 146
4.6.2.1 Repeated Creep Recovery Test ... 146
4.6.2.3 Multiple Stress Creep Recovery Test ... 149
4.6.3 DEM simulation results ... 151
4.6.3.1 Frequency Sweep Test ... 151
4.7 Summary ... 156
5 RHEOLOGICAL CHARACTERIZATION OF BITUMINOUS MASTICS CONTAINING WASTE BLEACHING CLAYS ... 158
5.1 Introduction ... 158
5.2 Materials ... 160
5.2.1 Bitumen ... 160
5.2.2 Fillers from bleaching clay ... 161
5.2.2.1Bentonite ... 161
5.2.2.2 Use of Bentonite ... 163
5.2.2.3 Production Process of bleaching clays ... 164
5.2.2.3 Ut Production - oils and grease refining and bleaching process. ... 165
5.2.2.4 Ud Production - Anaerobic digestion for biogas ... 167
5.2.2.5 Ut and Ud preliminary investigation ... 168
5.3 Mastics ... 169
5.3.1 Mastics Design ... 169
5.3.2 Mastics Preparation ... 169
5.4 Test Programme ... 171
Test Equipment and sample preparation ... 171
5.4.2 Amplitude Sweep Test ... 171
5.4.3 Frequency Sweep Test ... 172
5.4.4 Repeated Creep Recovery Test ... 172
5.4.5 Multiple Stress Creep Recovery Test ... 172
5.5 Test Results and Discussion ... 173
5.5.1 Master Curves ... 173
8
5.5.2.1 Repeated Creep Recovery Test ... 174
5.5.2.2 Multiple Stress Creep Recovery Test ... 177
5.6 Summary ... 180
6 RHEOLOGICAL CHARACTERIZATION OF BITUMEN, MASTICS AND MORTARS CONTAINING FINE CRUMB RUBBER ... 181
6.1 Introduction ... 181
6.2 Materials ... 183
6.2.1 Bitumen ... 183
6.2.2 Limestone Filler ... 185
6.2.3 Fine Crumb Rubber ... 186
6.2.3.1 Fine Crumb Rubber production ... 186
6.3 Bitumen – Limestone Filler – Fine Crumb Rubber Mastic System ... 190
6.3.1 Mastics Design ... 190
6.3.2 Mastics Preparation ... 195
6.4 Mastics Testing Programme ... 197
6.4.1 Test Equipment and Sample Preparation ... 197
6.4.2 Amplitude Sweep Test ... 198
6.4.3 Frequency Sweep Test ... 198
6.4.4 Multiple Stress Creep Recovery Test ... 198
6.5 Mastic Discrete Element Simulation ... 199
6.5.1 Model Geometry ... 199
6.5.2 Contact Materials Properties ... 200
6.5.3 Simulation of Frequency Sweep Test ... 201
6.6 Mastic Test Results and Discussion ... 202
6.6.1 Linear Viscoelastic Limit ... 202
6.6.2 Master Curves ... 203
6.6.2.1 Mastic made with the UNMODIFIED BITUMEN ... 203
6.6.2.2 Mastic made with the ZERO BITUMEN ... 204
6.6.3 Black Diagram ... 207
6.6.4 MSCR and Jnr Results ... 210
6.6.4.1 Mastic made with UNMODIFIED BITUMEN ... 210
6.6.4.3 Mastic made with ZERO BITUMEN ... 213
6.6.4.3 Mastic made with “A” BITUMEN ... 216
9
6.6.5.1 Frequency Sweep Test Results ... 218
6.7 Mortar System ... 222
6.7.1 Mortar Design ... 222
6.7.1.1 Fine aggregates normalization ... 222
6.7.1.2 Bitumen, Rubber and Filler normalization ... 224
6.7.1.3 Mortars Combinations ... 224
6.7.2 Mortar Preparation ... 225
6.8 Mortar Testing Programme ... 228
6.8.1 Test Equipment and Sample Preparation ... 228
6.8.2 Frequency Sweep Test ... 229
6.9 Mortar Test Results and Discussion ... 230
6.9.1 Master Curves ... 230
6.10 Summary ... 237
CHAPTER 7 – CONCLUSIONS AND RECOMMENDATIONS ... 238
7.1 Validation methods for the rheological characterization of cold bituminous mastics. ... 238
7.2 Identifying 3D Discrete Elements Particles models that are able to reproduce rheological tests in the Linear Visco-Elastic range. ... 239
7.3 Rheological study of bituminous mastics containing reclaimed filler from industrial wastes and by-products. ... 239
7.3.1 Fillers from waste bleaching clays ... 239
7.3.3 Crumb Rubber Filler from ELTs ... 240
REFERENCES ... 242
Chapter 2 - LITERATURE REVIEW: MATERIALS... 242
Chapter 3 - LITERATURE REVIEW: METHODS ... 244
Chpater 4 - RHEOLOGICAL AND 3D DEM CHARACTERIZATION OF TRADITIONAL BITUMINOUS MASTIC: METHODS VALIDATION ... 248
Chapter 5- RHEOLOGICAL CHARACTERIZATION OF BITUMINOUS MASTICS CONTAINING WASTE BLEACHING CLAYS ... 248
Chapter 6 - RHEOLOGICAL CHARACTERIZATION OF BITUMEN MASTICS AND MORTARS CONTAINING FINE CRUMB RUBBER ... 249
APPENDIX A ... 250
Dynamic Shear Rheometer - Bohlin Gemini 200 ... 250
Dynamic Shear Rheometer – Anton Paar MCR 302 – Anton Paar Smart Pave 102 ... 252
11
LIST OF FIGURES
Figure I.1 Asphalt mixture multiscale Analysis Figure I.2 Experimental programFigure 2.1 Molecular model of asphaltenes (“Evaluation of bitumen fractional
composition depending on the crude oil type and production technology”)
Figure 2.2 Molecular model of resins (“Evaluation of bitumen fractional
composition depending on the crude oil type and production technology”)
Figure 2.3 Molecular model of maltenic oils (“Evaluation of bitumen fractional
composition depending on the crude oil type and production technology”)
Figure 2.4 Molecular model of satured oils (“Evaluation of bitumen fractional
composition depending on the crude oil type and production technology”)
Figure 2.5 a) bitumen sol structure b) bitumen gel structure Figure 2.6 a) Limestone Filler b) Portland Cement
Figure 2.7 G* Ratio vs Filler volume fraction (“Conceptual phenomenological model for interaction of asphalt binders with mineral fillers”)
Figure 2.8 Schematic diagram of bitumen-filler system Figure 2.9 Stone Mastic Asphalt composition
Figure 2.10 Mortar test device and Mortar creep test at 10kPa (From binder to mixture; multiscale permanent deformation behavior).
Figure 2.11 Montmorillonite structure (“Effects of nanoclay on rheological properties of bitumen binder”)
Figure 2.12 RLAT: accumulated strain vs. Number of load cycles (Waste bleaching clays as fillers in hot bituminous mixture)
Figure 2.13 Tyre components
Figure 3.1 Viscous flow between two parallel planes at distance Z (“Studio reologico avanzato di bitumi modificati ed additivati: proposta di una nuova procedura di aging”)
Figure 3.2 Rotational flow between coaxial cylinders (“Studio reologico
avanzato di bitumi modificati ed additivati: proposta di una nuova procedura di aging”)
Figure 3.3 Newtonian flow curve. Figure 3.4 Non-Newtonian flow curves. Figure 3.5 Hooke model configuration Figure 3.6 Viscous Newton dasphot
Figure 3.7 Maxwell linear viscoelastic model Figure 3.8 Kelvin- Voigt linear viscoelastic model Figure 3.9 Burger viscoelastic model
Figure 3.10 Kelvin-Voigt generalized model Figure 3.11 Kelvin-Voigt generalized model.
Figure 3.12 Materials behavior on phase angle function Figure 3.13 Complex plane
Figure 3.14 Black Diagram Figure 3.15 Cole-Cole diagram
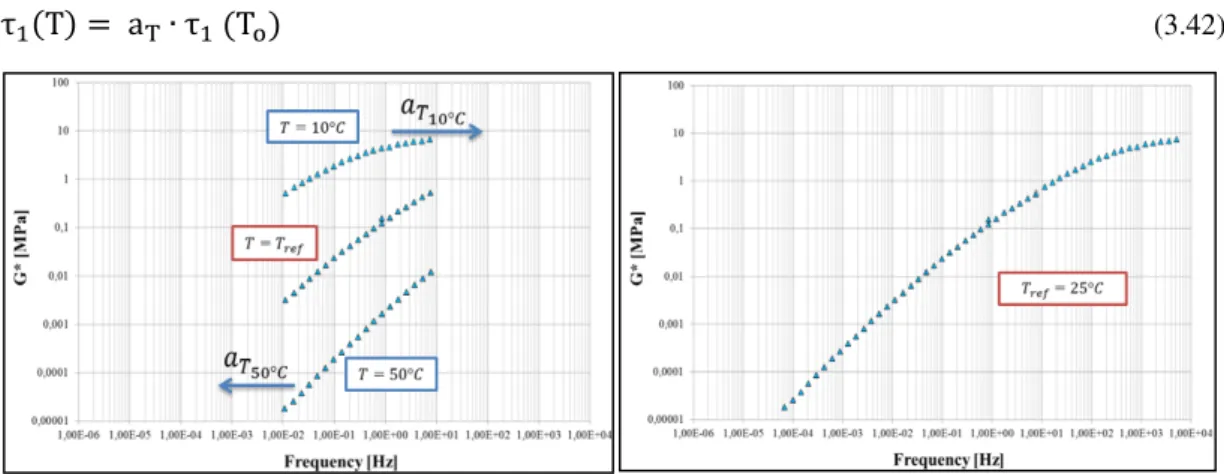
Figure 3.17 Master curve construction with TTS principle. Figure 3.18 Rouse model
Figure 3.19 Characteristic master curve parameters on CA model Figure 3.20 Characteristic master curve parameters on CAM model
12 Figure 3.21 Sigmoidal model master curve Figure 3.22 Configuration plate – plate
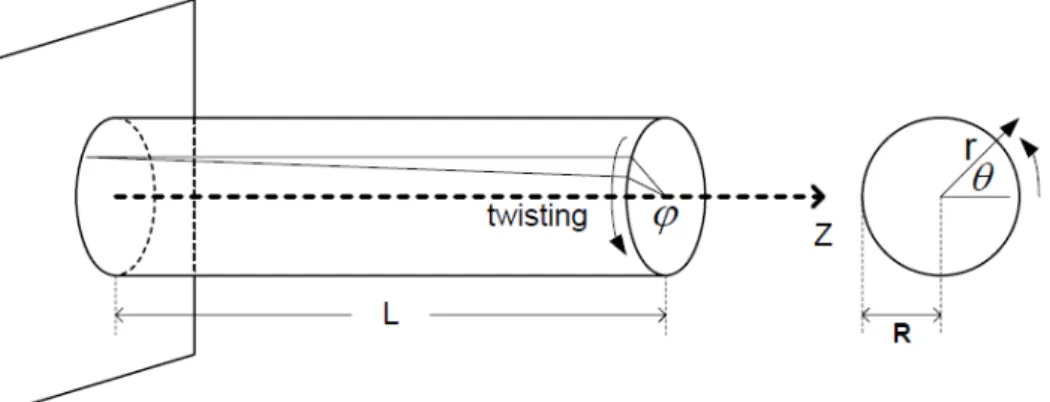
Figure 3.23 Simple Illustration of the Cylindrical Bar under Torsion.
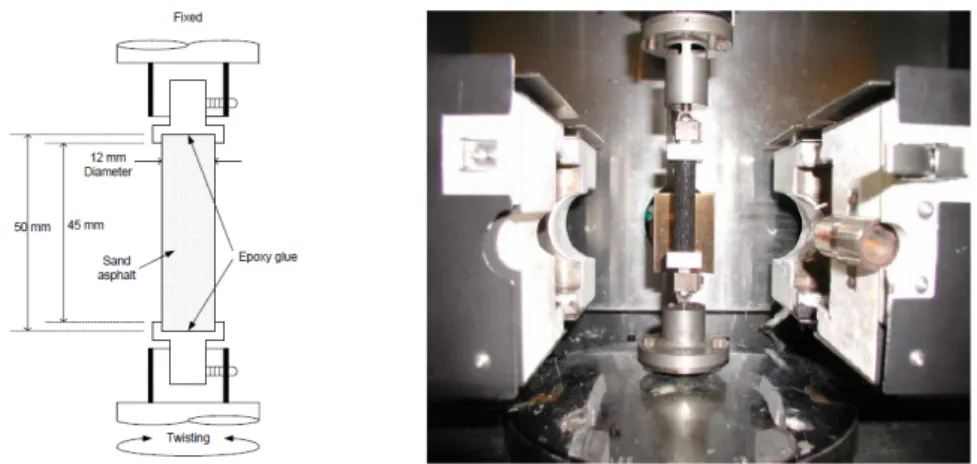
Figure 3.24 Schematic Diagram of the Cylindrical DMA Sample with Holders (“Development of specification-type tests to assess the impact of fine aggregate and mineral filler on fatiguedamage”)
Figure 3.25 Rutting phenomena on surface layer
Figure 3.26 Typical shear strain curve for the elastic recovery test in the DSR. (“Importance of Elastic Recovery in the DSR for Binders and Mastics”) Figure 3.27 Typical data of MSCR test for a polymer modified Binder (The Multiple Stress Creep Recovery (MSCR) Procedure)
Figure 3.28 First two MSCR cycles, strain values to extract results parameters Figure 3.29 Schematic Diagram of the Cylindrical DMA Sample with Holders Figure 3.30 Disck compressed between rigid walls
Figure 3.31 Force – displacement law. Figure 3.32 Sign convention Fn – Fs. Figure 3.33 Mass and spring system
Figure 3.34 - DEM model of the DSR sample (“Modeling the dsr complex
shear modulus of asphalt binder using 3d discrete element approach”)
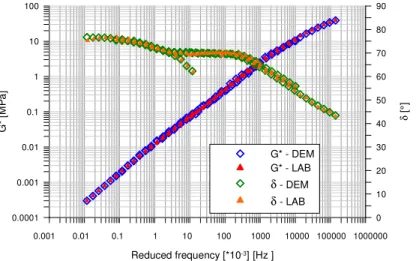
Figure 3.35 – Master curves of experimental (LAB) and numerical (DEM) results for complex modulus (G*) and phase angle δ (“Modeling the dsr complex shear modulus of asphalt binder using 3D discrete element approach”)
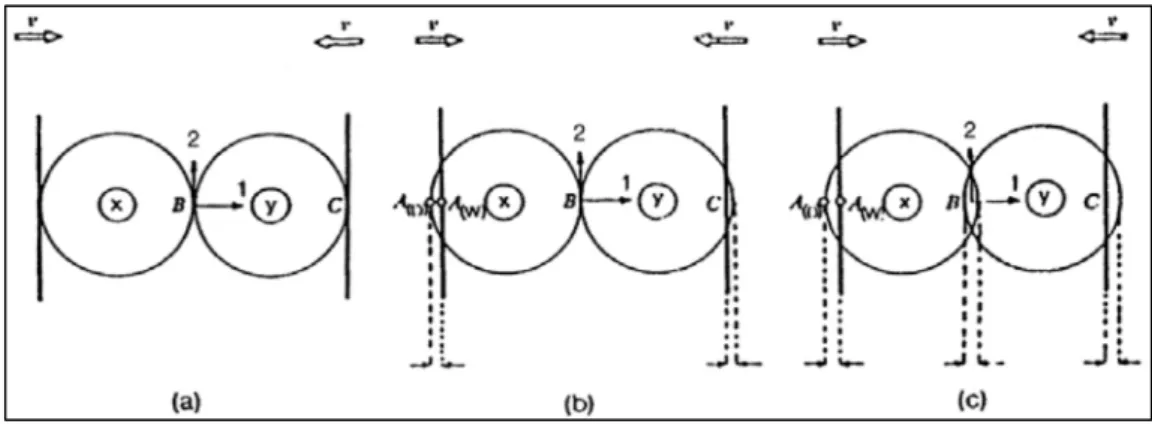
Figure 3.36 – Conditions for evaluating the contact forces (“Modeling the dsr
complex shear modulus of asphalt binder using 3d discrete element approach”)
Figure 3.37 – Contact forces evaluated on the vertical plane of simmetry (“Modeling the dsr complex shear modulus of asphalt binder using 3d discrete
element approach”)
Figure 4.1 – Bitumen Master Curves
Figure 4.2 – DSR 25mm configuration and shear tendion/deformation curves for a load frequency of 0.01Hz @30°C
Figure 4.3 – MC, DEM model of the DSR sample (in blue the bitumen spheres, in red the Portland cement spheres)
Figure 4.4 – MCF, DEM model of the DSR sample (in blue the bitumen spheres, in red the Portland cement spheres, in yellow the limestone filler spheres)
Figure 4.4b – Frequency sweep test loading wave Figure 4.5 – MC and MCF Black Diagram Figure 4.6 – MC and MCF Master Curves Figure 4.7 – MC and MCF Master Curves Figure 4.8 – MC and MCF Master Curves
Figure 4.9 – Comparison of RCR Jnr and Recovery @46 and 58°C
Figure 4.10 – MC and MCF MSCR results Figure 4.11 – MC and MCF MSCR results
Figure 4.12 – MC and MCF non recoverable compliance Figure 4.13 – MC and MCF MSCR results
Figure 4.14 - MCF, master curves of experimental (LAB) and numerical (DEM) results for complex modulus (G*) and phase angle (δ)
13
Figure 4.15 - MCF, master curves of experimental (LAB) and numerical (DEM) results for complex modulus (G*) and phase angle (δ)
Figure 4.16 - MC, mean error (∆) between DEM and laboratory data for each temperature, for complex modulus and phase angle
Figure 4.17- MCF, mean error (∆) between DEM and laboratory data for each temperature, for complex modulus and phase angle
Figure 5.1 – Bitumen 50/70 pen Master Curve Figure 5.2 – Spent Bentonite: Ut
Figure 5.3 – Digested Bentonite: Ud Figure 5.4– Bleaching clays plant
Figure 5.5– Fillers Ut and Ud characterization devices. a)volumetric mass (EN 1097-7); b)Rigden voids (EN 1097-4); c) d) Delta Ring & Ball (EN 13179-1) Figure 5.6 Master Curves for Mff, MUt, and MUd mastics at 20°C
Figure 5.7 Results of the accumulated strain under repeated creep testing @ 46°C
Figure 5.8 Strain/time for the first cycle of RCR test at 1 kPa at 46°C, 58°C and 64°C
Figure 5.9 Accumulated strain values at the end of 100th cycle at @46°C, 58°C and 64°C
Figure 5.10 Comparison of RCR % recovery at the 1st and 100th cycle @46°C, 58°C and 64°C
Figure 5.11 MSCR test results at @46°C
Figure 5.12 Accumulated strain values at the end of 10th cycle at 0.1kPa and 3.2kPa
Figure 13 Mff, MUt andMUd non recoverable compliance at 0.1 kPa and 3.2 kPa
Figure 6.1 Setematic penetrometer – figure 1 (EN1426); RB365G Ring and Ball (EN1427); Brookfield Rotational Viscosimeter (EN 12596)
Figure 6.2 Base Bitumens Master Curves
Figure 6.3 a) Fine Crumb Rubber b) Granulate Rubber Figure 6.4 Crumb Rubber grading curve
Figure 6.5 Mastic mixing process
Figure 6.6 DSR used: a) Bohlin - Gemini 200 b) Anton Paar – Smart Pave 102 c) Anton Paar – Smart Paar – MCR 302
Figure 6.7 – Z_8.5_1.2_5, DEM model of the DSR sample (in blue the bitumen spheres, in red the Crumb Rubber Spheres, in yellow the limestone filler
spheres)
Figure 6.8 – Z_SMA, DEM model of the DSR sample (in blue the bitumen spheres, in yellow the limestone filler spheres)
Figure 6.9 Master Curves of mastics made with Unmodified Bitumen Figure 6.10 Master Curves of mastics made with Zero Bitumen Figure 6.11 Master Curves of mastics made with A Bitumen
Figure6.12 Black diagram of mastics made with Unmodified Bitumen Figure 6.13 Black diagram of mastics made with Zero Bitumen Figure 6.14 Black diagram of mastics made with A Bitumen
Figure 6.15 MSCR test results at @58°C for the mastics made with the unmodified bitumen
14
Figure 6.16 Non-recoverable compliance at 0.1 kPa and 3.2 kPa for the mastics made with the Unmodified bitumen
Figure 6.17 MSCR test results at @58°C for the mastics made with the Zero bitumen
Figure 6.18 Non-recoverable compliance at 0.1 kPa and 3.2 kPa for the mastics made with the Zero Bitumen
Figure 6.19 MSCR test results at @58°C for the mastics made with the A bitumen.
Figure 6.20 Non-recoverable compliance at 0.1 kPa and 3.2 kPa for the mastics made with the A bitumen.
Figure 6.21 Z_SMA and Z_8.5_1.2_5 3D DEM G*Master Curve comparison. Figure 6.22 Z_SMA and Z_8.5_1.2_5 3D DEM δ Master Curve comparison. Figure 6.23 Total mixture and mortar grading curves
Figure 6.24 Mortar mixing process
Figure 6.25 Mould and mortar samples extraction. Figure 6.26 Kinexus – Malvern rheometer.
Figure 6.27 Kinexus – Malvern temperature chamber. Figure 6.28 Mortar samples installation.
Figure 6.29 Mortar MoA_7_1_5 and mastic A_7_1_5 master curves comparison
Figure 6.30 Mortar MoA_8.5_1.2_5 and mastic A_8.5_1.2_5 master curves comparison
Figure 6.31 Mortar MoA_7.5_0.75_5 and mastic A_7.5_0.75_5 master curves comparison.
Figure 6.32 Mortar MoA_8_1_6 and mastic A_8_1_6 master curves comparison.
Figure 6.33 Mortar MoA_SMA and mastic A_SMA master curves comparison Figure 6.34 Mortar samples G*master curves comparison
Figure 6.35 Mortar samples δ master curves comparison Figure 1.A Bohlin Gemini 200 device
Figure 2.A Anton Paar MCR 302 Figure 3.A Anton Paar Smart Pave 102
15
LIST OF TABLES
Table 2.1 Relationship between bitumen components and structure Table 3.1 Main bitumen characteristics
Table 4.1 Main bitumen characteristics
Table 4.2 Limestone filler main characteristics Table 4.3 Cement main characteristics
Table 4.4 Mastics volumetric composition Table 4.5 Properties of the DEM models Table 4.6 Mastics Burger Parameters Table 4.6 RCR results at 46 and 58°C
Table 4.7 - Maximum shear contact force inside the mastic sample [*10-3 N/m]
Table 4.8 - Particles displacements of MC and MCF models in x (xdisp), y (ydisp) and z (zdisp) direction [mm]
Table 5.1 Properties of the 50/70 pen bitumen Table 5.2 Main fillers characteristics
Table 5.3 Weights percentages of fillers on bitumen Table 5.4 Rutting parameters of Mff, MUt and MUd
Table 5.5 Mff, MUt and MUd average percentage of recovery at 3.2 kPa Table 6.1 Properties of the Unmodified Bitumen .
Table 6.2 Properties of Zero – Bitumen Table 6.3 Properties of A – Bitumen
Table 6.4 Bitumen Linear Visco-Elastic range Table 6.5 Limestone filler main characteristics Table 6.6 Crumb rubber main characteristics
Table 6.5 Mastics percentages in weight of aggregates for the UNMODIFIED BITUMEN
Table 6.6 Mastics percentages in weight of aggregates for the A BITUMEN Table 6.7 Mastics matrix composition for the UNMODIFIED BITUMEN Table 6.8 Mastics matrix composition for the ZERO BITUMEN
Table 6.9 Mastics matrix composition for the A BITUMEN
Table 6.10 Mastics volumetric composition for the UNMODIFIED BITUMEN Table 6.11 Mastics volumetric composition for the ZERO BITUMEN
Table 6.12 Mastics volumetric composition for the UNMODIFIED BITUMEN Table 6.13 Mastics composition for the UNMODIFIED BITUMEN
Table 6.14 Mastics composition for the ZERO BITUMEN Table 6.15 Mastics composition for the A BITUMEN Table 6.16 Properties of the DEM models
Table 6.17 Mastics Burger Parameters
Table 6.18 Bitumen Linear Visco-Elastic range Table 6.19 Bitumen Linear Visco-Elastic range Table 6.20 Bitumen Linear Visco-Elastic range
Table 6.21 Accumulated strain values at the end of 10th cycle at 0.1kPa and 3.2kPa for the mastics made with the unmodified Bitumen
16
Table 6.22 Average percentage of recovery at 0.1 and 3.2 kPa for the mastics made with the Unmodified Bitumen
Table 6.23 Accumulated strain values at the end of 10th cycle at 0.1kPa and 3.2kPa for the mastics made with the Zero bitumen
Table 6.24 Average percentage of recovery at 0.1 and 3.2 kPa for the mastics made with the A Bitumen
Table 6.25 Accumulated strain values at the end of 10th cycle at 0.1kPa and 3.2kPa for the mastics made with the A bitumen.
Table 6.26 Average percentage of recovery at 0.1 and 3.2 kPa for the mastics made with the A Bitumen
Table 6.27 Maximum shear contact force inside the mastic sample [*10-3 N/m]
Table 6.28 Particles displacement of Z_SMA and Z_8.5_1.2_5 models in x y z direction [mm]
Table 6.29 Normalized SMA grading curve Table 6.30 Mortar percentage composition. Table 6.31 Mortar components density Table 6.32 Mortar target density Table 6.33 Mould description Table 6.34 Mortar samples density
17
1.
INTRODUCTION
The analysis of the flexible pavements response to the stresses imposed by heavy vehicles and temperature change, starts from the rheological study of the bituminous mastics. In fact, the bituminous matrix influences the stress-strain response of the pavement structure in terms of fatigue cracking at low temperatures (high load frequency) and permanent deformations, with consequent rutting phenomenon, at high operating temperatures (low load frequencies). The Filler - Bitumen interaction increases the mastic stiffness, improving the mixture shear-stress response at high operating temperatures; in this conditions, in fact, the bitumen exhibits a deformation response predominantly viscous and its rheological behavior tends to a non - Newtonian fluid. In recent years research has therefore focused its attention on the study and design of bituminous mixtures that were able to optimize the amount and type of filler, searching for high performance standards and reusing waste materials, in order to reduce the environmental impact. In this context, the following work places its bases on the use and the optimization of industrial reclaimed filler able to give to the mixture higher performance than those produced using common mineral filler. In particular, in this thesis bituminous mastics containing three different types of fillers will be studied:
• waste fillers from bleaching clays used for the decoloring process in the food industry;
• rubbery fillers from the mechanical shredding of end of life tires .
The aim of this thesis is also to implement innovative research methods that combine the laboratory rheological evaluation with the 3D numerical modeling of the laboratory tests, in order to better understand the micro-mechanical response of asphalt concrete. Part of the asphalt multiscale model approach will be here used; this approach is fundamental to understand the rheological phenomena, through volumetric study of individual components, morphological identification and mechanical properties analysis in the different size scales (bitumen, cement and mortar) (Figure I.1)
18
Figure I.1 Asphalt mixture multiscale Analysis
Therefore, the micromechanical analysis associated to rheological analysis at different scales of size, it will allow to analyze the interaction and the role of each mixture constituent material. Through this study will be possible to identify the optimum combination to improve the asphalt layer performance. In particular, with reference to the experimental analysis in the laboratory, binders and the bituminous mastics will be tested using a Dynamic Shear Rheometer (DSR) in different testing configurations. This device is able, through the application of a sinusoidal dynamic load, to simulate the load conditions to which the bitumen matrix is subjected during its service life. Fundamental rheological parameters of the studied mastic will be extrapolated with dynamic tests in linear viscoelastic range and creep tests with different load mode.
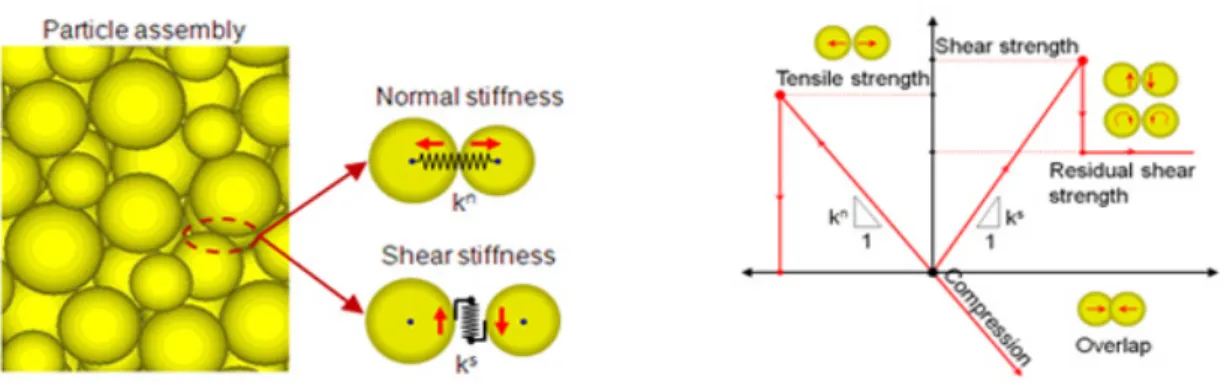
In the first analysis, standardized bitumen test will be validated on bituminous mastics containing traditional mineral filler and, in the second analysis the same methods will be applied on mastics containing the industrial reclaimed fillers. With regard to the modelling, the Discrete particle Element Method (DEM) considers particles as distinct interacting bodies, and it is an excellent tool to investigate the micromechanical behavior of mastics. Interactions between particles are considered to be a dynamic process with states of equilibrium developing whenever the internal forces are in equilibrium. Contact forces and displacements of an assembly are found by tracing the movements of individual particles. A commercial three-dimensional DEM code called Particle flow code (PFC), developed by Itasca Consulting Group, was used in this study. In PFC3D, particles are spheres that move independently and interact at contact points. The adoption of micromechanical three-dimensional discrete element approach, will be used to assess the real time-dependent behavior of asphalt mastics
19
and to predict its performance through the better understanding of its internal interaction. In this way Frequency Sweep Test will be simulated and the numerical results will be compared with the experimental ones. Figure I.2 shows the thesis experimental program.
Figure I.2 Experimental program.
Samples production, modeling and test execution were carried out at the School of Engineering and Architecture Engineering of Bologna, in the laboratory of DICAM (Department of Civil, Chemical, Environmental and Materials Engineering), Road section.
In addition, the research related to the study of mastics and asphalt mortar modified with rubber powder from End of Life Tires (ELTs) was performed in collaboration with the laboratories of Nottingham Transport Engineering Centre of the University of Nottingham.
20
2. LITERATURE REVIEW: MATERIALS
2.1 Introduction
Asphalt mixtures are made of bitumen, filler, fine aggregates, coarse aggregates and air voids. Bitumen is the main element governing the mixture behavior and, with filler it constitutes the adhering agent mastic of the mixture. Incorporating fine aggregates with mastic constitutes the mortar scale; a material that exists between coarse aggregates (Elnasri M. 2014) and reflects the mechanical interactions between fine aggregates and mastic. In this chapter, therefore, the single components in the various scales of study are analyzed. Starting from the analysis of the bitumen and the mineral filler physical and chemical properties, a literature review of the bitumen-filler interaction within the bituminous mastics is needed. Nowadays, however, it is not possible to ignore the study of alternative materials instead of raw materials usually used in the production of asphalt mixtures. Therefore, detailed studies on the use of non – common fillers are presented, reviewing literature researches on nanoclays, fillers from C&D and industrial waste materials and fillers from ELTs crumb rubber being adopted within bituminous mortars.
21
2.2 Bitumen - Filler System: Mastic
2.2.1 Bitumen
2.2.1.1 Bitumen structure and constitution: SARA fractions
Bitumen is a byproduct of the distillation process of the crude oil in refineries. It is an oily, viscous and flammable material. Bitumen properties highly depend on crude oil type and production technology. Production technology is adjusted to the crude oil type: extra heavy, heavy, medium or light. Nowadays heavy oils are processed more frequently than 20–30 years ago, therefore due to the use of different types of crude oils, the distillation residue can differ significantly (Paliukaite M. et al. 2014). At room temperature, bitumen has solid texture, color from black to dark brown, and has a thermoplastic behavior, excellent adhesion and water resistance. The bitumen is comparable to a hydrocarbons compounds mixture, with a small amount of structurally analogous heterocyclic species and functional groups containing sulfur, nitrogen and oxygen atoms. Bitumen can be described as a colloidal system consisting of high molecular weight asphaltene micelles dispersed in a lower molecular weight maltenes (resins, aromatics and saturates). Fractional composition of bitumen (asphaltenes, resins, aromatics and saturates) has a large influence on the bitumen performance. Bitumen is widely used in the field of pavement construction due to its excellent mechanical properties, which also depends on bitumen fractional composition (Paliukaite M. et al. 2014). Asphaltenes, resins, aromatics and saturates, mostly called SARA, can be determined by various methods. All methods are based on the difference in solubility of the particular chemical groups of bitumen. The traditional method used to determine bitumen fractional composition is column chromatography, commonly known as SARA method. Fractional composition of bitumen are descibed below:
• asphaltenes are macromolecules of high molecular weight, responsible for the high viscosity of the bitumen, they represent the specific component. Microscopically are amorphous solids consisting of mixtures of hydrocarbons, have an aromatic structure, that is not cyclic saturated (Figure 2.1);
22
Figure 2.1 Molecular model of asphaltenes (“Evaluation of bitumen fractional composition depending on the crude oil type and production technology”).
They are black or brown and insoluble in n-heptane. They are distinguished because of their high polarity, which can be translated as the presence of molecules in which the individual polar bonds are not placed in a perfectly symmetrical manner and therefore not in balance. The molecular weights are very variable, ranging between 600 and 300,000 mol. The evaluation of the molecular weight of asphaltene particles is, indeed, one of the most controversial aspects of the studies on bituminous materials. Asphaltenes, generally, are present in a concentration range between 5% and 25% by weight, and they have a great effect on the bitumen characteristics: as consequence of the percentage increasing of these fraction within the bitumen, it can be noticed a penetration value decreasing, viscosity and softening point increasing (Mazzotta F. 2010). This fraction has a high molecular weight (800–3500 g/mol), and it is insoluble on n-heptane. Their elemental analysis is stable from one bitumen to the other with H/C ratio between 0.98 and 1.56. Their solubility parameter ranges between 17.6 and 21.7 MPa0.5 and their density at 20 °C is close to 1.15 g/cm3 (Paliukaite M. et al. 2014);
• resins perform a dispersing action of asphaltenes in oily body of the bitumen and then give it stability and elastic properties. Compounds are soluble in n-heptane, have a structure very similar to that of the asphaltenes; submit to view a dark brown color with solid or semi-solid consistency, similar to that of the whole bitumen. The resins are polar in nature and have remarkable adhesive properties; perform the function of dispersing or peptizers for the asphaltic
23
macromolecular structures. They are of the co-solvents for oils and asphaltenes, mutually insoluble if not present in appropriate concentrations. Constitute a part of bitumen of between 10% and 25% by weight and have a molecular weight varying between 500 and 50000 (Figure 2.2) (Mazzotta F. 2010). Their solubility parameter ranges between 17.6 and 21.7 MPa0.5 and their density at 20 °C is close to 1.15 g/cm3 (Paliukaite M. et al. 2014);
Figure 2.2 Molecular model of resins (“Evaluation of bitumen fractional composition depending on the crude oil type and production technology”).
• maltenic oils are divided into two classes: saturated and aromatic oils. The division is made according to the types of chemical bonds that prevail in the structure. The aromatic oils are representable as a viscous liquid, characterized by a dark brown color, containing many low molecular weight compounds with aromatic rings. They are made from non-polar carbon chains in which the unsaturated rings systems dominate (aromatic). They have a high solvent power towards the other high molecular weight hydrocarbons. The aromatic constitute is the main bitumen fraction, between 40% and 60% by weight. Their molecular weight is comprised between 300 and 2000 (Figure 2.3) (Mazzotta F. 2010).Theirsolubility parameter lies between 18.5 and 20 MPa0.5 and their
24
Figure 2.3 Molecular model of maltenic oils (“Evaluation of bitumen fractional composition depending on the crude oil type and production technology”))
• saturated oils are a viscous liquid, yellowish white in color, composed essentially saturated long chain hydrocarbons, some of which with ramifications, and naphthenes. They are non-polar compounds, of molecular weight similar to that of the aromatics, between 300 and 1500; constitute a percentage between 5% and 20% by weight of the bitumen (Paliukaite M. et al. 2014);
Figure 2.4 Molecular model of satured oils (“Evaluation of bitumen fractional composition depending on the crude oil type and production technology”).
Saturated contain the majority of the waxes present in the bitumen, which are in the form paraffin. The saturated and aromatic oils can be considered as elasticizing agents of the bitumen Their solubility parameter is between 15 and 17 MPa0.5 and their density at 20 °C is around 0.9 g/cm3 (Paliukaite M. et al. 2014).
2.2.1.2 Bitumen physical and chemical properties
From a physical point of view the bitumen has a typical density between 1.01 and 1.04 g/cm3. This range is influenced from the crude oil characteristics and it is assumed that the bitumen density is directly proportional to the source oil density. The density depends on the amount and quality of the carbon atoms, and it influences both refining and extraction. The crude oil density is measured in API degrees (American Petroleum Institute) and it is possible to define heavy oils, those having API value smaller than 25 (specific gravity greater than 0.9) and light oils those with API value greater than 40 (lower specific weight of 0.83). Referring to a natural oil is generally called bitumen if its density exceeds 1g/cm3 at 15.6 °C. The bitumen has a glass transition around -20
25
°C, although it varies in a very wide range from +5 ° C to -40 ° C, as a function of the origin of the crude and the production process. Therefore, from a thermodynamic point of view the bitumen is defined as a very viscous liquid at room temperature (Leseur D. 2009). The chemistry of the bitumen study was conducted since the ‘80s, in the United States, within the Strategic Highway Research Program (SHRP). The chemical complexity of the bitumen analysis lies in its internal composition identified in a mixture of hydrocarbons. As mentioned in the previous paragraphs, the hydrocarbons are chemical compounds formed exclusively from carbon and hydrogen and, according to the proportions between these two elements and to their molecular structure, they are divided into several series:
• paraffinic or alkanes are hydrocarbons also called saturated because their molecules are incapable to incorporate other hydrogen atoms from the time that the nature of their links is of simple type. This type of hydrocarbon form linear chains, or branched. The simplest paraffin is methane (CH4) which is the main
natural gas, but there is also ethane (C2H6), propane (C3H8) and butane (C4H10).
The propane and butane can be liquefied at low pressures and form what is called LPG (Low Pressure Gas) or LNG. The paraffins containing from 5 to 15 carbon atoms molecules are liquid at room temperature and pressure. Above 15 atoms they are extremely viscous or even solid (Leseur D. 2009);
• naphthenic are saturated hydrocarbons constituted by one or more rings of carbon atoms, to which may be joined paraffinic side chains. The general formula is CnH2n+2-2Rn where Rn is the number of rings present in the molecule.
The most stable rings are those in 5 (cyclopentane) or 6 (cyclohexane) atoms of C;
• unsaturated are hydrocarbons that have at least one double atom carbon bond; • aromatic are hydrocarbons characterized by the presence of an aromatic ring; • resins and asphaltenes are called NSO compounds because in the molecule are
present one or more heteroatoms, i.e. atoms different from carbon and hydrogen, and usually are nitrogen (N), sulfur (S) or oxygen (O). This molecular classification of the oils is applied to the corresponding bitumen. For example, the Venezuelan bitumen are generally known as naphthenic. The foregoing shows that the elemental composition of a bitumen resulting from
26
the extraction source although it is very difficult to make a geographical generalization.
The most abundant element in the bitumen is carbon, typically present between 80-88% by weight, then the hydrogen present between 8-12% by weight. The presence of hydrocarbons is accordingly greater than 90% by weight with a H/C ratio equal to 1.5. The H/C ratio assumes intermediate values between those of the aromatic structures with a H/C equal to 1, and that of saturated alkanes with a H/C close 2. Inside the bitumen are also present, heteroatoms such as sulfur between 0-9% by weight, nitrogen between 0-2% by weight, and oxygen between 0-2% by weight. Generally there are also traces of metals, the most numerous are the vanadium, up to 2000 parts per million (ppm) and nickel up to 200 ppm. The sulfur is generally the more polar atom present, is in the form of sulfides, thiols and, to a lesser extent, sulfoxides. The oxygen is typically present in the form of ketones, phenols, and to a lesser extent, of carboxylic acids. Nitrogen typically shaped structures with pyrrole and pyridine rings and shape even amphoteric species such as 2-quinolones. The chemical bonds that link together the molecules are relatively weak and can easily broken by heating or applying tangential actions, this fact explains the viscoelastic and thermoplastic nature of the bitumen (Leseur 2009). All bitumen molecules can be classified into two functional categories:
• polar; • non-polar.
The polar molecules form a network and provide to the bitumen elastic properties. Non-polar form a continuous body, arranged around the net, which gives the viscous characteristics to the material. From the relationship between these two molecular classes depends the binder properties. Bitumens having a large amount of non-polar molecules with high molecular weight, show a too brittle behavior at low temperatures. In order to have an accurate bitumen study, it is fractionated in homogeneous molecular groups, through methods that use, as basic principles for the separation the solubility in different solvents, the differences in molecular weight or the detection of particular chemical types. The quantitative relationships between the various components are then determined using these methods to split the bitumen in a few
27
groups of molecules that have similar properties and can be classified in colloidal schematic. The used methods can be classified into three main categories:
• selective solvent;
• chromatographic techniques of adsorption and desorption; • chemical precipitation procedures.
The methods using selective solvents provide for the sequential treatment of the bitumen with increasing polarity solvents. Though these methods should avoid contact with the bitumen and supports that could alter, they are not frequently used because they do not allow to isolate those fractions not sufficiently different from each other. On the contrary, chromatographic techniques of selective adsorption and desorption instead have had a remarkable diffusion especially in the field of research (Mazzotta F. 2012). The principle used, common to these methods, is based on the separation of more polar and less soluble components, the asphaltenes, by precipitation in a non-polar paraffinic solvent. The solution obtained is then introduced into a chromatographic column in which the components are first adsorbed by a support alumina then desorbed mediated the use of solvents in greater polarity thus allowing the isolation of the fractions with a gradually increasing polarity. The different techniques can be distinguished depending on the kind of solvent used, depending on the type of porous support employed, and according to the method of which use is made for the quantization of each fraction. The chemical precipitation methods are substantially obtained as a variation of the analytical method developed by Rostler and Sternberg. Once obtained the separation of the asphaltenes by precipitation in n-pentane, the residual solution, composed by malthenes, is treated with increasing concentration solutions of sulfuric acid (H2SO4) and then with sulfuric acid fumes
containing 30% of SO3 (sulfur trioxide ). The procedure described above allows and
favors the precipitation thus allowing a quantitative evaluation of three other molecular classes, having gradually lower reactivity. These are called first acidaffine and second acidaffine. The remaining fractions of malthenes which do not react with sulfuric acid fumes are called paraffins. The Richardson method divides the bitumen into four classes based on solubility in certain solvents:
• carboidi are insoluble components in carbon disulfide (CS2);
28
• asphaltenes are insoluble elements in low-boiling alkane;
• malthenes are soluble elements in the low-boiling alkanes which may, in turn, be further subdivided by the use of chromatographic processes of adsorption and elution. The malthenes facts are first adsorbed on silica gel and then it proceeds to the step elution: respectively, eluting with hexane, toluene, chloride of methylene/methanol are separated saturated oils, aromatic oils and resins.
2.2.1.3 Bitumen colloidal model
The particular properties of the bitumen against mechanical stresses have led to attributing to this a colloidal structure, similar to a particular blend in which a substance is located in a state finely dispersed, intermediate between the homogeneous solution and, the heterogeneous dispersion. Within the bitumen there is a structure able to respond differently to deformation as a function of the load frequencies. Such behavior, as opposed to typical of the newtonian fluids, is only found in bitumen containing asphaltenes; it therefore has a direct association between the colloidal nature and the presence of asphaltene core surrounded by aromatic components with high molecular weight, the resins. Each asphaltene is in the center of a structure, called "micelle", which is surrounded by the resins (the polar character which is proportional to the asphaltene distance); resins interact with the aromatic oils that form the line of the structure and can interface with saturated oils (non-polar phase in which is immersed the micelles). If the amount of resin is high, the asphaltenes are completely solvated or peptizers, this allows the micelles to have good mobility in the bitumen achieving a non-newtonian fluid behavior at high temperatures elastic behavior at low temperatures. A bitumen having such features is called a sol type (Figure 2.5a). In the opposite case, in the absence of resins, asphaltenes are added between them to form a continuous network where the lighter components are limited to fill the voids. It has a fluid type non-newtonian behavior at high temperatures and an elastic solid at low temperatures, the bitumen is defined gel-type (figure 2.5b) (Leseur D. 2009).
29
Figure 2.5 a) bitumen sol structure b) bitumen gel structure
In practice the most common bitumens have intermediate features between these two structures. The bitumen behavior depends on the temperature and on the micelles state of aggregations, i.e. from the ratio between asphaltenes, resins, saturated and aromatics. Table 2.1 associates the specific structure to the bitumen compound. The bitumen with "intermediate" behavior have elasticity and better mechanical properties then the sol, while the gel-type bitumens have improved mechanical strength improved, but worse elastic properties.
Table 2.1 Relationship between bitumen components and structure
Structure Asphaltenes [%] Resins [%] Malthenes [%] Gel >25 <24 >50 Sol <18 >36 <48
Intermediate from 21 to 23 from 30 to 34 from 45 to 49
The bitumen behavior depends on the proportion of saturated oils in the mixture because of their capacity to decrease the solvent power of malthenes on the asphaltenes. As a direct result, high content of saturated can lead to flocculation of the asphaltenes, thereby transforming the structure into another, as similar to that of the gel. If asphaltenes are highly branched, their interaction with the resins is greater, and therefore are less affected by the destabilizing effect of the saturated. From the qualitative point of view the rheological properties of bitumens depend from the asphaltenes amount. It is therefore possible to observe that at constant temperature the viscosity of a bitumen tends to increase wit asphaltenes concentration increasing. At low and average temperatures the bitumen rheology is strongly influenced by the degree of asphaltene agglomerates association and by the presence of other species that favor such associations in the system. It then assumes that in the mixture, an equal asphaltenes content, increasing the percentage presence of aromatic and maintaining
30
constant the saturated/resins ratio are obtained negligible effects on the rheology and a minimum reduction of the deformability (Leseur 2009). Conversely keeping constant the ratio resin/aromatic and increasing saturated bitumen becomes "softer". In general it is assumed that the increase in the resin content increasing the hardness of the bitumen, in other words increase in viscosity, reducing penetration of the deformability and shear. At the macroscopic level, the behavior of the bitumen is determined by the compatibility and the interactions between the different components in the mixture. To simplify the problem two different synthetic parameters, directly related to the rheological behavior, are defined. Colloidal instability index Ic defined as:
I = ; (2.1)
and Rc compatibility ratio expressed by the formula:
R = . (2.2)
The numerator of the equation 2.1 shows the percentage of molecules that give body to the bitumen (asphaltenes) and the flocculating agents (saturated oils), while the denominator shows the sum of the percentages of solvents (aromatic oils) and of the peptizers (resins) agents. Ratio growing is followed by the transition from a dispersed sol type system to a flocculated gel-type. In equation 2.2 are instead related most reactive components with those less reactive: in general are considered acceptable values higher than 0.5 (Leseur 2009).
2.2.2 Mineral Filler
Mineral filler term refers to the fraction of the mineral aggregate, which mostly passes the 75 µm sieve. Filler can be defined as "solid material capable of changing the physical and chemical properties of materials through surface interactions and their physical characteristics". They may contain natural materials such as calcium carbonate, and materials obtained from industrial processes such as fly ash; other common fillers can included silica, kaolinite, mica and feldspar. The most widely used filler in bituminous mixtures is mainly composed of calcite (a form of calcium carbonate) generated from the micro-organisms solidification during the Earth's crust
31
formation. It may also contain magnesium carbonate, silica, clays, iron oxides and organic material. Also Portland cement is commonly used as filler in the asphalt increasing the mixture durability and its resistance to cracking and rutting failures.
Figure 2.6 a) Limestone Filler b) Portland Cement
The filler is important because of the surface area involved, and that properties of an asphalt pavement may be improved by the use of filler include strength, plasticity, amount of voids, resistance to water action and resistance to weathering; usually asphalt mixtures have been designed to include mineral filler (Liao 2007). Different filler types may be used interchangeably, and different quantities of one type may satisfy a single mixture design (Tunnicliff 1962). Kim et al. (2003) studied that the filler type affected the fatigue behavior of asphalt binders and mastics. Fillers stiffen the binders, providing to increase the resistance to micro cracking and, thus, increase fatigue life. Traxler and Miller (1936) classified filler characteristics as follows:
• primary characteristics of fundamental importance: particle size, size distribution, and shape;
• primary mineralogical characteristics of less importance: texture, hardness, strength, specific gravity and wettability;
• secondary characteristics dependent on one or more primary characteristics: void content, average void diameter and surface area.
2.2.2.1 Limestone Filler
The limestone filler is the product of limestone crushing and is configured as a fine aggregate whitish in color and characterized by an amorphous structure. Limestone filler is one of the most suitable materials for the mastics production because of the mineralogical and chemical nature of the origin rock (proportional to its specific surface area and, therefore, the presence of very fine elements); it is, in fact, able to give advantages to the asphalt mixture such as:
32 • selective absorption of the oils;
• improvement of the thermal susceptibility of the bitumen, due to a decrease in penetration and by a considerable increase in the softening point;
• improvement of binding action and adhesion to the aggregates;
• improvement of mixtures mechanical stability and resistance to the permanent deformations generated by the traffic action and, therefore, a increased strength and durability.
Specifically, the limestone filler should comply with the following requirements: • calcium carbonate content ≥ 75% by mass; typically CaCO3 ≈ 95%;
• clay content (adsorption of methylene blue) ≤ 1.20g /100g;
• organic content (TOC) for the type L ≤ 0.20% by mass; for the type LL ≤ 0.50% by mass; typically FeO2 ≈ 0.2% to ≈ 0.4% SiO2;
2.2.2.2 Portland cement
Cement is a product from the milling and baking stones of various types that, mixed with water, returns with chemical and physical reactions, to its original solid state. It is used as a binder in mixture with inert materials (sand, gravel) to form the mortar and to produce concrete; in this case it is, therefore, used for the construction of buildings and structures in reinforced concrete. It, however, can be used as filler to produce bituminous mastics that, mixed with a suitable size and shape aggregates, improves asphalt mixture characteristics compared to the traditional ones. There are different types of cement, different to the composition, for the strength properties and durability and, therefore, for the use. From the chemical point of view it is in general a mixture of silicates and calcium aluminates, obtained by firing limestone, clay and sand. The material obtained, finely ground, once mixed with water hydrates and solidifies gradually over time. One of the most used cement is Portland cement, which is also configured as the most suitable type of cement to produce mastics. The raw materials for the production of Portland are minerals containing:
• calcium oxide (44%); • silicon oxide (14.5%); • aluminum oxide (3.5%); • iron oxide (3%);
33 • magnesium oxide (1.6%).
The extraction takes place in the slots arranged near the factory (although this is generally constructed of the material where it is possible to provide, with little expense for transport), which generally have already the desired composition, while in some cases it is necessary to add clay or limestone, or iron ore, bauxite or other waste of foundry materials. The mixture is heated in a special furnace consists of a huge cylinder (called Kiln) horizontally arranged with slight inclination and rotating slowly. The temperature is grown along the cylinder up to about 1480 °C so that minerals are aggregated, but does not melt. At low temperatures calcium carbonate (limestone, stones) splits itself into oxide calcium and dioxide carbon (CO2); at the high
temperatures calcium oxide reacts with silicates to form calcium silicates (Ca2Si and
Ca3Si). It also forms a small amount of tricalcium aluminate (Ca3Al) and tricalcium
aluminoferrite (Ca3AlFe). The resulting material is generally referred to as clinker.
The clinker may be stored for years before producing the cement, provided to avoid contact with the water. The theoretical energy needed to produce the clinker is about 1700 J/g. This entails a great energy requiring for the production of cement and, therefore, a significant release of carbon dioxide into the atmosphere, greenhouse gases. The powder thus obtained is the cement ready to use, which has obtained a composition of the type:
• 64% of calcium oxide; • 21% silicon oxide; • 5.5% of aluminum oxide; • 4.5% of iron oxide; • 2.4% magnesium oxide; • 1.6% sulfates;
• 1% other materials, including especially water.
2.2.3 The role of mineral fillers in asphalt mastics
2.2.3.1Mastic characteristics depending on filler physical properties
Several studies have showed that the filler physical properties affects the bitumen-filler interaction and consequently the mastic stresses response. In particular, Anderson and Goetz (1973) examined the stiffening effect of a series of one-sized fillers ranging
34
from 0.6 to 75 mm (passing through no. 200 sieves). They concluded that both the size of the filler and bitumen binder composition had a significant influence on the stiffening effect and that a proportion of the bitumen could be replaced by fine filler (<10 µm), but the mixtures produced were very sensitive to changes in the filler type. Chen and Peng (1998) investigated the effect of mineral fillers on tensile strength of bitumen-filler mastics. They found a considerable effect of particle size on tensile strength of bitumen-filler mastics. The 5µm bitumen-filler mastic (size distribution was 100% passing 5µm) exhibited higher tensile strength than the 75 µm bitumen-filler mastic (size distribution was 100% passing 75 µm). At a given filler concentration, smaller particles with higher surface areas carried more tensile loads than bigger ones. If the distance between particles was smaller than the stress concentration area, there would be an overlap area between particles, whereas the strength of the particulate filled composite was deteriorate. In addition to particle size and surface area, filler voids content can affect the mastic stiffness, increasing the shear stress response. Faheem et al. (2012) have demonstrated that the Rigden fractional voids can demonstrate the potential of stiffening effect of fillers. Beside they have found that the modified binders could have significantly different interactions with fillers. In terms of mastic volumetrically analysis, several researchers have evaluated the filler-filler interaction and bitumen-filler in the two regions of diluted and concentrated suspensions, in order to assess the stiffening effect that the filler has on the mastic. In a diluted suspension filler particles are limited to hinder the flow of the bitumen because the interparticle distance is compared to the average size of the particles; in a concentrated suspension the interparticle distance is reduced: the stiffness increases so rapidly and the filler-filler interaction and filler-bitumen begins to dominate the rheological behavior of the mastic. Faheem and Bahia (2009) proposed a conceptual model able to determine quantitatively the stiffness influence of the filler on the mastic volume. The graph in Figure 2.7 shows the trend of the ratio between the rigidity of the mastic and stiffness of the bitumen in a simple function of the volume fraction of filler.
35
Figure 2.7 G* Ratio vs Filler volume fraction (“Conceptual phenomenological model for interaction of asphalt binders with mineral fillers”).
The model introduces three definitions:
• initial stiffening rate: stiffness increase in the diluted region. The mastic stiffness increasing is low and exhibits a linear characteristic;
• terminal stiffening rate: stiffness increase within the concentrated region, due to the free bitumen and bitumen-filler interaction;
• critical filler concentration: the value of the volumetric concentration of filler in correspondence of the passage from dilute to concentrated phase to phase, obtained by the intersection between the two asymptotic lines.
• the evaluation of the critical volume of filler is needed because a too high amount would lead to an increase of the fatigue resistance but also a worse performance of the bituminous conglomerate in terms of rutting resistance.
The rheological behavior of mastic is influenced by the distribution, the size, the degree of dispersion and by the specific surface of the filler particles. Several studies showed that between bitumen and filler there is a chemical interaction; however, this reaction does not go to influence the linear viscoelastic behavior of the mastic: what matters most is the volume fraction of filler. The filler particles, at the time of mixing, are incorporated as a part of the bitumen and can absorb the fraction of light oils of the same leading, therefore, to stiffening. The amount of bitumen that coats the filler particles is called fixed bitumen
36
and represents the solid phase of the mixture, while the remaining quantity is called the free bitumen and represents the fluid phase (Figure 2.8).
Figure 2.8 Schematic diagram of bitumen-filler system (Fatigue Characteristics of Bitumen-Filler Mastics and Asphalt Mixtures)
The actual volume of filler will thus be greater, as the actual solid phase is formed by the filler particles coated by the:
= (2.3)
= ! ∙ (2.4)
Where:
• Mf = mass of filler in putty [GSF = filler density [g / cm3];
• Mb = mass of the bitumen in the sealing compound [g];
• Sb = bitumen density [g/cm3];
• VfR = maximum volume fraction of filler granules in a dry sample compacted.
2.2.4 The role of mineral fillers in asphalt mixtures - The Stone Mastic Asphalt (SMA)
Mineral fillers serve a dual purpose when added to asphalt mixtures. The proportion of mineral filler that is finer than the thickness of the asphalt film blends with asphalt cement binder to form a mortar or mastic that contributes to improved stiffening of the mix. Particles larger than the thickness of the asphalt film behave as mineral aggregate and hence contribute to the contact points between individual aggregate particles (Puzinauskas 1969). Furthermore, they affect the workability, moisture sensitivity,
37
stiffness and ageing characteristics of Hot Mix Asphalt (HMA) (Mogawer et al. 1996). Also, fillers vary in gradation, particle shape, surface area, void content, mineral composition, and physico-chemical properties and, therefore, their influence on the properties of HMA mixtures also varies. The maximum allowable amount should be different for various types of filler. The filler also influences the optimum asphalt content (OAC) in bituminous mixtures increasing the surface area of mineral particles and, simultaneously, the surface properties of the filler particles modify significantly the rheological properties of asphalt such as penetration, ductility, and also those of the mixture, such as resistance to rutting. In order to improve the pavement performance, it is necessary to ensure that adequate behavior of the bituminous mixtures is achieved, which depends essentially on their composition (Muniandy et al. 2013). Therefore, selecting the proper type of filler in asphalt mixtures would improve the filler's properties and, thus, enhance the mixture's performance (Kandhal 1981). Several studies investigated the use of cement bypass dust (CBPD) as filler in asphalt concrete mixtures. Results indicated that the substitution of cement with limestone filler produces the same optimum asphalt binder content as the control mixture without any negative effect on the asphalt's concrete properties (stability, flow, and voids in total mix, mineral aggregate, and those filled with asphalt). Kandhal and Parker (1998) stated that the influence that mineral filler can have on the performance of HMA mixtures depended on the particle size, fines can act as a filler or an extender of asphalt cement binder. In the latter case, an over-rich HMA mix can lead to flushing and rutting. In many cases, the amount of asphalt cement used must be reduced to prevent a loss of stability or pavement bleeding. Some fines have a considerable effect on the asphalt cement, making it act as a much stiffer grade of asphalt cement as compared with the neat asphalt cement grade and, thus, affecting the HMA pavement performance, including its fracture behavior. Tayebali et al. (1998) investigated the possibility of increasing the amount of fines in asphalt mixtures based on a washed sieve analysis, from a maximum of about 8% as currently specified, without adversely affecting the performance of the mixture. At the same time, it was also desirable to investigate the influence of the mineral filler type (crushed versus natural river sands, or combinations thereof) on asphalt (Marshall) mix design and on the shear permanent deformation performance. They found out that by increasing the amount of mineral
38
filler, the Marshall stability and unit weight increased. This procedure led to a higher shear resilient modulus due to increased unit weight without adversely affecting its rutting during the repeated shear testing. Previous research by Superior Performing Asphalt Pavements (Superpave) Mix Design (1996) showed that the addition of mineral fillers such as LSD to asphalt could improve the rutting resistance performance of asphalt. The mineral powder improved the high-temperature thermal properties, presumably because of its small particle size which resulted in a large area of interface between mineral powder and asphalt. Kallas and Puzinauskas (1967) believed that filler performed a dual role in asphalt-aggregate mixtures. A portion of the filler with particles larger than the asphalt film will contribute in producing the contact points between aggregate particles, while the remaining filler is in colloidal suspension in the asphalt binder, resulting in a binder with a stiffer consistency. They also found that the stabilities of asphalt mixtures increased up to a certain filler concentration, then decrease with additional filler. Muniandy et al. (2013) found that filler type and particle size directly affect the engineering properties of the asphalt mixtures. In addition to filling the voids, the fillers' components interact with the binder present in the mix, potentially making it stiff and brittle. The change in mix properties is strongly related to the properties of the filler.
Figure 2.9 Stone Mastic Asphalt composition
The effect of mineral fillers is more prominent in gap graded asphalt mixtures such as the Stone Mastic Asphalt (SMA) mixture that contains large amounts of fines. The SMA (or "non-slip wear mixture") is a closed waterproof mixture, created by mixing