Università Degli Studi Di Pisa
Facoltà Di Scienze Matematiche Fisiche e Naturali
Corso di Laurea Magistrale in Conservazione ed Evoluzione
Tesi di Laurea Magistrale
“Stress and habitat fragmentation in Eulemur collaris evaluated by
glucocorticoid metabolite levels in faecal samples”
Relatori: Candidata:
Prof.ssa Silvana Borgognini Michela Balestri
Prof. Giuseppe Donati
I TABLE OF CONTENTS ABSTRACT CHAPTER 1: INTRODUCTION 1.1 Defining stress 1.2 Physiological stress
1.3 Chronic stress effects 1.4 Measuring stress 1.5 Lemurs and stress 1.6 Coping with harsh environments: Madagascar 1.7 The red collared brown lemur: Eulemur collaris 1.8 Aim of the study
CHAPTER 2: MATERIALS AND METHODS
2.1 Sites 2.2 Subjects
2.3 Behavioural observation 2.4 Faecal samples collection
2.5 Validation of faecal glucocorticoids measurements 2.6 HPLC analysis
2.7 Glucocorticoid metabolites (GCM) analysis 2.8 Evaluation of a possible storage effect 2.9 Data analysis 1 3 3 4 10 11 14 15 18 21 26 26 28 30 31 34 35 35 36 36
II
CHAPTER 3: RESULTS
3.1 Validation of faecal GCs measurements 3.2 HPLC analysis
3.3 Storage effect on faecal GCM levels
3.4 Faecal GCM levels in relation to reproductive stages 3.5 Faecal GCM levels in relation to phenological seasons
CHAPTER 4: DISCUSSION
4.1 Validation on faecal GCM measurements 4.2 HPLC analysis
4.3 Storage test effect
4.4 Faecal GC M levels in relation to reproductive stages 4.5 Faecal GCM levels in relation to phenological seasons 4.6 Faecal GCM levels in relation to rank
CONCLUSIONS APPENDIX I REFERENCES ACKNOWLEDGMENTS 38 38 41 43 46 54 60 60 61 62 62 64 65 67 68 70 83
1
ABSTRACT
This study investigates the relationship between Madagascar’s environment and the stress physiology of the red collared brown lemur, Eulemur collaris. Habitat disturbance in Madagascar is pervasive and lemurs possess many unique traits compared with other primates that are primarily attributed to environmental or nutritional stress. Glucocorticoids (GCs) like cortisol are stress indicators. The assessment of welfare in animals is a developing field of study, and stressors in natural habitat can be estimated by measuring GC metabolites (GCM) in faeces. The littoral forests of southeastern Madagascar are among the most endangered habitats in the world and Eulemur collaris is well adapted to survive in these forests. The red collared brown lemur is a mostly frugivorous and cathemeral lemur with an extraordinary ecological flexibility that allows it to tolerate a certain degree of habitat changes. The goal of this study was to assess whether the health state measured by GCM levels of animals which living in a degraded habitat is comparatively different than the state of con-specific individuals living in a more pristine area. For this we compared faecal GCM levels in wild adults Eulemur collaris in a degraded (Mandena) and an intact littoral forest (Sainte Luce) in South-eastern Madagascar over a one year period (February 2011- January 2012). We analysed how GCM levels varied among reproductive stages and phenological seasons, using forest degradation, rank and sex as covariates. In general, lemurs at Mandena were more stressed than lemurs at Sainte Luce. Lemurs showed higher GCM levels during the mating season, followed by gestation season, lactation season and the non-reproductive season. We found that females at Mandena were more stressed than females at Sainte Luce during the gestation season. In relation to phenological seasons, individuals at Mandena were significantly more stressed than individuals at Sainte Luce, and lemurs at Mandena were more stressed during the lean season than lemurs at Sainte Luce. This study found no rank-related
2 GCM levels. These results showed, as predicted, that lemurs in a degraded habitat are more stressed and this has important implications for future conservation plans. Eulemur collaris is the largest frugivorous primate present in the littoral forest and is an important seed disperser, its presence is of vital importance for the forest per se. Due to its role of seed disperser, protecting this lemur species also means helping regeneration of degraded habitats.
3
CHAPTER 1
INTRODUCTION
1.1 Defining Stress
“Stress” has become an increasingly popular and widely applied term in everyday language, probably owing to the involvement of scientists from different disciplines such as biomedicine, psychology, ethology, and animal welfare (Palme et al. 2005).
The definition of stress is difficult and contentious since the term is often used to indicate a whole range of symptoms and levels of suffering (Lane 2006).
Even among biologists, the word “stress” has many meanings, thus it is generally best to avoid the word stress using instead the more explicit terms “stressors” to refer to the condition provoking a response, and “stress response” to refer to changes in internal state induced by the external condition (Creel 2001). The term “chronic stress” is used to refer to long-term overstimulation of coping response (Romero 2004).
All living organisms maintain a complex dynamic equilibrium, or homeostasis, which is constantly challenged by internal or external adverse effects (Chrousos et al. 1996).
There are several potential stressor stimuli for free-ranging animals, they may be both natural, such as climatic factors, high predation pressure, decreased food accessibility, social aggression or competition, and anthropogenic, such as noise and habitat alteration (Cavigelli 1999; Pride 2005a; Ostner et al. 2008). Social instability due to immigration events or rank reversals may lead to a stress response (Beehner et al. 2005; Bergman et al. 2005). Immigration of adult individuals, in particular, may represent a source of stress, as the newcomer(s) may not only challenge rank positions (Alberts et al. 1992; Bergman et al. 2005)
4 but, in the most extreme case, may oust the resident individual(s) (Pope 1990; Ostner and Kappeler 2004; Ostner et al. 2008).
Selye (1936) defined stress as “the nonspecific response of the body to any demand made on it”, in this case there is a tendency to consider any difficult or energetically demanding situation as a stressor, but recent studies suggest that the ‘predictability’ or ‘controllability’ of a stimulus are the most important characteristics that determine the degree of challenge it poses. In other words, difficult conditions that are predictable and/or controllable, including, for example, seasonal decreases in food accessibility or visually prominent predators, often do not provoke a physiological stress response (Cavigelli 1999; Creel 2001). A classic example is the study by Weiss and colleagues (1968), who gave two rats similar electric shocks. One rat was given a lever to press, which terminated the shock for both rats. The rat that controlled the lever had a dramatically lower glucocorticoid response (one characteristic of the vertebrate stress response is the release of glucocorticoid steroid hormones, see paragraph 1.2) than did the second rat. Therefore, the degree of control over the stressor (i.e. the context) determines the degree level of the hormonal response (Romero 2004).
1.2 Physiological Stress
The discovery of metabolic, immunological and neuroendocrine mechanisms make it possible to describe the stress response in physiological terms (Balm 1999).
The stress response is mediated by the stress-system, which is located in both the central nervous system and peripheral organs. There are many hormones that have been identified as playing a role in the vertebrate stress response, two categories of hormones are thought to form the central components of the endocrine response. These are the catecholamines, epinephrine and norepinephrine (also known as adrenalin and noradrenalin) and
5 glucocorticoids (GCs, a class of steroid hormones). Together, these hormones help to orchestrate the body’s stress response (Romero and Butler 2007).
Catecholamine Responses
The adrenal medulla and nerve terminals of the sympathetic nervous system release epinephrine and norepinephrine when a stressor is detected, then they activate organism-level responses via their receptors in target tissues. These hormones, which have been produced beforehand, are already present inside secretory vesicles thus allowing for a very fast release upon detection of a stressor. Catecholamines are responsible for the activation of many responses including: shutting down digestion, decreasing visceral activity, increasing visual acuity, increasing brain blood flow and arousal, increasing gas exchange in the lungs, the breakdown of glycogen in order to release glucose, inducing vasodilation in muscles and vasoconstriction in the periphery, increasing heart rate and inducing piloerection. The responses mediated by epinephrine and norepinephrine are known as the “Fight-or-Flight” response because they immediately increase readiness and activity allowing the animal to survive an acute threat such as an attack by a predator or competitor (Romero and Butler 2007).
Glucocorticoid Responses
The steroid hormones are responsible for a slower endocrine response. The primary hormones released upon detection of a stressor are the glucocorticoids (GCs), cortisol and corticosterone. The specific glucocorticoid released is species-specific (Von Holst 1998; Broom and Johnson 1993). Most species rely primarily upon cortisol (e.g. most mammals
6 including primates and marine mammals and fishes), while birds, reptiles and amphibians use corticosterone. Some rodents rely upon cortisol, others upon a mixture of the steroids cortisol and corticosterone (Palme et al. 2005).
When released GCs travel in the peripheral circulation primarily bound to corticosteroid binding globulins (CGB). Steroids are highly lypophilic so that most GCs are bound to CBG, however, unbound GCs increase dramatically during a stress response. When they reach the target tissue GCs pass through the cell membrane and bind to the intracellular cytoplasmic receptor. Activated receptors then enter the nucleus and begin acting as transcription factors. Activated receptors bind to short stretches of DNA sequences known as glucocorticoid response elements and act as regulators of gene transcription, so the end result of GCs stimulation is either the production of new proteins or the inhibition of protein production. Some evidence shows that a membrane-bound receptor for GCs exists; this receptor is believed to regulate rapid behavioural effects of GCs. The HPA (hypothalamic-pituitary-adrenal) axis is a multistep process which ensures a time lag between the onset of a stressor and an increase in GCs blood level concentrations (Fig. 1.1).
Fig. 1.1: The hypothalamic–pituitary–adrenal (HPA) axis. An acute stressor is detected by the cortex of the brain, which sends a neuronal signal to the hypothalamus. The hypothalamus then sends a hormonal signal to the pituitary, resulting in the pituitary sending a hormonal signal (adrenocorticotropin, or ACTH) to the adrenal or interrenal (depending upon the species) gland to release GCs. GCs have multiple effects that are mediated by blood-borne carrying proteins (corticosteroid-binding globulins, CBG). A negative feedback loop shuts off the HPA pathway leading to GC release. If the stressor persists and GCs remain elevated, negative feedback ceases to function and the deleterious chronic effects of GCs begin (Romero 2004).
7 Generally increases in GCs concentrations take more than 3-5 min. (for some species even a longer time) to be detected. When coupled with GCs primary effect of altering gene transcription rates, the physiological impact of GCs starts approximately 20-30 min. after stressor onset. If a stressor is interrupted, negative feedback will generally begin to reduce GCs concentrations in 30-60 min., although GCs physiological effects can last considerably longer as the newly produced proteins can continue to function; therefore the catecholamines and the GCs dovetail produce both an immediate and longer-term response to stressors.
Although GCs alter gene transcription rates for a very large number of genes at the organismal level GCs can be classified as having five broad effects (Romero 2004; Romero and Butler 2007) (see Fig 1.1).
1. Increasing glycemia.
The classic effect of GCs is to increase the blood glucose available to tissues involved in responding to a stressor. In fact the name “glucocorticoids” was given to these hormones because of this important role which takes two general forms: first GCs increase blood glucose by converting protein to glycogen and by stimulating the catabolism of protein to form new glucose in a process called gluconeogenesis. Second GCs reduce the blood glucose uptake by target tissues causing higher blood concentrations of glucose available to tissues involved in responding to stress. GCs do this by stimulating the internalization of glucose transport molecules from the surface of the cell of target tissues. Fewer glucose transporters result in less utilization of glucose leading to higher blood glucose concentrations. Tissues which need extra glucose to respond to a stressor (e.g. muscles) compensate for the GCs effect and essentially have a preferential access to the increased pool of blood glucose. The result of these effects is that GCs manage the allocation of energy supplies during either prolonged stressors or after stressors have ended (Dallman et al. 1993).
8 2. Altering behaviour.
In different environmental contexts, GCs can promote a behavioural strategy of “hiding and waiting out a stressor” or promote a behavioural strategy of “abandoning an area and fleeing the stressor” (Wingfield and Ramenofksy 1997). The mechanism behind how GCs alter behaviour are currently unknown, they may involve membrane-bound G-protein receptor that induce rapid behavioural effects.
3. Inhibiting growth.
GCs inhibit growth by blocking the secretion of growth hormone from the pituitary, decreasing the sensitivity of target cells to growth hormone and inhibiting protein synthesis (Sapolsky 1992a).
4. Inhibiting reproduction.
GCs also inhibit reproduction (Wingfield and Romero 2001). Vertebrate reproduction is regulated by a hormonal cascade that is similar to the HPA axis. Interestingly, the reproductive system can become resistant to inhibition by GCs in some reproductive contexts. For example, if GCs allocate resources away from reproduction and then reduce individual fitness (i.e. successful production of offspring), the benefit of the reproductive system ignoring the GCs signal may outweigh the cost of not responding to the stressor. In semelparous species (those species that breed once and then die) such as some salmon species and several Australian marsupial rodents, death occurs in all individuals (or all individuals of one sex) shortly after breeding. The proximate cause of death is extremely high levels of GCs that catabolise essential proteins (Wingfield and Romero 2001). Reproduction of these animals continues despite elevated GCs levels. GCs do not inhibit reproduction in many short-lived species and in older individuals and in dominant individuals in some species,
9 where the dominant individual has a limited period of access to mates (Wingfield and Sapolsky 2003). Consequently, susceptibility to GCS-induced inhibition of reproduction is highly specific depending on the importance of the continuation of reproduction in the presence of stress.
5. Modulating the immune system.
GCs have various effects on the immune system including the inhibition of synthesis, release and efficacy of cytokines (immune system proteins): inhibiting antigen presentation through reduced major histocompatibility complex (MHC) expression, reducing the activation and proliferation of T cells, B cells and macrophages, reducing lymphocyte chemotaxis, lowering the circulating levels of lymphocytes , reducing the number of phagocytic cells at inflammation sites, stimulating atrophy of the thymus and triggering the death of immature T and B cells. These different effects lead to immunosuppression especially with long-term GCs exposure. Some evidence shows that GCs may well enhance immune function in the short-term (Dhabhar and Mc Ewen 1999; Dhabhar 2006) Why GCs have such great immunosuppressive effects is not entirely clear but it has been suggested it may be a mechanism to prevent over-activation of the immune system which could very well lead to autoimmune diseases (Palme et al. 2005).
Metabolism and excretion of glucocorticoids
Several studies investigated metabolism and excretion of GCs. Lindner (1972) investigated the excretion of infused 14C-cortisol in sheep. He stated that two-thirds of the radioactivity was subsequently found in the bile. The main metabolites were glucuronides of tetrahydrocortisol, tetrahydrocortisone and cortolones. Also C19O3 steroids (androstanes) were
10 metabolites were eliminated via the faeces. Palme et al. (1996) infused radioactive cortisol intravenously into sheep, ponies and pigs. They found high interspecies differences regarding the amount of radioactivity excreted via urine and faeces and the time course of the excretion. In faeces the maximum concentration were measured about 12 h (sheep), 24 h (ponies) or 48 h (pigs) later, this reflects the intestinal passage time in these species.
There are also considerable species differences in the metabolites formed (Palme and Möstl 2000). Möstl et al. (2002) showed that in ruminants at least 21 cortisol metabolites can be detected in faecal samples using high performance liquid chromatography (HPLC)/mass spectroscopy.
Möstl et al. (1999) compared chromatograms of fecal cortisol metabolites after infusion of
14
C-cortisol into ponies and pigs. In ponies, one dominating metabolite was present, whereas in pigs a total of five more prominent radioactive peaks were measured after HPLC. Using HPLC and enzyme immunoassays (EIA), Palme and Möstl (1997) showed that almost no authentic cortisol was excreted in sheep, even after intravenous infusion of 1 g of cortisol. A similar situation was described in ponies and pigs (Möstl et al. 1999). In some other species, cortisol metabolites also occur in cats, primates and hares (Schatz and Palme 2001; Bahr et al. 2000; Teskey-Gerstl et al. 2000). In particular, Bahr and colleagues (2000) have found that low cortisol amount were detected in faeces in the marmoset and it was virtually absent in macaques and chimpanzees.
1.3 Chronic stress effects
The actions of glucocorticoids may become maladaptive when individuals are subjected to chronic (weeks to months) stressors (Selye 1956; Coe and Scheffler 1989; Sapolsky 1994). In this case, many of the short-term benefits become long-term pathologies, including immune
11 suppression and atrophy of tissue, reproductive suppression, gastric ulcers and muscle wasting (Cameron 1997; Heistermann et al. 2004). Rises in GC cortisol during reproductive periods may co-occur with increased fertility (Bercovitch and Ziegler 2002), cortisol secretion associated with reproduction may increase to higher levels in response to induced stress (Saltzman et al. 1994), and cortisol has been found to inhibit female primates’ ability to reproduce (Wasser and Starling 1988; Sapolsky 1992a; Cameron 1997; Bronson 1999). Physiological modifications in response to stress during reproductive stages can be particularly detrimental to reproductive success in slowly reproducing species as primates (Tecot 2013). Because high glucocorticoid levels suggest the presence of environmental threats, and chronically high glucocorticoid levels are themselves associated with health risks (Dhabhar and McEwen 2000), it is believed that high glucocorticoid levels indicate lower individual fitness or population viability (Pride 2005a).
1.4 Measuring Stress
Because of the potentially deleterious effects of chronic stress, there is great interest among different fields of study in measuring animal stress (Millspaugh and Washburn 2004).
There are obvious benefits to conducting studies in the wild. By gathering data from naturally assembled groups in their normal context, one can eliminate concerns about the effects of crowding, constant interaction, imposed group compositions and limited dispersal options. Some of the strength of field endocrinology can be lost by invasive sampling (Creel 2001). The concentration of cortisol in the blood is widely used as an indicator of stress. Blood samples can be difficult to collect from free-ranging animals and one has to consider that sample collection, which often involves capture and handling, may by itself be stressful and can lead to rapid and significant increases in circulating GC levels, which may compromise
12 the results (Sapolsky 1982; Astheimer et al. 1994; Wingfield et al. 1994; Cavigelli 1999; Creel 2001; Möstl and Palme 2002).
Stressors in the natural habitat can be estimated by measuring cortisol levels in faeces (Risler et al. 1987; Whitten et al. 1998; Ziegler and Wittwer 2005). Faecal samples can be collected easily and without disturbing the animal, thereby allowing frequent sampling, even over a long time period (Palme et al. 2005), thus they can be used as a powerful non-invasive measure of stress levels in free-ranging animals (Cavigelli 1999; Creel 2001; Pride 2005a; Goymann 2012).
Are faecal GC levels reliable?
Particular sources of error and variability have been linked with the measurement of faecal GC metabolites. The most common method to determine steroid hormone levels is via immunoassay. With this method, the hormone (antigen) in the sample is bound to a specific antibody against this antigen and detected through enzymatic (enzyme-immunoassay) or radioactive labelling (radio-immunoassay). The concentration of the hormone is then determined using a calibrated standard curve of the same hormone (Chard 1995). Potential cross-reactions of the specific antibody with structurally similar antigens are negligible in blood plasma, because the cross-reacting substances (for example structurally similar metabolites of steroid hormone) occur only in low concentrations compared with the active hormone. In contrast, in faeces the metabolites of steroid hormones occur at much higher concentrations than the original and biologically active steroid (Palme et al. 2005); thus if the antibody cross-reacts with metabolites of structurally similar but functionally different hormones, this can have major and distorting impacts on the results of the study (Goymann 2012). It is essential, therefore, that before embarking on any research involving the
13 measurement of faecal GCs the most appropriate antibody and assay is carefully selected and validation tested to demonstrate the assay system’s capability to detect relevant metabolites only (Wasser et al. 2000; Möstl et al. 2005; Palme 2005; Touma and Palme 2005). Thus, immunoassays utilizing antibodies specific to blood glucocorticoids may have relatively little affinity to the faecal GC metabolites and thus may have limited suitability for quantifying faecal glucocorticoid metabolites excretion (Bahr et al. 2000; Wasser et al. 2000; Möstl et al. 2002; Touma and Palme 2005).
A number of studies have reported that females and males metabolize the same hormone differently and excrete different metabolites of this hormone; thus sex differences in the hormone metabolism suggest that biological and physiological validations of hormone metabolite measurements may need to be performed for each sex separately (Goymann 2012). Faecal GC metabolite (GCM) measurements have been validated with the ACTH challenge test in most primate species (e.g. Heistermann et al. 2006; Fichtel et al. 2007) which consist in a physiological stimulation of the HPA axis for example by administering ACTH and/or anaesthesia, but this kind of test is not always practicable due to ethic reasons, in fact this test is very stressful for the animals. Several studies used “stressful situations” (such as transportation/ translocations and change in housing conditions) known to elicit increased GCs output to test the biological validity of faecal GCM measurements (Heistermann et al. 2006).
Dietary differences may affect the pooling time of steroids and increase metabolite variability (von der Ohe and Servheen 2002). A day to day change in dietary fibre may have a significant effect on gastrointestinal time but, as faecal measurements of GC metabolites tend to be part of long-term studies, a change in time lag of a few hours is unlikely to impact on the accuracy of the final data (Lane 2006). If the faeces are not treated with preservatives or kept in cold storage, naturally occurring bacteria and bacterial enzyme in faeces decompose steroid
14 metabolites within hours after defecation (Wasser et al. 1988; Möstl et al. 1999; Khan et al. 2002). Ethanol either alone or with sodium azide has been used as a preservative for short-term ambient temperature storage of faecal samples (Wasser et al. 1997; Ziegler et al. 2000) or long term storage for 5 months (Cavigelli 1999) to 3.5 years (Curtis et al. 2000). When faecal measurement of GC metabolites is carried out by a suitable and validated technique it can be an incredibly useful method with very few limiting factors. Faecal sampling is relatively simple and can usually be conducted without disturbing the subject and without interfering with other welfare measures running in parallel, for example behavioural assessment (Lane 2006).
1.5 Lemurs and Stress
GCs may fluctuate both seasonally and daily (Rose et al. 1978; Stavisky et a. 2001; Lane 2006). Seasonal fluctuations may be associated with transitory factors such as reproductive cycle and weight (Reeder and Kramer 2005) or level of mate competition (Lynch et al. 2002). Breeding season in males is accompanied by cortisol level increase, where male competition for female can be both high or low (Lynch et al. 2002). In lemur females basal cortisol levels increase in mid-gestation (Ziegler et al. 2004).
GCs levels and their fluctuations have been associated with seasonal changes in weather, resource distribution and availability, and habitat quality (Huber et al. 2003; Pride 2005a; Chapman et al. 2006). Lemurs possess many unique traits compared with other primates, such as “cathemerality” (activity pattern throughout a 24 hour cycle; Tattersall 1987), synchronized breeding with very short oestrus periods and breeding season (Lancaster and Lee 1965), low basal metabolic rate (Snodgrass 2007) and lack of sexual dimorphism (Wright 1999). These traits are primarily attributed to environmental or nutritional stress. The energy
15 frugality hypothesis (Wright 1999) proposed that unique lemur traits are a way to conserve energy and maximize food resources. Two environmental factors that make Madagascar distinct from other regions are climate and habitat fragmentation.
1.6 Coping with harsh environments: Madagascar
Madagascar is considered an important global conservation priority because of the high endemicity of its flora and fauna (Mittermeier et al. 1998) and the severe threats to the island’s environment. Of Madagascar’s original habitat, 90% has been lost largely due to anthropogenic disturbance (Mittermeier et al. 2006), which decreases resource abundance, diversity and seasonal predictability (Tecot 2008). In 1985, 3.8 million hectares of rain forests remained, representing only 50% of the 7.6 million hectares existing in 1950, and 34% of the estimated original extent (11.2 million hectares). Between 1950 and 1985, the rate of deforestation averaged 111 000 hectares per year (Green and Sussman 1990) (Fig 1.2).
Fig 1.2: Maps of distribution of rain forest in eastern Madagascar through time (Green and Sussman 1990).
16 Madagascar is suggested to differ from other primate habitats (Wright 1999; Wright et al. 2005) because of extremely unpredictable rainfall patterns which result in unpredictable fruiting patterns, thus frugivorous lemurs seem to be particularly vulnerable (Dewar and Richard 2007). On the other hand, some flexibility has been observed and a number of mainly frugivorous lemurs may switch to lower quality foods during lean periods (Sussman 1974; Gould et al. 1999; Ratsimbasafy et al. 2002), modify their activity and ranging patterns (Pereira et al 1999; Donati et al. 2007; Donati et al. 2009), or use food patches of different size and split into subgroups (Ganzhorn 1988; Balko 1998; Irwin 2007). Thus, adaptation to fluctuating ecological conditions may have been potentially selected for the ability of lemurs to cope with degraded habitats (Donati et al. 2011).
The littoral forests of south-eastern Madagascar
Prior to human occupation, humid and sub-humid littoral forest covered approximately 461 000 ha (0.8 % of the total land surface of Madagascar), of which only about 47 900 ha remain today, for a habitat loss of 89.7 % (Consiglio et al. 2006). Thus, from the original littoral forest, only 10.3 % remains in the form of little forest fragments, and only 1.5 % of these are included within the existing protected areas network (Vincelette et al. 2007). In particular, the littoral forest on sandy soil of south-eastern Madagascar is one of the most threatened ecosystems on this island. By 2005, the Tolagnaro region (Fig 1.3) littoral forests were heavily fragmented and covered only 3128 ha, distributed in 289 blocks varying in size from 0.06 ha to 252.4 ha (Vincelette et al. 2007).
Fig. 1.3: Anosy region in (red) and Fort Dauphin (Tolagnaro)
17 The littoral forest ecosystem is restricted to unconsolidated sand in a narrow coastal band, extending along Madagascar’s east coast from north of Vohimarina to just southwest of Tolagnaro (Consiglio et al. 2006). This forest has a seasonal rainfall and strongly seasonal patterns in flushing, flowering, and ripe fruiting. Intra-annual differences occur in phenophases leading to periods of abundance and scarcity (Bollen and Donati 2005). In the Fort Dauphin (Tolagnaro) area the remaining littoral forests on sandy soil form three groups of fragments: Petriky, Mandena and Sainte Luce.
QIT Madagascar Minerals (QMM) is a company jointly owned by Rio Tinto (80%) and the Malagasy state (20%). QMM is an ilmenite mining project (ilmenite contains titanium dioxide, used principally as a raw material in the manufacture of white pigment). Since 1985 the company began an extensive exploration program along the eastern coast of Madagascar to locate deposits of heavy mineral sands containing titanium dioxide. Major mineral sediments were found in Mandena, Petriky and Sainte Luce (the largest remaining stands of littoral forest). A series of studies commissioned by QMM demonstrated the importance of the region’s biodiversity that require appropriate conservation plans (e.g Ganzhorn et al. 2007). Since the duration of the project is expected to be around 40-50 years, the goal of QMM is to minimize the mine’s negative impact on biodiversity and create a model project for investment compatible with biodiversity conservation. Avoiding impacts is the priority of QMM Biodiversity Action Plan, thus were designated avoidance areas (where no mining will take place) called “Conservation Zones”, and QMM established three zones (Fig. 1.4):
1. The Mandena Conservation Zone (230 ha), established in 2000;
2. The Sainte Luce Conservation Zone (274 ha), established in 2005, set up with local communities called “dinas”;
18 Fig. 1.4: Maps of the Sainte Luce, Mandena and Petriky areas in South-eastern Madagascar, indicating the location of major littoral forest parcel (light green) including those that comprise the established conservation zones at the three sites (dashes red and yellow lines), (Lowry et al. 2008).
1.7 The red collared brown lemur, Eulemur collaris.
The red collared brown lemur, Eulemur collaris GEOFFROY 1817, is a strepsirrhine primate, belonging to the family Lemuridae. It was previously classed as one of the six subspecies of
Eulemur fulvus. Subsequently, Groves (2001) elevated all former E. fulvus subspecies (albifrons, albocollaris, collaris, fulvus, rufus and sanfordi) to full species. Eulemur collaris
was listed as “Vulnerable” on the “ Red List of Threatened Species” (IUCN 2008) but leading conservationists have gathered at a summit meeting organised by the International Union for Conservation of Nature (IUCN) on July 2012 in Madagascar. This commission reviewed the conservation status of the world’s 103 lemur species and elevated Eulemur collaris from “Vulnerable” to the “Endangered” category (Donati, pers.comm.).
19 The results of the conference highlighted that many lemur species are on the very brink of extinction and in need of urgent and effective protection measures.
Eulemur collaris is a medium-sized lemur, mean body mass is 2.15±0.25 kg and mean body
length is 46.1±2.6 cm (n=11) (Donati et al. 2011). This species is sexually dichromatic. In males the dorsal coat is brownish-gray, the tail is darker, and there is also a dark stripe along the spine. The ventral coat is a paler gray. The muzzle, face and crown are dark gray to black. The creamy to rufous-brown cheeks and beard are thick and bushy, while the creamy to gray-colored eyebrow patches vary in their prominence. In females, the dorsal coat is browner or more rufous than that of the male. The ventral coat is a pale creamy-gray. The face and head are gray. The cheeks are rufous-brown, but less prominent than in males (Fig 1.5). Both sexes have orange-red eyes” (Mittermeier et al. 2010).
The red-collared brown lemur is similar in coloration to Eulemur cinereiceps (valid name of
E. albocollaris, Johnson et al. 2008). Male E. collaris can be distinguished from male E. cinereiceps by their beards, those of the former being cream-colored or rufous while those of
the latter are white. Female E. collaris are virtually indistinguishable from female E.
cinereiceps. Recent genetic analyses support full species status for both taxa (Djletati et al.
1997; Wyner et al. 1999).
Fig 1.5: Octavio (adult male) and Barabarà (collared adult female) of Group AB at Mandena. Photos by Michela Balestri.
20 The red-collared brown lemur, and brown lemurs in general, have been characterized as highly flexible in their ecology, in accordance with their broad geographic distribution which spans many distinct habitat types and elevation zones (Tattersall and Sussman 1998; Goodman and Ganzhorn 2004).
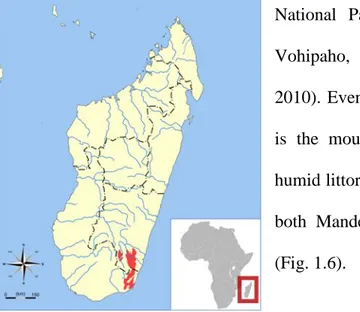
These lemurs are found in tropical moist lowland and mountain forests in south-eastern Madagascar, from Tolagnaro (Fort Dauphin) north to the Mananara River (Fig. 1.6). The western limits of this range are the forests of the Kalambatritra region, including the Kalambatritra Special Reserve. The Mananara River serves as a boundary between the ranges of E. collaris and E. cinereiceps, except for an isolated population at Midongy du Sud National Park (Irwin et al. 2005) and another at Vohipaho, near Vangaindrano (Mittermeier et al. 2010). Even if the typical habitat of Eulemur collaris is the mountain rain forest, it can also inhabit the humid littoral forests. In fact, we can find this lemur in both Mandena and Sainte Luce Conservation Zones (Fig. 1.6).
Fig 1.6: distribution of Eulemur collaris (in red).
Red-collared lemurs live in multi-male, multi-female groups;. Median group size in intact littoral forest is 7 (range. 2-17; n=13) and in intact rain forest is 5 (range 2-7; n=11) (Donati et al. 2011).
Eulemur collaris is a mainly frugivorous species, even if it can feed on leaves or less nutritios
food when fruits are not available (Donati et al. 2011). Malagasy rainforests represent a challenging environment for arboreal frugivorous primates as compared to other tropical
21 forests (Ganzhorn et al. 1999; Wright 1999; Ganzhorn 2002; Bollen and Donati 2005; Wright et al. 2005). The unpredictable phenology and seasonal lean periods make these forests a hard challenge also for this species, despite its social and ecological flexibility (Donati et al. 2011). Red-collared lemurs are cathemeral (Tattersall 1987), this activity pattern provides temporal flexibility in foraging, optimizing the exploitation of food resources during times of greatest abundance and quality, and low predation risk (Rasmussen 1999). Cathemeral activity seems to be higher during the dry season, while a mostly diurnal activity was observed in the wet season (Donati and Borgognini-Tarli 2006).
1.8 Aim of the study
The main sources of ecological stressors proposed for primates are food availability and habitat quality. Other challenging stimuli may be due to reproductive stages, such as gestation for females and mating season for males, and dominance status for both sexes.
Male sifakas of both rank classes (dominant and subordinate) have higher GCM levels during the reproductive season as compared to the birth season (Fichtel et al. 2007). GCM levels during the mating season are related to generally increased rates of aggression during this time of the year when male-male reproductive competition is most pronounced. Additionally, there was a clear rank effect in GC output in the mating season, with dominant males exhibiting higher faecal GCM levels (Fichtel et al. 2007). Similar findings have been reported for male mouse lemurs (Schilling et al. 1984). Higher GC levels in dominants have been linked with high reproductive skew in several species (Creel 2001). In Eulemur fulvus rufus males of both rank classes had similar levels of both testosterone and GC levels, and they were excreted at high levels during the mating season as well as during the short annual birth season, maybe due to the predictable risk of infanticide in this highly seasonal species. No
22 clear rank related GC output was found for red-fronted lemurs (Ostner et al. 2008). In female ring-tailed lemurs (Lemur catta) faecal cortisol levels were relatively high during late gestation and at the end of the dry season, when intensite antipredatory behaviour and estimates of feeding effort were high. In addition, faecal cortisol measures were significantly correlated with dominance index: dominant females had higher cortisol values compared to subordinate females (Cavigelli 1999). Similar finding have been reported also for female dwarf mongooses (Helogale parvula; Creel 1992).
In Eulemur rubriventer the lowest GC levels occurred between weaning and mating, in this species male competition is low. According to the above authors low prebreeding levels may also be related to high food abundance. This is in contrast with what has been observed in male sifakas, which do not participate in infant care. The highest GC levels were excreted at the convergence of parturition and fruit scarcity. The paper by Tecot (2013) was the first study to compare lemur faecal GC between an intact and a degraded habitat, and contrary to expectations, GC levels were higher in the intact site. This study has suggested that populations with a higher mean value of GC levels may not be more stressed, the attenuation found in the degraded site may reduce the chances of additional pathological stress due to chronic stress and increase chances of survival in difficult environments. Infant mortality was higher in the degraded habitat, thus prolonged attenuation may indicate insufficient coping (Tecot 2013).
A comparative study between group size and phenological season in Lemur catta underlined that food scarcity had a direct role in raising cortisol levels during the weaning/breeding seasons where animals face the combined effects of high energy demand and low food supply (Pride 2005b). Faecal GC levels can be useful predictors of individual survival probabilities in wild populations as a population exhibiting high GC levels can be expected to have high mortality rates (Pride 2005a).
23 The aim of this study is to investigate whether lemurs were ecologically stressed and when they were stressed. This study examined how physiological responses of red collared lemurs varied with reproductive stages, habitat quality, food availability and social status. Physiological responses were investigated by analysing GCM excretion profiles, and these responses were compared among lemur groups in a degraded (Mandena) and in a more intact littoral forest (Sainte Luce) in South-eastern Madagascar. These two sites were ideal for this study because they are subjected to similar climates (average monthly temperature 23°C (range: 18.2-25.9; n= 30) and annual rainfall ranging 1600-2480 mm; Donati et al. 2011) facilitating inter-site comparison without the confounding influence of climate differences. As stated above, this species has social and ecological flexibility. This study may help to identify the extent of their flexibility, if they can compensate adverse environments only by changing their behaviour (activity pattern and diet) or by some physiological response.
Hypotheses and predictions We predict that:
1) Reproductive stages.
Male will be more stressed as compared to females during the mating season because this period is short in this species. Gestation season, which is coincident with the lean period, could be very challenging for females. Thus, we predict higher GCM levels in females compared to males during gestation.
2) Food availability.
Lean season poses a significant challenge and lemurs require both behavioural and physiological modifications to face this period. Thus, we predict higher GCM levels during
24 the lean season for both sexes and sites. Additionally, we predict that the lean period represents a more difficult challenge for lemurs living in the more degraded forest of Mandena, where we expect to find higher GCM levels.
3) Habitat quality.
Anthropogenic disturbance creates unpredictable environments. Habitat loss and fragmentation can alter both quantity and quality of food resources available to primates. Logging affects density, size and distribution of plant species in forest fragments (Donati et al. 2011). Populations with higher corticoid levels are assumed to be exposed to greater stress, suggesting that more degraded habitats should induce higher cortisol levels (Tecot 2013). Thus, we predict significantly higher GCM levels in the degraded forest fragment of Mandena for both sexes.
Since GCM levels can reflect animal welfare, we can observe if this species can cope with habitat degradation. Frugivorous primates are important seed disperser and therefore fundamental to catalayze the regeneration of degraded habitats (Donati et al. 2011). Eulemur
collaris is the largest frugivorous primate present in the two sites, thus improving this
species’ welfare means also helping habitat regeneration.
4) Rank.
Despite the numerous studies on the relationship between stress physiology and social status in vertebrates, no clear pattern has yet emerged (Creel 2001). Two publications, one on mammals and birds in general (Goymann and Wingfield 2004) and one on primates in particular (Abbott et al. 2003) focused on the intensity of stress in either dominance position, i.e., the cost of acquiring and maintaining a high rank, and the intensity of aggression a subordinate is exposed to. Since Eulemur collaris is known to show high social flexibility and
25 no strict dominance (Pereira and Kappeler, 1997), we assigned similar costs for both rank classes and consequently we predicted no rank related differences in GCM output.
26
CHAPTER 2
MATERIALS AND METHODS
2.1. Sites
This comparative study was conducted in the littoral forest fragments of Mandena (MAN) and Sainte Luce (STL) near Fort Dauphin in south-eastern Madagascar (Fig 2.1).
Fig. 2.1: Study site and forest conservation status. Map of littoral forest fragments remaining in 2000 at Sainte Luce and Mandena. Study sites at Mandena (M15 and M16) are more degraded than the study site at Sainte Luce (S9), that is well preserved.
27 The Conservation Zone of Mandena (24°57' S, 47°0' E), 11 km North-West of Fort Dauphin, is located on sandy soils at an altitude 0–20 m above sea level. Our study was conducted in M15 and M16 fragments (about 148 ha of “fairly degraded” littoral forest), included in the Conservation Zone. The two fragments are surrounded by a swamp (approximately 82 ha), that collared lemurs use for daily activities such as travelling, resting and feeding, but also for drinking during the hottest periods. Thus, we considered the two fragments (M15 and M16) and the swamp as a single area of about 240 ha, included in the Conservation Zone. The average canopy height in M15 and M16 is 8.9 ± 4.4 m (Rabenantoandro et al. 2007). In addition, some groups of Eulemur collaris use to live in another smaller fragment not included in the Conservation Zone: M20, that is approximately 6 ha of “heavily degraded” forest, and is located North-East of the other two fragments (see Ganzhorn et al. 2007 for fragments areas). Red-collared lemurs use especially the swamp that links M20 with the other fragments. This swamp (about 40 ha) is out of the Conservation Zone and local people use it to pick up fruits, gather dead woods and cut trees. In addition to Eulemur collaris, four nocturnal lemurs (Microcebus murinus, Cheirogaleus medius, Cheirogaleus major, Avahi
meridionalis), and one cathemeral lemur species (Hapalemur meridionalis) are found in this
area.
The second study site, the littoral forest of Sainte Luce (24°46’S, 47°10’E), around 30 km North of Fort Dauphin, is among the most intact littoral ecosystems in Madagascar and possesses a very high vegetation diversity (Bollen and Donati 2006). Our study fragment was S9, about 252 ha of “well preserved” littoral forest and swamp, 190 of which are included in the Conservation Zone. Eulemur collaris still occur in S17, an “almost intact” fragment of 237 ha, all included in the Conservation Zone. We studied only groups in S9 because in S17 there are no tracks and there is not a biological station as in S9. The average canopy height in S9 is 14.7 ± 4.3 m (Rabenantoandro et al. 2007). In addition to Eulemur collaris, four
28 nocturnal lemurs (Microcebus murinus, Cheirogaleus medius, Cheirogaleus major, Avahi
meridionalis), are present in S9. Hapalemur meridionalis is not present in Sainte Luce
because the swamp, that is vital for this critical species, is smaller than in Mandena.
Floristically Mandena and Sainte Luce littoral forests are very similar, suggesting that these two areas were once connected. However, structural differences indicate that at the time of study, the forest of Mandena represents a degraded form of the vegetation type in Sainte Luce. This deduction is also suggested by the disappearance of some tree families known to be logged in Mandena but not in Sainte Luce (Rabenantoandro et al. 2007).
2.2 Subjects
Individuals of red-collared brown lemurs presently living in the Mandena forest fragments have been translocated in M15 and M16 between 2000 and 2001 (Donati et al. 2007a) from other littoral forest fragments (M3 and M4), threatened by charcoal makers (Fig. 2.2). M15 and M16 in the meantime became an effectively protected area.
Fig. 2.2: Forest fragments in Mandena and Sainte Luce and extent of littoral forest reduction between 1998 and 2005 (Donati et al., 2007b).
29 At the moment of translocation the animals were 28, resulting in a density of 12 individuals per Km2 (Donati et al. 2007b). During our study period the population of red collared brown lemurs at Mandena was about 12-17 animals, resulting in a density of 4.8-6.8 individuals per km2. The cause of this reduction of population density is still unknown. It may be due to predation, scarcity of food resources, hunting for food by local people or to animal migration towards other forest fragments out of the Conservation Zone.
In this study we analysed hormonal data collected from adults (n=19) in four groups: two groups at Mandena (group AB and group C), and two groups at Sainte Luce (group A and group B). To ensure continuos observations of the groups, four animals (one for each group) were captured in order to install radio-tracking collars, to be monitored by the use of a SIKA receiver (Biotrack). The adult individuals were captured by caging them, using banana slices as a bait, and rapidly anesthetized with Zoletil 100 (5 mg/kg of tiletamine hydrochloride) to prevent trauma. Morphometric measurements were taken and then thermo-sensitive collars TW-3 (medium mammal tag) were fixed. All animals recovered from anaesthesia within 1.5 hours and were not moved from the capture area nor kept in a cage, but were followed until regaining full mobility. There were no injuries as a consequence of the captures. Individuals were identified by observing radio-collars and some characteristics of the animals such as age, sex, size, canine length, tail shape, fur colour, and distinctive traits.
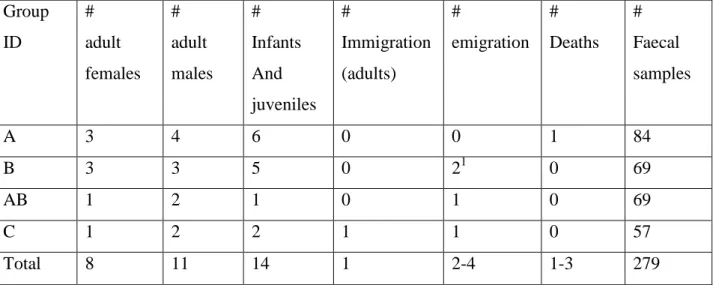
Group composition changed over time (Table 2.1): unfortunately, on February 2011 a female infant of group A died. In group B one adult male and one adult female (Fotsy and Rano) left the group in September, we did not know if they died (maybe for hunting or predation), or if they left the group probably due to overcrowding. Also in group C one sub-adult female (Tina) left the group in September. Tina was collared and we found her with a male, so in this case we were sure that she was alive. Probably, it is not by chance that she left the group a short time before the birth season and after the mating season. One adult male (Eddy) chased
30 away from group AB on June (after a battle with the dominant male of the group, Abelardo), joined group C in September after a period spent alone. Infants were born between the end of September at Mandena (Barabarà, the female of the group AB, gave birth to the first infant, Dodò, on September 22d, while another infant in Group C, Olivia, was born on October 4th). At Sainte Luce infants were born at the beginning of October (since we were not present we can only argue that all infants were born between September 31st and October 10th). Every adult female in our groups gave birth to at least one infant, and two females in group A gave birth to two twins (Volana one male and one female, Ala two females).
Group ID # adult females # adult males # Infants And juveniles # Immigration (adults) # emigration # Deaths # Faecal samples A 3 4 6 0 0 1 84 B 3 3 5 0 21 0 69 AB 1 2 1 0 1 0 69 C 1 2 2 1 1 0 57 Total 8 11 14 1 2-4 1-3 279 1 Emigrated or died
Table 2.1: Group Composition. Demography for groups in Sainte Luce (Group A and B) and Mandena (Group AB and C) throughout the study period (February 2011-January 2012).
2.3 Behavioral observations
The study period was from February 2011 to January 2012. From February 2011 to July 2011 data were collected by Marta Barresi and Valentina Serra. I collected data with Marco Campera, and on July 2011 data was collected by the two team pairs to evaluate inter-observer differences.
31 Habituated groups from each site were followed four days per month and one group per site was followed one night per month. Overall, 962 diurnal observation hours at Mandena were compared with 1118 hours at Sainte Luce, while the amount of nocturnal observations was 260 hours, 134 h at Mandena and 126 h at Ste Luce. Group C observations started from June 2011 due to the impossibility to follow this group into the swamp during wet periods, because of the high water level of the marsh. The groups were followed from 6:00 to 18:00 during each observation day and from 18:00 to 6:00 during each observation night. We recorded behavioural data concerning animal activity: resting, moving, feeding, social interactions and anti-predator strategies. Social interactions were separated in three categories: associative, affiliative, and agonistic behaviours. On the bases of social interactions the dominance relationships among animals were evaluated. The result of this analysis were used to calculate animal ranks (see table 2.3, paragraph 2.9).
During nocturnal observations we followed the general activity of the group using a very basic ethogram, with the only voices of resting, moving and feeding. We also recorded resting/huddling postures. Feeding and resting trees were identified and the diameter at breast height (DBH) was measured. Every half hour the position of the animals was recorded by GPS (Garmin eTrex Legend HCx ). Data on feeding ecology, time budgets, thermoregulation, sociality and home ranges were analysed by Marco Campera and Valentina Serra in their MS dissertations.
2.4 Faecal samples collection
We collected faecal samples from each site over the whole study period. A total of 537 faecal samples were collected in parallel with behavioural observations (Fig. 2.3). Due to the mainly frugivouros diet of Eulemur collaris most of the faecal samples contained seeds. For the first
32 set of faecal samples (from February 2011 to July 2011), we did not take to account the fact that the faecal weights were compromised by the presence of different amounts of seeds.
Fig. 2.3 : Faecal samples collected at both sites.
The hormone concentrations are related to the dry faecal weight. If the latter is influenced by variable amounts (and thus weights) of seeds, this will affect the faecal hormone concentration per faecal weight in an uncontrollable manner and, if seed weight is high, also to a great extent. Principally, the margin of error depends on the relative proportion that seed weight has on the total faecal weight and this may obscure real hormone levels and may lead to wrong interpretations of the hormonal data. For this reason we decided not to consider the first set of sample, even if we had the possibility to analyse 30 samples of the first set (we removed seeds by tweezers when faeces were completely dry and then we determined the real faeces weight; we did the same process with all the samples of the second set, from August 2011 to January 2012 ).
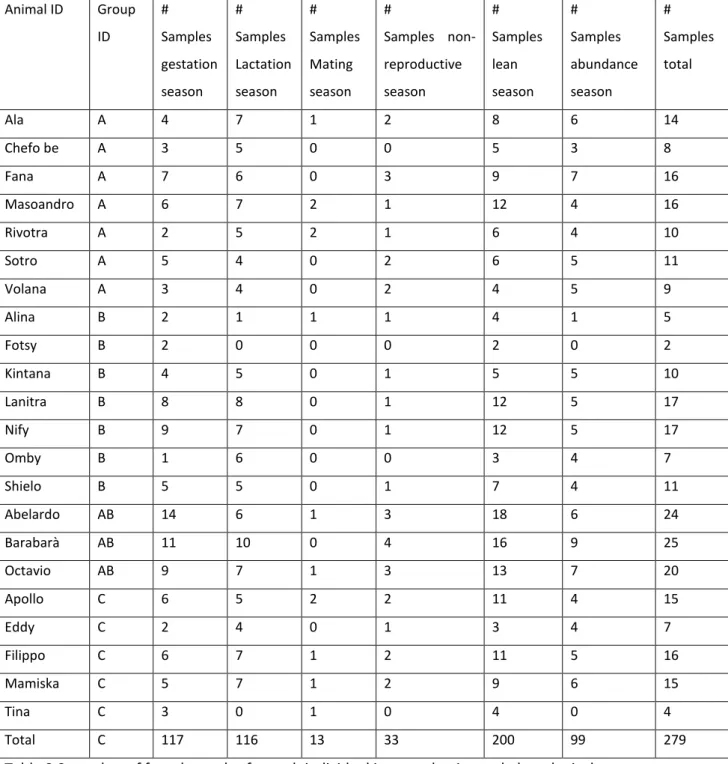
A total of 279 faecal samples (Table 2.2; from 2 to 25 per animal; Rano, a female of group B, was excluded as we did not have her faecal samples), were used for the statistical analysis as
33 we had the real faeces weight. The faecal samples were collected immediately after defecation: site, group, date, time, and identify of the donor were recorded. Faecal samples were preserved in 10 ml tubes with 96% ethanol, until hormonal analysis. Ethanol was added at the end of diurnal observations. Faecal samples were stored at room temperature for one year until processing, we therefore performed the storage effect test (see paragraph 2.8).
Animal ID Group ID # Samples gestation season # Samples Lactation season # Samples Mating season # Samples non-reproductive season # Samples lean season # Samples abundance season # Samples total Ala A 4 7 1 2 8 6 14 Chefo be A 3 5 0 0 5 3 8 Fana A 7 6 0 3 9 7 16 Masoandro A 6 7 2 1 12 4 16 Rivotra A 2 5 2 1 6 4 10 Sotro A 5 4 0 2 6 5 11 Volana A 3 4 0 2 4 5 9 Alina B 2 1 1 1 4 1 5 Fotsy B 2 0 0 0 2 0 2 Kintana B 4 5 0 1 5 5 10 Lanitra B 8 8 0 1 12 5 17 Nify B 9 7 0 1 12 5 17 Omby B 1 6 0 0 3 4 7 Shielo B 5 5 0 1 7 4 11 Abelardo AB 14 6 1 3 18 6 24 Barabarà AB 11 10 0 4 16 9 25 Octavio AB 9 7 1 3 13 7 20 Apollo C 6 5 2 2 11 4 15 Eddy C 2 4 0 1 3 4 7 Filippo C 6 7 1 2 11 5 16 Mamiska C 5 7 1 2 9 6 15 Tina C 3 0 1 0 4 0 4 Total C 117 116 13 33 200 99 279
34 I personally previously processed and extracted all faecal samples using the protocol (see Appendix I) described by Heistermann et al. (1995). Briefly, each faecal sample was extracted with 3 ml of 80% ethanol by vortexing for 15 minutes. Following centrifugation of the faecal suspension, the supernatant was recovered and stored at -20°C until a hormone analysis was performed. Faecal extracts were then sent to the “Department of Reproductive Biology” of the “German Primate Center” (Göttingen, Germany) where Dr. Michael Heistermann and his staff performed the second part of the procedure to obtain GCM concentrations (as described in paragraph 2.8).
2.5 Validation of faecal glucocorticoids measurement
Since for Eulemur collaris no method was available for assessing adrenocortical function using faecal hormone analysis, we determined the validity of four glucocorticoid assays, which have recently applied successfully to monitor glucocorticoid output in several other primate species (Heistermann et al. 2006; Fichtel et al. 2007; Ostner et al. 2008). The assays were a cortisol assay, a corticosterone assay (CCST) and two assays measuring groups of major cortisol metabolites (3a,11ß-dihydroxy-CM and 3a, 11oxo-CM). The latter two group-specific assays were used most successfully for monitoring stress hormone output in many primate taxa, ranging from lemurs to great apes (see Heistermann et al. 2006).
A biological validation was performed on three captive animals (one adult male, one adult female, and one sub-adult) at the “Cotswold wildlife park & gardens” in Burford (UK). The stress event consisted in following the animals for ten minutes and catching them with a net. During the pre-event period (five days) the zoo-staff collected one samples per day per animal. During the 3 days after the event they collected one sample per animal in the morning
35 and one in the afternoon. During the 4th and 5th day after the event the staff collected one sample per animal per day.
2.6 HPLC analysis
HPLC analysis was performed on faecal extracts of a male and female red-collared lemur as described in detail by Heistermann et al. (2006) to obtain information on the characteristics of metabolites measured in the 3,11oxo-CM assay and in the 3a,11ß-dihydroxy-CM assay to help towards a decision which of the two group-specific GC assays we should use for analysis of our samples.
2.7 Glucocorticoid metatabolites (GCM) analysis
For measurement of 3a,11 oxo-CM levels, faecal extracts were diluted (1:20 to 1:600 depending on concentration) with assay buffer (0.04 M PBS, pH 7.2) and duplicate 50 µl aliquots were measured by microtiterplate EIA along with 50 µl aliquots of reference standard in doubling dilutions over the range of 1.02-125 pg (Heistermann et al. 2006). Briefly, following incubation of the plates overnight at 4 °C, the plates were washed three times and incubated with 150 µl streptavidin–peroxidase (HRP) for 30 min in the dark at room temperature after which (following a second washing step) 150 µl of HRP-substrate solution was added to each well. Following substrate incubation (45 min), the enzyme reaction was stopped with 50 µl 2 M H2SO4 to each well and absorbance was measured at 450 nm
(reference 630 nm) on a plate reader. Sensitivity of the assay was 3 pg. Specificity data (cross-reactivities) of the assay are reported in Möstl et al. (2002). Intra-assay coefficients of variation (CV) for low- and high value quality controls were 7.7% and 6.9%, respectively.
36 Respective figures for inter-assay CV values were 10.3% and 14.5%. All hormone levels reported are expressed as ng/g dry faecal mass.
2.8 Evaluation of a possible Storage effect
To evaluate if the storage of red-collared brown lemur faecal samples on ethanol potentially affected GC concentrations as demonstrated for other species (Khan et al. 2002; Hunt and Wasser 2003), we collected other 12 faecal samples and divided each samples into three aliquots and stored them in ethanol as described above. Aliquots were kept at field station at ambient temperature before being transported to the laboratory for hormone analysis. The first aliquot of the samples was extracted after 3 months, while the other two aliquots were extracted after 6 and 12 months respectively (relative to their time of collection) because time period to test should cover the maximum period that samples were now stored in ethanol. After each extraction, extracts were stored at -20°C before all extracts were analysed at the end of the experiment.
2.9 Data analysis
For each individual we calculated average values for each reproductive stage (Gestation season: from July to September; Lactation season: from October to December; Non reproductive season: from January to April; Mating season: from May to June) and for each phenological season (Lean season: from May to October; Abundance season: from November to April). We made the distinction between lean and abundance periods on the basis of previous long term studies in our study sites (Bollen and Donati 2005; Randriahispara, unpub. data). We considered differences between sites, sexes and ranks. Ranks were analysed by
37 Valentina Serra (Serra unpub. data; Table 2.3). Mamiska (female of group C) was considered high ranking, in spite of the fact that David’s score (DS; Gammel et al. 2003) in this case gave a low value (Mamiska resulted the highest ranking female by analysing attack frequencies). Statistical comparisons were made by repeated measures ANOVA, with Tukey’s HSD post hoc analysis. We tested for normality (Kolmogorov-Smirnov test), sphericity (Mauchly’s test) and equality of variances (Levene’s test) as underlying assumptions. All analyses were performed using STATISTICA for Windows, version 8.0, and we considered p<0.05 as the significant level.
ANIMAL SEX DS RANK H/L
Group A (STL) Sotro Male 2,7 7 H Ala Female 2,5 6 H Chefo Be Male 2 5 H Rivotra Male 1,93 4 H Volana Female 0,37 3 H Fana Female -4,71 2 L Masoandro Male -4,77 1 L Group B (STL) Fotsy Male 8,35 8 H Lanitra Female 7,75 7 H Nify Male 5,25 6 H Alina Female 1 5 H Rano Female -2,75 4 L Omby Male -2,5 3 L Kintana Female -7 2 L Shielo Male -10,1 1 L Group AB (MAN) Barbarà Female 2,32 4 H Abelardo Male 2,16 3 H Eddy Male 0 2 L Octavio Male -4,48 1 L Group C (MAN) Filippo Male 5 5 H Mamiska Female 0 3 H Tina Female 0 3 L Eddy Male 0 3 L Apollo Male -5 1 L
Table 2.3 : individual ranks for each adults in study groups at Mandena (MAN) and Sainte Luce (STL). Ranks obtained by David Score (DS) evaluated by data collected during the study period.
38
CHAPTER 3
RESULTS
3.1 Validation of faecal glucocorticoid measurements
In each assay (Figure 3.1; 3.2; 3.3), most post-stress GCM concentrations were in the same range as the pre-stress GCM levels (indicated in the graphs as red dots with error bars representing means plus/minus SD) with no clear elevation seen. The only clear elevations found were in the first post-stress sample in the female (Figure 3.1) and the juvenile male (Figure 3.3).
3a,11ß-dihydroxy-CM
Hours after 10 min chasing
0 24 48 72 96 ng /g f ae c es 0 200 400 600 800 1000 1200 1400 3a,11oxo-CM
Hours after 10 min chasing
0 24 48 72 96 ng /g f ae c es 0 2000 4000 6000 8000 10000 Cortisol
Hours after 10 min chasing
0 24 48 72 96 ng /g f ae c es 0 20 40 60 80 100 120 140 CCST
Hours after 10 min chasing
0 24 48 72 96 ng /g f ae c es 0 20 40 60 80 100 120 140
Faecal GC concentrations in response to stressful chasing in an individual female Eulemur collaris
Fig. 3.1: Faecal GCM concentrations in response to stressful chasing in an individual female Eulemur collaris. Red dots with error bars represent pre-stress GCM levels (mean±SD).
39
3a,11ß-dihydroxy-CM
Hours after 10 min chasing
0 24 48 72 96 ng /g f ae c es 0 200 400 600 800 1000 1200 1400 3a,11oxo-CM
Hours after 10 min chasing
0 24 48 72 96 ng /g f ae c es 0 1000 2000 3000 4000 5000 Cortisol
Hours after 10 min chasing
0 24 48 72 96 ng /g f ae c es 0 20 40 60 80 100 120 140 CCST
Hours after 10 min chasing
0 24 48 72 96 ng /g f ae c es 0 50 100 150 200 250 300
Faecal GC concentrations in response to stressful chasing in an individual male Eulemur collaris
3a,11ß-dihydroxy-CM
Hours after 10 min chasing
0 24 48 72 96 ng /g f ae c es 0 200 400 600 800 1000 3a,11oxo-CM
Hours after 10 min chasing
0 24 48 72 96 ng /g f ae c es 0 500 1000 1500 2000 2500 Cortisol
Hours after 10 min chasing
0 24 48 72 96 ng /g f ae c es 0 20 40 60 80 100 120 140 CCST
Hours after 10 min chasing
0 24 48 72 96 ng /g f ae c es 0 50 100 150 200 250 300
Faecal GC concentrations in response to stressful chasing in an individual juvenile male Eulemur collaris
Fig. 3.2: Faecal GCM concentrations in response to stressful chasing in an individual male Eulemur collaris. Red dots with error bars represent pre-stress GCM levels (mean±SD).
Fig. 3.3: Faecal GCM concentrations in response to stressful chasing in an individual juvenile male Eulemur collaris. Red dots with error bars represent pre-stress GCM levels (means±SD).
40 We found no significant difference between the pre-stressor and the post-stressor GCM levels in the three individuals by using the four assays (Fig. 3.4).
Individual*Stressor effect: F2,9=1.501, p=0.274
3a,11ß-dihydroxy-CM
Male Female Juvenile Pre stressor Post stressor
-100 0 100 200 300 400 500 600 ng /g Individual*Stressor effect: F2,9=0.137, p=0.873 3a,11oxo-CM Male Female Juvenile Pre stressor Post stressor
-500 0 500 1000 1500 2000 2500 3000 ng /g Individual*Stressor effect: F2,9=0.238, p=0.793 Cortisol Male Female Juvenile Pre stressor Post stressor
0 10 20 30 40 50 60 70 ng /g Individual*Stressor effect: F2,9=0.543, p=0.599 CCST Male Female Juvenile Pre stressor Post stressor
0 20 40 60 80 100 120 ng /g
Fig. 3.4: Pre and post stressor GCM levels (means and standard deviations) for each individuals evaluated by “3a,11β dihydroxy-CM”, “3a,11 oxo-CM”, “Cortisol” and “CCST” assays. Results of repeated measures ANOVA are shown for each assay.
We found differences in GC levels between individuals only using the 3a,11β dihydroxy-CM assay (Figure 3.5). In this case we found that the GCM levels of the juvenile male was lower as compared to the GC levels of both the adult male and female (Table 3.1), even though the difference with the adult female was not significant.
41
Individual effect: F(2, 9)=8.1397, p=0.00959 3a,11ß-dihydroxy-CM
male female juvenile 0 50 100 150 200 250 300 350 400 450 500 n g /g f a e ce s Individual effect: F(2, 9)=4.0185, p=0.05660 3a,11oxo-CM
male female juvenile 0 500 1000 1500 2000 2500 n g /g f a e ce s Individual effect: F(2, 9)=2.6253, p=0.12643 Cortisol
male female juvenile 0 5 10 15 20 25 30 35 40 45 50 55 60 n g /g f a e ce s Individual effect: F(2, 9)=2.8930, p=0.10710 CCST
male female juvenile 0 10 20 30 40 50 60 70 80 90 100 n g /g f a e c e s
Fig. 3.5: GCM levels (means and standard deviations) for each individual evaluated by “3a,11β dihydroxy-CM”, “3a,11 oxo-CM”, “Cortisol” and “CCST” assays. Results of repeated measures ANOVA are shown for each assay.
Individual Male Female Juvenile
Male - - -
Female 0.457 - -
Juvenile 0.008 0.054 -
Table 3.1: P values of pair-wise comparison of mean differences in GCM levels across different individuals
3.2 HPLC analysis
HPLC profiles (Fig. 3.6) suggest that the 3a,11oxo-CM assay might be potentially better suited for monitoring GC output in Eulemur collaris. In fact, the data show that the