Universit`
a di Pisa
Facolt`
a di Fisica
Curriculum di Astronomia e Astrofisica
A Model for the Slow Decline of
the Galactic Recurrent Nova T
Pyxidis
Author:
Andrea Caleo
Supervisor:
Prof. Steven N. Shore
Il grande orologiaio non passa pi`u, e gli orologi li aggiustiamo noi. Adesso costruiamo le macchine, vedessi come sono belle, sai. (R. Vecchioni)
Contents
Preface iii
1 Classical and Recurrent Novae 1
1.1 What Is a Classical Nova? . . . 1
1.2 Optical Light Curves of Classical Novae . . . 2
1.3 Formation of Novae and Cataclysmic Variables . . . 4
1.3.1 A Nova-Formation Scenario . . . 4
1.3.2 The Roche Model for Binary Stars . . . 7
1.3.3 Response of a Star to Mass Loss . . . 10
1.3.4 Angular Momentum Losses . . . 10
1.3.5 The Thermonuclear Runaway . . . 13
1.4 Recurrent Novae . . . 14
2 The Slow Decline of T Pyx 16 2.1 T Pyxidis . . . 16
2.2 The Expansion of the Envelope . . . 19
2.2.1 Stages of Spectral Evolution . . . 20
2.2.2 The Bolometric Evolution of Nova Cygni 1992 . . . . 22
2.3 X-Rays Emission . . . 23
2.3.1 The X-Rays Emission from the White Dwarf Surface . 23 2.3.2 X-Rays Emission from T Pyx, IM Nor and CI Aql . . 25
2.4 The Mass of the Ejecta of T Pyx . . . 27
2.4.1 Mass of the Ejecta of Recurrent Novae . . . 28
2.4.2 Estimates of Mej Based on the Previous Eruptions . . 29
2.4.3 The 2011 Eruption . . . 29
2.5 The Mej− t2 Correlation . . . 30
3 Irradiation-Induced Mass Loss 32 3.1 Irradiation of the Secondary . . . 33
3.2 The Model by Kovetz et al. (1988) . . . 33
3.2.1 Model Setup . . . 33
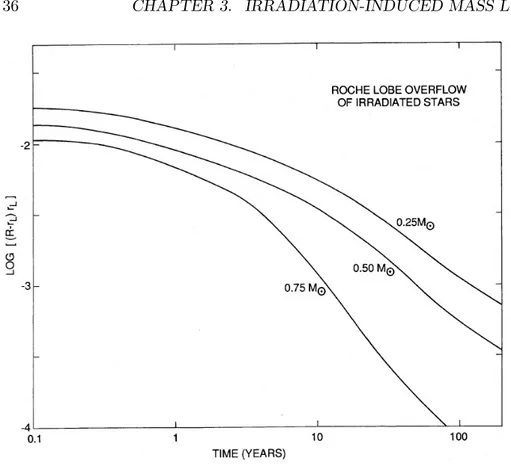
3.2.2 Discussion of the Results . . . 35
3.3 The Hibernation Scenario . . . 36
ii CONTENTS
3.3.1 Hibernation . . . 37
3.3.2 Observational Evidence . . . 38
3.3.3 Irradiation in Recurrent Novae . . . 39
3.4 The Need for a New Model . . . 41
3.5 The Mass Flow from the Centre . . . 42
3.5.1 The Polytropic Approximation . . . 43
3.5.2 The Roche Gravity . . . 45
3.5.3 The Static Model . . . 47
3.5.4 The Sonic Point . . . 47
3.5.5 The Velocity Curve . . . 49
3.5.6 The Dynamical Model . . . 50
3.5.7 Penetration Depth of the Irradiating Flux . . . 51
3.6 The Mass Flow from Surface Circulation . . . 52
3.6.1 The Irradiated Atmosphere . . . 52
3.6.2 Flux Absorption by H Atoms . . . 54
3.6.3 The Temperature of the Irradiated Layers . . . 57
3.6.4 Effect on the Mass Loss Rate . . . 57
4 Radiation Reprocessing During the Outburst 60 4.1 Ionization Fractions and Reprocessed Energy . . . 61
4.1.1 Numerical Values . . . 61
4.1.2 Equations for the Equilibrium . . . 64
4.1.3 Collisional Ionization of H and He Atoms . . . 66
4.1.4 Particle Conservation Equations . . . 68
4.1.5 Ionization Fractions for Various ˙M . . . 69
4.2 Conclusions . . . 76
4.2.1 The Shielding Effect in Recurrent Novae . . . 76
Preface
A classical nova is a stellar system whose luminosity suddenly increases and it is thought to consist of a white dwarf which is accreting mass from a close companion. The eruption of the system is due to thermonuclear reactions at the white dwarf surface, from which an envelope of material is ejected in a ballistic way during the process.
The nova problem is extremely rich and complex, as it features many different astrophysical phenomena, including thermonuclear reactions in an environment different from the more familiar stellar cores, non-spherical ejecta whose properties are difficult to determine but key to understand the details of the eruption, a secondary star irradiated by a luminosity that is orders of magnitude higher than its own, outburst recurrence timescales that span several orders of magnitudes, emission in all wavelengths from infrared to γ-rays. The physics behind each one of these phenomena is still only partially understood, so that the field of classical novae is at the frontiers of research.
Ten Galactic systems have more than one documented outburst and form the class of recurrent novae. They include some of the best studied classical novae, and allowed us to gain some insight into which system properties may be linked to a short recurrence time, most noticeably an high mass of the white dwarf and an high mass transfer rate.
With six recorded eruptions, the latest of which occurred in 2011, T Pyxidis (abbrev. T Pyx) is the most studied Galactic recurrent nova and presents several features in common with all the other recurrent novae. How-ever, its visual lightcurve is characterized by a decline timescale of about two months, which is an order of magnitude longer than that of most other recurrent novae and the second longest overall.
The radiation in the optical part of the spectrum emitted from a nova at the beginning of the eruption consists of the photons from the ejected envelope. As the envelope expands, its density drops, in particular in the outer layers, and recombination processes become less efficient. The increas-ing ionization of the outer layers implies that the photosphere moves closer to the white dwarf and therefore the radiation temperature rises, so that the maximum in the emission gradually moves away from the visual part of the spectrum. This process is faster in novae with a low-mass envelope,
iv CONTENTS
which is more easily ionized by the incoming radiation and recombines less efficiently. The timescale for the decline of the visual emission is therefore related to the mass of the envelope.
Several independent indications suggest that the mass of the envelope of T Pyx is low. They include a supersoft X-rays emission whose dura-tion is similar to that of other recurrent novae with a much shorter decline timescale, which implies a similar duration of the nuclear burning phase and therefore that roughly the same amount of fuel was left on the white dwarf after the eruption; an estimate of the mass of the material accreted between two consecutive outbursts; a direct spectroscopic determination based on ratios of emission line fluxes sensitive to the electron temperature and density in the ejecta. The estimated mass of the ejecta suggests that the decline timescale of T Pyx should be of the same order of most other recurrent novae, i.e. an order of magnitude lower than the actually recorded one. Like T Pyx, the recurrent systems IM Nor and CI Aql, also featuring a supersoft X-rays phase in line with the other recurrents, have short or-bital periods and decline timescales significantly longer than all the other 7 recurrent novae, and might be subject to the same effect.
In this thesis, an original explanation for this inconsistency is proposed with the inclusion of a new effect: I suggest that a fraction of the mass transferred from the low mass companion of the white dwarf might sur-round spherically the white dwarf itself and absorb the radiation before it reaches the ejecta, preventing them to be directly ionized by the photons from the white dwarf. The efficacy of this shielding effect depends steeply on the density of the material surrounding the white dwarf, which is higher for systems with a high mass transfer rate from the companion to the white dwarf and a short orbital period. T Pyx presents both of these attributes. The results of the model suggest that if a significant fraction of the mater-ial transferred from the companion doesn’t settle in the orbital plane, the radiation from the white dwarf is reprocessed before reaching the ejecta in T Pyx, IM Nor and CI Aql, while it isn’t in the other recurrent novae.
The mass transfer rate in the first few days of the outburst is a para-meter of the aforementioned model. During the eruption, the companion of the white dwarf is irradiated by an amount of energy per unit time which is at least two orders of magnitude higher than the luminosity of the compan-ion itself; it has been suggested in the literature (Kovetz et al., 1988) that the mass transfer rate from the companion may be significantly enhanced because of this irradiation. Since the mass transfer rate cannot be directly measured during the first days of the eruption, it can only be assessed by theoretical means, and the currently accepted model does support a mass transfer enhancement of up to a factor of 102.
The present work provides therefore the opportunity to critically review the model of the mass transfer enhancement, which includes some quite limiting approximations, as it doesn’t include the gravitational force of the
CONTENTS v
white dwarf acting onto the companion nor a correct assessment of the energy dissipation from the outer layers of the companion itself. The dis-cussion of the mass transfer enhancement in the literature plays a crucial role in understanding the long-term evolution of novae, being at the core of the so-called hibernation scenario, which describes the cyclic behaviour of cataclysmic variables allowing for time-dependent mass loss rates. In this scenario, the mass transfer rate is supposedly high due to the irradiation enhancement for ∼ 102 yr after the eruption; as the irradiation-driven mass transfer ends due to the cooling of the white dwarf, the companion shrinks and mass transfer is significantly reduced. It will then take ∼ 104 yr of hibernation before the original mass transfer rate is restored.
After having reviewed the current model for the irradiated companion and the hibernation scenario, I discuss the applicability of the currently accepted mass transfer enhancement scheme to the case of recurrent novae in general and T Pyx in particular and present an original, steady state model which highlights the relevance of some currently neglected features of the irradiation acting onto the companion. Given the complexity of the problem, only an exploratory model could be presented, and it should be considered an invitation to consider some relevant features currently missing from the discussion rather than the solution of the very difficult problem of irradiation-induced mass transfer. The results suggest that only a very thin layer of the companion is affected by the irradiation and the enhancement effect is negligible; the mass transfer rate at quiescence is therefore used to study the shielding of the radiation by the material surrounding the white dwarf.
The thesis is organized in four chapters:
• Chapter 1 contains a general introduction to classical and recurrent novae. Although no previous knowledge of the subject is assumed, some astrophysical background (e.g. familiarity with the terms “white dwarf” and “main sequence”) is required.
• Chapter 2 presents the properties of T Pyxidis, its similarities with the other recurrent novae including a low mass of the ejecta and the duration of the soft X-rays emission phase, and how they suggest that a shorter decline timescale for T Pyx, IM Nor and CI Aql might be expected.
• Chapter 3 presents the problem of irradiation-induced mass transfer and describes the model by Kovetz et al. (1988) and the hibernation scenario for the long-term evolution of cataclysmic variables. A new original but sketchy model, including the different gravity structure in the close binary, is then discussed; it suggests that the enhancement effect is less relevant than currently believed, inviting further work on the subject.
vi CONTENTS
• In chapter 4, I argue that if a significant fraction of the material trans-ferred from the companion during a nova eruption doesn’t settle in the orbital plane, the radiation from the white dwarf is reprocessed before reaching the ejecta. Assuming that a fraction f of the transferred ma-terial surrounds the white dwarf being distributed in its Roche lobe, I demonstrate that f & 10−3 is required for this effect to occur in T Pyx, while it’s unfavoured in systems with longer orbital periods. This effect might therefore explain why the optical light curves of short-period recurrent novae takes very long to decline.
All the numerical analyses and plots have been realized by means of the software Mathematica.
Chapter 1
Classical and Recurrent
Novae
The most complete and recent introductory book on this subject is the second edition of Classical Novae, edited by Bode & Evans (2008) in this thesis. Another useful and broad-range reference is the more recent PhD thesis of Uthas (2011).
1.1
What Is a Classical Nova?
A comprehensive discussion of the history of novae observations and theor-etical models is outside the scope of this introductory chapter. The reader can refer to Duerbeck (2008) for such a treatment. Nonetheless, a few no-tions, useful to set the scene and understand what follows, will be presented here.
The word nova, abbreviated from stella nova, originally meant new star. However, it’s been centuries since it’s been realized that novae aren’t newly formed stars, but already existing celestial objects whose luminosity sud-denly grows and gradually fades back to a value usually similar to the one before the outburst.
The most important observational differences between novae and super-novae are in their luminosities as well as their light curves. Lundmark (1935) defines supernovae as the burst phenomena with absolute magnitude at the peak Mmax . −15, while for classical novae Mmax & −7. Although
determ-ining the total Galactic nova rate through observational means is difficult, because such rate must be corrected for incompleteness, selection effects and interstellar extinction, a reference value of 34+15−12 yr−1 was given by Darn-ley et al. (2006); this makes novae at least 103 times more frequent than supernovae.
The first theoretical discussions regarding novae which included the fun-damental ingredients of nowadays models, i.e. binarity of the system and
2 CHAPTER 1. CLASSICAL AND RECURRENT NOVAE
thermonuclear reactions at the surface of a star, were made in the 1950s and 1960s. I will not outline the historic development of the models here, but I will briefly present one of the first quantitative estimates for a crucial phase in the formation of classical novae in section 1.3.4, included in Paczynski (1976).
A nova for which there’s been only one directly observed eruption is said a classical nova, while the few novae with more than one documented outburst are called recurrent novae. The peculiarities of recurrent novae are highlighted in section 1.4.
1.2
Optical Light Curves of Classical Novae
Although many properties of classical novae require a detailed spectroscopic analysis, in this thesis I will mostly make use of photometric data. The first analyses of nova light curves date back to Payne-Gaposchkin (1957), who could already distinguish several different behaviours with a sample as small as 5 light curves followed from the peak of the emission into quies-cence. Although the discussion by Payne-Gaposchkin (1957) is still in part valid and included in recent reviews (as that by Warner (2008)), it doesn’t describe accurately the complexity of all nova light curve shapes, which is demonstrated by the recent classification of light curves given by Strope et al. (2010), from the analysis of 93 well-observed novae.
Seven optical nova light curves are shown in figure 1.1. Each of them was chosen by Strope et al. (2010) as prototype of a class of objects with similar light curves. Although the S-class, which corresponds to a smooth light curve without any major irregularity, is the most populated, it contains just 38% of the novae analysed by Strope et al. (2010): the majority of novae doesn’t have a smooth light curve.
The initial rise phase is rarely observed and in some cases the luminosity increase shows an evident slowdown before reaching the peak of the emission, but it still takes a short time, from a few hours to a few days, to reach maximum luminosity. Some light curves show evident oscillations near the peak luminosity phase (e.g. see the light curve of T Pyx, figure 2.1).
Although the peak luminosity is generally short-lived and the decline begins just a few hours to a few days after the maximum, the rate of decline ranges over a large interval. The timescale of the early decline phase can be quantified using the value of t2, defined as the time it takes for the light
curve to rise to 2 magnitudes above the maximum. t3, defined analogously
as the time it takes for the system luminosity to drop by 3 magnitudes, is also used and will be addressed often in this thesis. The observed values of t2 can be lower than 10 days for very fast novae, and go up to 250 days for
very slow novae. Most of the historic nova classification attempts relied on the velocity of the decline phase, e.g. Lundmark (1935).
1.2. OPTICAL LIGHT CURVES OF CLASSICAL NOVAE 3
Figure 1.1: Seven nova light curves illustrating the classification scheme proposed by Strope et al. (2010). The letter identifying the class is shown in parentheses after the prototype name. The meaning of the identifying letter is explained close to the light curve (for example, the F-class is characterised by a flat top in the light curve). The light curve of the recurrent nova T Pyx, shown in figure 2.1, may be included in the F- or J- class.
4 CHAPTER 1. CLASSICAL AND RECURRENT NOVAE
The early decline is followed by a transition phase in which there are several possible behaviours, which were used by Strope et al. (2010) to define their classification scheme. Although a theoretical model for the evolution of a nova light curve was presented by Hachisu & Kato (2006), who argue that the optical light curve originates in the free-free emission from the optically thin fraction of the ejecta surrounding the system, most of the physical origins of the 6 classes different from the S-class are unknown (with some exceptions; e.g. the dip in the light curves in the D-class is known to be related to the formation of dust in the ejected envelope, which shields the radiation at first, and then becomes transparent again when the density in the ejecta has dropped), so that there must be several basic physical phenomena that still have to be understood that act to modify the smooth behaviour of the light curves of some nova systems.
The light curves shown in figure 1.1 show only the information available with optical photometry. The physical evolution of nova systems can only be understood by multi-wavelength coverage as the peak of the emission gradually shifts from the optical to the ultraviolet (and eventually X-rays) part of the spectrum, as described in chapter 2.
1.3
Formation of Novae and Cataclysmic Variables
In this section, I discuss some mechanisms of particular relevance for the nova problem. Section 1.3.1 presents in a brief and qualitative way the fundamental steps of a nova formation scenario; the subsequent sections examine in greater depth, and when possible from a quantitative point of view, some of the issues which play a relevant role both in the formation mechanism and in the rest of this thesis: the Roche model for close binary stars undergoing mass transfer, the effect of mass loss on the hydrostatic and thermal equilibria of a star, the mechanisms involved in the dissipation of orbital angular momentum necessary for the orbital shrinking and the thermonuclear runaway which causes the luminosity increase of classical novae.
1.3.1 A Nova-Formation Scenario
A classical nova is a cataclysmic nuclear runaway on the surface of a white dwarf star in a binary system which is accreting material from a close com-panion. In order to describe the physical properties of such systems, I de-scribe here a formation scenario of classical novae through a sequence of evolutionary steps, without covering all the possible formation pathways. Further details can be found in Iben & Fujimoto (2008); the evolution of close interacting binaries is treated by van den Heuvel (1992).
1.3. FORMATION OF NOVAE AND CATACLYSMIC VARIABLES 5
primary star of mass in the range 2÷10 M with an hydrogen-depleted
core and a less massive secondary star in the main sequence phase. For the sake of clarity, I will denote the initially more massive star as S1
and the initially less massive star as S2 during this discussion.
The initial separation of the two stars must be sufficiently small that S1, expanding due to its natural stellar evolution, will eventually have
a total acceleration due to the centrifugal force and the gravitational attraction of the two stars equal to zero at the point closer to S2 so
that part of its envelope will flow towards S1. In other words, S1 will
eventually fill its Roche lobe (see section 1.3.2).
• When S1 fills its Roche lobe, it starts losing mass, possibly in a self-induced way (see section 1.3.3). As a result, part of the mass from S1
will form a common envelope surrounding the two stars.
• The effect of the common envelope phase is to reduce the orbital separ-ation by means of the drag force acting on the stars; see section 1.3.4. The system eventually becomes as follows: the orbital separation has been drastically reduced to values corresponding to an orbital period Porb ∼ 10h; S1 has lost most of its envelope and is now reduced to
a white dwarf-like star; S2 is a main sequence star filling or almost
filling its Roche lobe; the common envelope has been expelled from the system.
• If S2 isn’t filling its Roche lobe after the common envelope phase, a long-duration phase in which the orbital radius is slowly reduced takes place, during which the main process of angular momentum dissipa-tion is magnetic braking, i.e. the escape of charged particles carry-ing angular momentum along magnetic field lines (see section 1.3.4). Eventually, S2 will be a Roche lobe filling star.
• The system is now composed of a white dwarf and a Roche lobe filling companion; such a binary is said cataclysmic variable because it is subject to irregular changes in its brightness, even by large factors. The mass lost from S2 forms an accretion disc in which the accreted
material loses angular momentum before reaching the white dwarf S1
at the boundary layer between its surface and the disc. The point at which the stream of material lost from S2 hits the accretion disc is
denoted as the bright spot of the system because it may be the source of a significant fraction of the system luminosity in this phase. Figure 1.2 shows the picture of a cataclysmic variable system during the mass transfer phase which precedes a nova explosion.
• The mass deposited onto the white dwarf forms an hydrogen-rich layer; as its mass increases, the temperature and pressure at its base increase
6 CHAPTER 1. CLASSICAL AND RECURRENT NOVAE
Figure 1.2: Artistic representation of a cataclysmic variable. The material lost from the donor star forms a stream which hits the accretion disc at the bright spot. The material from the disc eventually falls onto the boundary layer between the disc and the white dwarf. Figure from Uthas (2011).
and nuclear reactions eventually take place, in the form of a non-destructive thermonuclear runaway at the white dwarf surface (see section 1.3.5). This event increases the system luminosity and is the trigger of the nova eruption.
• Mass transfer from S2 to S1 continues during and after the nova event,
so that multiple eruptions may occur in most nova systems. Some novae have more than one documented outburst and therefore a short recurrence timescale (trec . 102yr), and are said to be recurrent novae.
The scenario presented above is not the only one which leads to a classical nova. In particular, there is another formation channel which doesn’t involve cataclysmic variables, but has its origin in symbiotic stars, i.e. systems composed of a white dwarf and a red giant or asymptotic giant branch star. In symbiotic stars, the main mass transfer process is the accretion from the stellar wind of the companion of the white dwarf. Since the Roche lobe of neither star has to be filled, the orbital radius and period of symbiotic stars may be much larger than those of cataclysmic variables with the same system masses.
1.3. FORMATION OF NOVAE AND CATACLYSMIC VARIABLES 7
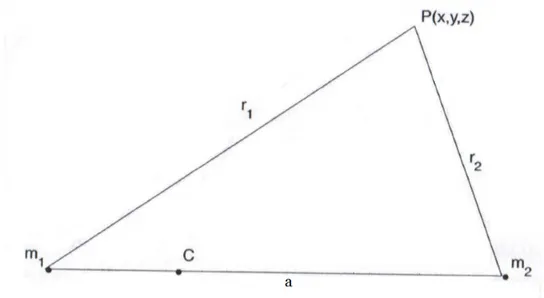
Figure 1.3: Two masses m1, m2 with their common centre of mass at C,
separated by a distance a. Figure from Hilditch (2001).
1.3.2 The Roche Model for Binary Stars
The Roche model constitutes the solution of the restricted three-body prob-lem, defined as the study of the motion of a body of infinitesimal mass placed in the gravitational field of two masses m1 and m2, which are assumed to
be moving in circular orbits about their centre of mass and rotating around their axes, perpendicular to the orbital plane, at the orbital frequency. This configuration is often achieved in a binary system because it is the state of minimum energy; the energy dissipation processes which allow to reach it are due to the tidal force acting between the stars (see Zahn (2008) for further details on the circularization and synchronization of binary systems). Play-ing a key role in many fields related to astrophysics and celestial mechanics, the Roche model is discussed in many introductory books; my presentation is partially based on Hilditch (2001), who treats the problem from the point of view of interacting binary stars.
Studying the restricted three-body problem in the rotating reference frame in which the massive bodies are at rest, it is possible to determine the total (gravitational + rotational) potential Φ experienced by the third body and find which regions of space it can move in at a given energy.
As shown in figure 1.3, which depicts the situation in the rotating refer-ence system with Cartesian coordinates with origin corresponding to m1, I
assume m1≥ m2, I call a the orbital separation from m1to m2, and consider
8 CHAPTER 1. CLASSICAL AND RECURRENT NOVAE
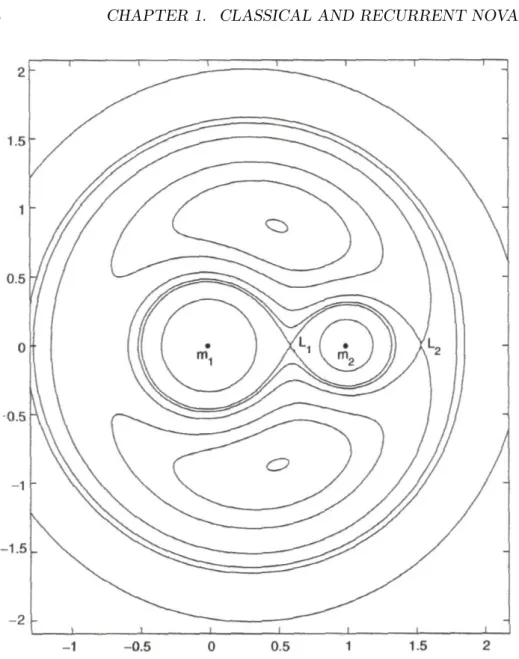
Figure 1.4: A cross section in the orbital plane showing the equipotential surfaces for a binary system with mass ratio q = 0.4, with unit of distance equal to the orbital distance a. Figure adapted from Hilditch (2001).
is defined to simplify the notation.
The total potential at the position of the third body as the sum of the gravitational and rotational terms is given by:
Φ(x, y, z) = −Gm1 r1 −Gm2 r2 −w 2 2 ((x − q 1 + qa) 2+ y2) (1.1)
1.3. FORMATION OF NOVAE AND CATACLYSMIC VARIABLES 9
In figure 1.4 the equipotential lines for the normalized potential Φn = −2
G(m1+m2)Φ are shown; the unit of distance is taken equal to the orbital
separation a. The five points for which ∇Φ = 0 are called Lagrangian points and represent equilibrium positions for the third body; three of them lie on the line passing through the positions of the massive bodies, while the other two are the vertices of the two equilateral triangles with the orbital radius as a side and lying on the orbital plane. Only two of them, labelled as L1 and L2, are marked in figure 1.4.
If the third body is near m2with and its kinetic energy is too low to cross
the equipotential surface through L1, it will be trapped inside an
almost-circular surface around m2. As its energy grows, it will eventually be able
to cross the L1 point, referred to as the inner Langragian point. The L2
point constitutes the easiest escape route from the whole binary system for sufficiently energetic matter.
Although they are calculated with the assumption of pointlike or spher-ically symmetric masses m1 and m2, the shape of the Roche equipotential
curves are used as surfaces for stars in a close binary system. The two sur-faces that just touch at L1 are referred to as the Roche lobes for the two
components of the binary system; stellar material of the star of mass m1
with enough energy to cross the Roche lobe related to its star can orbit around the whole system.
There are several stellar evolution processes that change the radius of a star, so that a stellar system in which both stars are entirely inside their Roche lobes (such a system is said to be detached ) may eventually turn into a system in which a star fills the Roche surface including L1 (semi-detached
system). Every subsequent expansion of such star causes some material to cross the Roche limit; this material is likely to be lost by its original star (to be transferred to its companion, to a common envelope, or away from the system). The importance of the L1 point is therefore clear: since it’s the
easiest position the stellar material can cross to leave its original star, most of the mass being transferred will flow close to it.
For some astrophysical applications (as the model described in chapter 4), the exact geometry of the Roche lobe isn’t required, and it is approx-imated as a sphere whose radius (referred to as the Roche radius) is chosen in order to have the volume of the sphere equal to the volume of the Roche lobe. In a system with mass ratio q = m1/m2, the radius of the Roche
lobe relative to m1 can be approximated to better than 1% by the equation
(Eggleton, 1983):
rRL =
0.49q2/3
10 CHAPTER 1. CLASSICAL AND RECURRENT NOVAE
1.3.3 Response of a Star to Mass Loss
When a star fills its Roche lobe and loses mass through L1, its hydrostatic
and thermal equilibria are disturbed. The response of the star to this effect is important to understand the evolution of the system: if the stellar radius tends to increase in order to reach a new equilibrium state, the Roche lobe can be overfilled and the mass loss process is favoured, while if the stellar radius tends to decrease the mass loss is less effective.
The response of a star to this perturbation depends on its mass and evolutionary state and is discussed in greater detail in van den Heuvel (1992). However, a particularly important fact can be illustrated by a simple analytical argument: the radius of non-rotating, non-magnetic, uniform-composition stars with a deep adiabatic convective envelope will increase upon mass loss to restore hydrostatic equilibrium. This is because the gas, which is adiabatic in the sense that its timescale for heat exchange is much longer than the timescale to restore the dynamical equilibrium in the star, is described by a polytropic equation of state:
P = Cργ (1.3)
where γ = 53 (see also section 3.5.1 for a comparison with a star treated with a more elaborate model). This equation of state is identical to that of a non-relativistic white dwarf for which the following simple mass-radius relation is well known (Kippenhahn & Weigert, 1994):
R ∝ M−1/3 (1.4)
i.e., if the mass of the star decreases, the radius will increase. This result suggests that high mass-loss rates are favoured in systems with convective stars, such as low mass stars in the main sequence or stars moving into the red giant branch.
1.3.4 Angular Momentum Losses
The evolutionary scenario described in section 1.3.1 involves several pro-cesses which result in the shrinking of the orbital radius and therefore the loss of both energy and angular momentum from the system. Since the de-termination of efficient mechanisms of angular momentum loss required a long time and there’s still discussion on many relevant details in the current debate, it’s worth highlighting here three mechanisms of angular momentum loss which play the most significant role in different phases of the evolution-ary life of the system.
The common envelope phase is presented from the point of view of the milestone article by Paczynski (1976). A more detailed, numerical modelling of this phase is difficult to achieve and still open to debate; see Ivanova et al. (2013) for a recent review. Magnetic braking and gravitational radiation are discussed in Uthas (2011) and references therein.
1.3. FORMATION OF NOVAE AND CATACLYSMIC VARIABLES 11
The Idea of Common Envelope Evolution
The first suggestion on how the common envelope phase may play a signi-ficant role in the formation of a cataclysmic variable was presented in the milestone article by Paczynski (1976). I show here his simple quantitative explanation of the spiralling of the stars and the timescale it takes for a significant reduction of the orbital period of the binary system.
If I consider a binary system orbiting circularly in a common envelope with low density ρ, from Kepler’s third law w2a3 = GM (in which w is the mean angular frequency, a the orbital separation, M the total mass of the system) I can determine the orbital velocity of a single star. Up to a numerical factor of order unity depending on the mass ratio:
v ≈ wa = (GM a )
1/2 (1.5)
A drag force acts on the system due to the material in the common envelope accumulated on the stars. The geometrical cross section for the capture of the material is that of the Roche surface, so it’s proportional to a2. The drag force is given by the momentum per unit time of the accreted material in the reference frame in which the stars are fixed; it is therefore:
Fdrag ≈ a2v2ρ ≈ GM aρ (1.6)
Assuming that the energy lost due to this drag force gives the variation in potential energy of the system which remains bound with a circular orbit gives: Fdragv ≈ d dt GM2 a ≈ GM2 aτs (1.7)
Where τs is the timescale of the spiralling. Inserting equation 1.6 and
re-arranging gives:
τs≈
M
a3ρPorb (1.8)
where Porb= 2πw.
Paczynski applies equation 1.8 to a system with two stars of 0.8 M and
an assumed density of the envelope ρ ≈ 10−8 g cm−3, comparable to the density in a red giant envelope. The result is τs≈ 103Porb.
Although the common envelope phase in the evolution of close binary systems certainly occurs, a comprehensive model of this event is still unavail-able. Some of the required features are difficult to achieve, e.g. the expulsion of the envelope after the spiralling, and elaborate multidimensional analyses seem to be necessary for further improving the results (Ivanova et al., 2013).
12 CHAPTER 1. CLASSICAL AND RECURRENT NOVAE
Magnetic Braking
The process of magnetic braking drives the loss of angular momentum in systems which have already expelled their common envelope and have peri-ods Porb& 3h. The accretion rates estimated from the observations for these
systems are of order 10−9÷ 10−8 M yr−1.
In the magnetic braking scenario, the donor star has a significant mag-netic field and a wind of ionized particles is forced to follow the field lines out to the distance at which the magnetic pressure becomes lower than the gas pressure (Alfv´en radius). The charged particles flowing away along the field lines carry away angular momentum from the donor star. The loss of spin angular momentum of the donor star results in a loss of orbital angular momentum due to the tidal force between the two stars which restores syn-chronous rotation. The decrease in orbital angular momentum also implies the reduction of the orbital radius and period of the system.
The magnetic braking mechanism becomes ineffective when the orbital period has shrunk to Porb∼ 3 h. This is because the white dwarf companion
in these systems has become a fully convective, low mass star with M . 0.3 M , and stellar evolution analyses suggest that such stars don’t have a
strong magnetic field to support the magnetic braking effect (see Uthas (2011) and citations therein). The mass loss rate is therefore reduced and this causes a contraction of the low mass star which now underfills its Roche lobe.
Gravitational Radiation
Gravitational radiation drives the loss of angular momentum in systems with periods Porb. 3h.
As discussed on the treatment of magnetic braking, systems with Porb∼
3 h, whose donor is becoming a convective star, undergo a significant reduc-tion of the mass transfer rate which results in the shrinkage of the donor. The Roche lobe of the secondary star of such systems isn’t filled anymore and there is a phase of negligible mass transfer, and therefore reduced lu-minosity, which lasts approximately 108 yr. During this phase, the loss of energy and angular momentum is due to gravitational radiation and this process shrinks the binary orbit until the donor has filled its Roche lobe again, its period being of order Porb ∼ 2 h. The period interval in which
the Roche lobe isn’t filled is called the period gap because of the scarcity of observable systems in such an interval.
When the Roche lobe is again filled, gravitational radiation is still driving the loss of angular momentum from the system, and mass transfer is rein-stated, although at lower rates than in the magnetic braking phase. Typical mass transfer rates during this phase are of order 10−11÷ 10−10M yr−1.
1.3. FORMATION OF NOVAE AND CATACLYSMIC VARIABLES 13
1.3.5 The Thermonuclear Runaway
Recent models for the thermonuclear runaway at the white dwarf surface are reviewed in Starrfield et al. (2008); I present here some details useful to understand the basics of the physical process and some of its properties which will play a key role in chapter 2 of this thesis.
Hydrodynamic models of accretion onto the white dwarf have shown that the hydrogen-rich gas of the low mass companion forms a layer on the degenerate star surface. The base of this layer eventually becomes hot and degenerate at the same time and a violent phase of nuclear reactions (both via the pp chain and the CNO-cycle) takes place, in a way similar to the Helium flash. As a consequence of the event, part of the material on the white dwarf surface is ejected and determines the photometric and spectroscopic properties of the nova system after the eruption.
Before the thermonuclear runaway, mixing between the hydrogen-rich layer accreted from the low mass companion and the white dwarf material may take place by means of particle diffusion and thermal convection, alter-ing significantly the chemical composition of the ejected layer and therefore its spectroscopical properties.
It can be shown that the mass of the accreted layer required to turn on the nuclear reactions Mcrit(generally in the interval 10−6÷ 10−3 M ) is
approximately fixed by the mass of the white dwarf; in fact, it can be argued (see Starrfield et al. (2008), section 3, and the first derivation by Fujimoto (1982) based on the solution of the stellar equations in the outer layers of the white dwarf) that the pressure for the ignition at the base of this layer is approximately fixed, at values of order Pcrit∼ 1020 dyn cm−2. The pressure
is due to the weight of the accreted mass, so that Pcritis reached when the
envelope mass has reached the critical value Mcrit satisfying:
Pcrit=
GMW DMcrit
4πR4 W D
(1.9)
so that high-mass white dwarfs, which have a small radius, will require a smaller amount of hydrogen-rich matter than low-mass white dwarfs to erupt as novae. Although the situation is actually more complex since a more careful analysis shows that Mcrit depends also on the white dwarf chemical
composition and the rate of accretion, relation 1.9 is useful to understand why recurrent systems are expected to have massive white dwarfs: a short recurrence timescale trec . 102 yr is easier to achieve if the mass to be
accreted in such a short time is low.
The Constant Lbol Phase
The nuclear reactions on the surface of the white dwarf usually last for a few months, certainly for a time longer than the timescale for the decline
14 CHAPTER 1. CLASSICAL AND RECURRENT NOVAE
of the visual light curve t2. The emission therefore shifts from the visual
part of the spectrum to other wavelengths regions - namely the ultraviolet and eventually the X-rays. The processes at the base of this behaviour are discussed in detail in chapter 2 (see section 2.2); here it suffices to say that the bolometric luminosity Lbol of the system remains approximately
constant for a time significantly longer than t2, at a value of order of the
Eddington luminosity of the white dwarf LEdd.
The Eddington luminosity of a spherical celestial body is the maximum luminosity it can achieve in a state of hydrostatic equilibrium, and it is achieved when there is exact balance between the gravitational force acting on its outer layers and the radiation pressure pushing them away. Assuming that the radiation pressure acts on the material by means of electron scat-tering (any other source of opacity, like line scatscat-tering from neutral atoms, would produce a lower limit), the Eddington luminosity is:
LEdd=
4πGMW DmPc
σT
≈ 3.2 · 104(MW D/M )L (1.10)
where MW D is the mass of the white dwarf, mP is the mass of the proton,
c is the speed of light and σT is the Thomson cross section.
The outer layers of the white dwarf are certainly not in hydrostatic equi-librium at the onset of the thermonuclear runaway; in fact, an envelope is expelled. Even during the long duration nuclear burning, the Eddington limit doesn’t strictly apply to the white dwarf because the radiation origin-ates from the very surface of the white dwarf and it may leave the system before being scattered by any other particle at the surface. The Eddington luminosity is, in fact, just a crude estimate of the bolometric luminosity dur-ing this phase and super-Edddur-ington systems have been observed (see section 3.3 of Shore (2008)).
1.4
Recurrent Novae
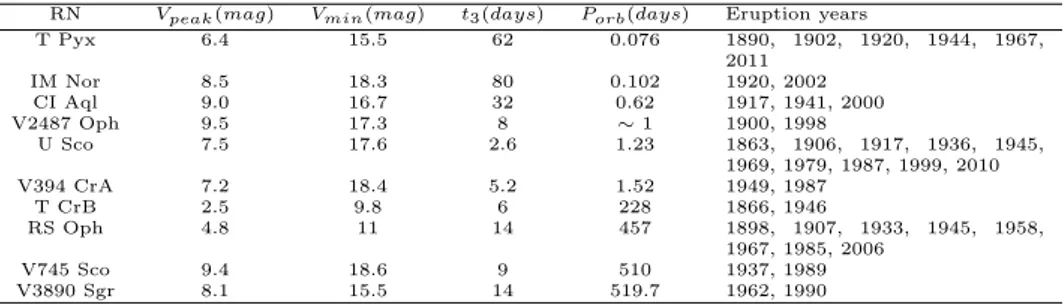
Novae with more than one documented outburst are called “recurrent”. Only ten recurrent novae are currently known; a compilation of observa-tional data on these systems has been given by Schaefer (2010), from which I reproduce table 1.1. The table does not include the eruption of T Pyx close to the year 1866 inferred by Schaefer et al. (2010) from the study of the ejecta, for which there weren’t any reported direct observations (see also section 2.4.2).
In order to have a short recurrence timescale, a nova must be able to accrete the material required for an outburst much faster than most other novae. This means that the white dwarf requires little mass to ignite the thermonuclear reactions (which in turn means that its mass is high, being close to the Chandrasekhar mass, of order Mcha& 1.4 M , the exact value
1.4. RECURRENT NOVAE 15
Table 1.1: Summary of known recurrent novae, extracted from Schaefer (2010), with the addition of the latest eruptions of U Sco (2010) and T Pyx (2011).
RN Vpeak(mag) Vmin(mag) t3(days) Porb(days) Eruption years
T Pyx 6.4 15.5 62 0.076 1890, 1902, 1920, 1944, 1967, 2011 IM Nor 8.5 18.3 80 0.102 1920, 2002 CI Aql 9.0 16.7 32 0.62 1917, 1941, 2000 V2487 Oph 9.5 17.3 8 ∼ 1 1900, 1998 U Sco 7.5 17.6 2.6 1.23 1863, 1906, 1917, 1936, 1945, 1969, 1979, 1987, 1999, 2010 V394 CrA 7.2 18.4 5.2 1.52 1949, 1987 T CrB 2.5 9.8 6 228 1866, 1946 RS Oph 4.8 11 14 457 1898, 1907, 1933, 1945, 1958, 1967, 1985, 2006 V745 Sco 9.4 18.6 9 510 1937, 1989 V3890 Sgr 8.1 15.5 14 519.7 1962, 1990
depending on the chemical composition of the white dwarf) and/or that the accretion rate M is particularly high. A quantitative analysis of the˙ required white dwarf masses and accretion rates has been conducted from the synthetic nova models by Yaron et al. (2005) (see Schaefer et al. (2010)), and it suggests that short recurrence timescales are only possible for systems with MW D & 1.2 M and accretion rates ˙M ∼ 10−8÷ 10−7 M yr−1.
Recurrent novae draw the attention of the community because they are considered plausible candidates as supernovae Type Ia progenitors; a long and heated discussion in the literature is ongoing on this issue (see for ex-ample Kato & Hachisu (2012) and references therein). Recurrent novae are favoured with respect to classical novae because of the high values of the white dwarf mass, which could be already close to the Chandrasekhar mass. To determine whether they are supernovae Type Ia progenitors, a precise comparison between the mass ejected by the system at each nova event and the mass accreted on the white dwarf between the two events is required: if the ejected mass is lower than the accreted mass at every event, the white dwarf will eventually reach MCha. Unfortunately, estimates of such
quant-ities are difficult to determine with high accuracy both by observational and theoretical means (see chapter 2 for the discussion on T Pyx), and the problem is therefore still unsolved.
Chapter 2
The Slow Decline of T Pyx
The recurrent nova T Pyx is characterized by a decline timescale t3 = 62
days (see table 1.1 and figure 2.1), which makes it a moderately fast nova. However, there are good reasons to expect a faster decline in a nova as T Pyx, and they are reviewed in this chapter.
The optical light curve near the maximum consists of the radiation from the envelope ejected by the white dwarf at the beginning of the eruption, the mass of the ejecta usually (but not always) being in the interval 10−6 M <
Mej < 10−4 M . As the envelope expands, its density drops, in particular
in the outer layers, and recombination processes become less efficient. The increasing ionization of the outer layers implies that the photosphere moves closer to the white dwarf and therefore the temperature of the radiation rises, so that the maximum in the emission gradually moves from the optical to the ultraviolet (and, in some cases, to the X-rays) part of the spectrum. This process is faster in novae with a low-mass envelope, which is more easily ionized by the incoming radiation and recombines less efficiently.
All recurrent novae, except for the 3 with the lowest orbital periods T Pyx, IM Nor and CI Aql, have short decline timescales of a few days or a few weeks and presumably low-mass envelopes. Although measuring the mass of the ejecta is difficult, there are now solid reasons, based on independent indications, to believe that the envelope ejected by T Pyx has a particularly low mass too, so that its decline timescale should also be short.
2.1
T Pyxidis
T Pyxidis is the most studied recurrent nova, with 6 documented eruptions, and it is the main subject of study of this thesis.
The light curve of the latest eruption of T Pyx is shown in figure 2.1. Even before the 2011 outburst, the attention of the literature was focused on various interesting features of T Pyx, several of which are discussed in the PhD thesis by Uthas (2011). I outline here the currently accepted data
2.1. T PYXIDIS 17
Figure 2.1: Light curve of T Pyxidis from the 2011 outburst to the end of the year. Data collected by the American Association of Variable Star Observers (AAVSO).
for this system at quiescence; the detailed study of the parameters of T Pyx was one of the aims of Uthas (2011), and the discussion of most of these values can be found there.
• The mass ratio of T Pyx is q = 0.20 ± 0.03.
This is derived by spectroscopic means taking advantage of the fact that the orbital velocity of the white dwarf and the velocity at the outer radius of the accretion disc depend only on the mass ratio q; see Uthas et al. (2010) and Warner (1973).
• There is no reliable estimate for the component masses of T Pyx. The fact that it is a recurrent nova suggests that the mass of the white dwarf is high, most likely MW D ≥ 1 M .
Uthas et al. (2010) estimate MW D = (0.7 ± 0.2)M and Mcomp =
(0.14±0.03)M but their derivation involves theoretical main-sequence
mass-radius relations for the low mass companion which may not hold for a Roche-filling star, and they clearly state that there are strong reasons to believe the masses to be significantly higher.
• The inclination of the system is low, evaluated spectroscopically as i = 10◦± 2◦ by Uthas (2011), who provides references for other estimates, all in the range i ∼ 10◦÷ 30◦ (e.g. Gilmozzi & Selvelli (2007), Warner (1995) and references therein). Since i is low, the system is almost seen face-on.
18 CHAPTER 2. THE SLOW DECLINE OF T PYX
The inclination can be estimated as follows. From spectroscopic ana-lyses of the velocities along the line of sight, it is possible to estimate the value of KW D = vW Dsin i where vW D is the white dwarf orbital
speed and i is the inclination of the system. Assuming a circular orbit, vW D can be expressed in terms of the orbital period P , the orbital
dis-tance a and the mass ratio q as vW D = 2πaP ·q+1q . a can be expressed
in terms of the masses by means of Kepler’s third law and varying the component masses in any reasonable combination gives the range of values described by Uthas (2011).
• The orbital period has been determined as 0.076 d both from pho-tometric and spectroscopic analyses (see Uthas (2011) for the discus-sion).
• The timescale of the decline of the optical light curve is t3' 62 d, and
it’s been the same for the various eruptions of T Pyx (Schaefer, 2010). It can be estimated from the data reported in figure 2.1.
• The quiescent mass loss rate has been determined by Selvelli et al. (2008) as ˙M & 10−8 M yr−1.
This value is derived assuming the luminosity at quiescence to be mainly due to the accretion disc and using several L − ˙M relations in the literature, most of which give M ∼ 10˙ −8 M yr−1 although
results up to 5 · 10−8 M yr−1 are possible.
A simple estimate is achieved by assuming that the disc is heated by viscous dissipation of gravitational energy of the material slowly moving towards the white dwarf. The gravitational energy per unit time deposited into the disc by the material is:
˙
E = GMW DM˙ 2RW D
(2.1)
At thermal equilibrium, ˙E must be equal to the energy per unit time emitted by the disc, i.e. its luminosity Ldisc. Therefore the accretion
rate can be estimated as:
˙
M = 2RW D GMW D
Ldisc (2.2)
The disc luminosity can be estimated from the integrated UV con-tinuum flux corrected for the reddening and the distance of the sys-tem (see Selvelli et al. (2008)) as Ldisc ∼ 70 M , which gives M =˙
(1.1 ± 0.3) · 10−8 M yr−1 for a range of white dwarf masses 1.3M .
2.2. THE EXPANSION OF THE ENVELOPE 19
• The mass of the ejecta of T Pyx at its last eruption has been estimated by Shore et al. (2013) as the low value Mej = 2 · 10−6 M . There are
several indications that the mass of the ejecta is low, presented in sections 2.3 and 2.4 in this thesis.
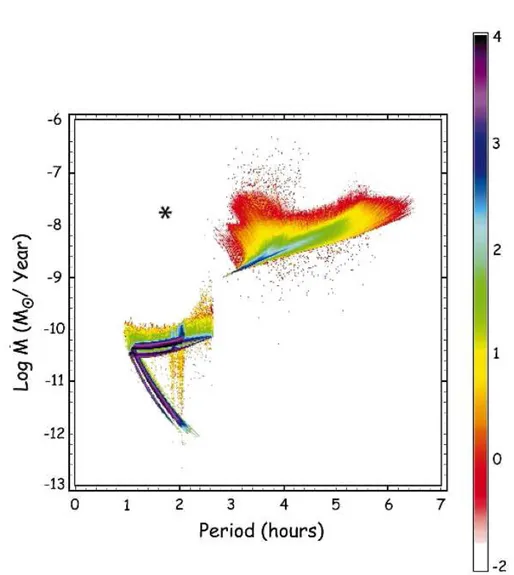
The mass transfer rate of T Pyx is particularly high for its period, so that accurate spectroscopic analyses were required to provide a confirmation of its period; they were carried out by Uthas (2011) who confirmed the value Porb = 0.076 d. The fact that the mass loss rate is higher than expected
is well represented in figure 2.2, which shows the possible mass loss rates as function of the orbital period derived from population synthesis studies, and the position of T Pyx on such a diagram. Although the reliability of the theoretical models for the mass transfer rate is still questionable, the peculiarity of T Pyx is evident.
Another striking feature of T Pyx is the long duration of its outburst observed in the optical phase, quantified by t3 = 62 d; the three recurrent
novae with orbital periods shorter than 1 day have values of t3 significantly
higher than all the other ones. This is particularly puzzling when considering that the mass of the ejecta of T Pyx is low. One of the aims of this thesis is to provide a simple model which explains how mass transfer from the companion of T Pyx during the outburst can cause an extended phase of visual brightness, and why this effect is favoured in short period, high ˙M systems.
2.2
The Expansion of the Envelope
The envelope ejected by the white dwarf at the eruption expands ballistically and passes through different states of temperature and ionization. Although the evolution of the envelope is most important for the understanding of the spectrum of the nova and the scenario I’m going to present is mostly based on spectroscopic evidence, while my focus is on the photometric aspects of the problem, it is necessary to briefly review its qualitative behaviour in order to understand what’s happening in the surroundings of the erupting system.
The structure of the ejecta of classical novae and their evolution are dis-cussed in Hauschildt (2008), Jos´e & Shore (2008) and Shore (2008), with particular focus on spectroscopic matters. An interesting view of the prob-lem from the photometric point of view is discussed in Shore et al. (1994) and presented here in section 2.2.2. A recent and detailed discussion of the spectroscopic evolution of novae is given by Shore (2012).
20 CHAPTER 2. THE SLOW DECLINE OF T PYX
Figure 2.2: Accretion rates of cataclysmic variables plotted as function of their orbital periods, with the position of T Pyxidis marked by the asterisk. The scarcity of systems with P . 3 h is an indication of the period gap (see section 1.3.4). The figure is from Uthas (2011); the original diagram, without the mark at the position of T Pyx, is from the population synthesis study of cataclysmic variables by Howell et al. (2001).
2.2.1 Stages of Spectral Evolution
The expansion of the ejected shell is usually divided in three distinct phases, denoted as stages of spectral evolution because they are easily recognized by the different spectroscopic properties.
The fireball stage is realized in the first few hours or days after the outburst, when the envelope has just left the white dwarf and its temperature
2.2. THE EXPANSION OF THE ENVELOPE 21
Figure 2.3: Model spectra obtained superposing an increasing number of ab-sorption lines of ions present in nova envelopes over a flat spectrum. Figure from Hauschildt (2008).
can be as high as several 105 K. The envelope is ionized and optically thick both in the lines and in the continuum.
The iron curtain stage is realized when the envelope has cooled down so that most of its emission is in the optical. A significant fraction of the particles have recombined and the shell is still optically thick. This stage is denoted as iron curtain because the shape of the spectrum in the ultraviolet is mainly due to the many absorption lines of the various Fe ionization species (line blanketing). The apparent emission lines in the spectrum are actually at the wavelengths at which the absorption lines of the Fe ions are less effective. Figure 2.3 shows the effect of the absorption lines on the nova spectrum.
The nebular stage is realized when the density in the envelope has dropped down so that the radiation coming from layers closer to the white dwarf was able to ionize it (the number of recombinations per unit volume depends steeply on the density, as ρ2). Due to the ballistic expansion, the material further away from the white dwarf has a lower density and be-comes ionized earlier, so that the photosphere gradually recedes inward as the temperature increases. The maximum in the emission moves from the
22 CHAPTER 2. THE SLOW DECLINE OF T PYX
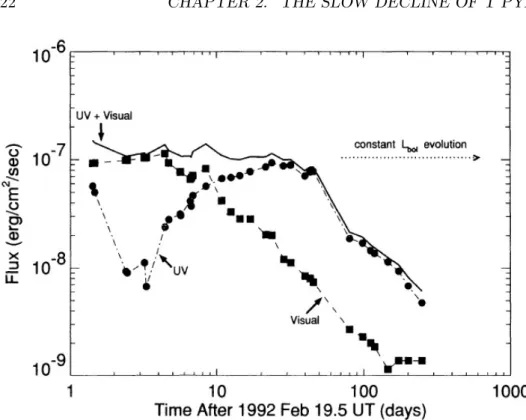
Figure 2.4: Optical, ultraviolet and optical + ultraviolet light curves of Nova Cygni 1992. Adapted from Shore et al. (1994).
optical to the UV and sometimes X-rays part of the spectrum, until the nuc-lear reactions on the surface of the white dwarf turn off and the bolometric luminosity drops.
2.2.2 The Bolometric Evolution of Nova Cygni 1992
Nova Cygni 1992 was one of the brightest novae studied in the recent era, reaching a magnitude in the V band of 4.5 on 2/24/1992. It was one of the best observed systems at the time, with photometric and spectroscopic coverage, in various bands.
The evolution of its visual and ultraviolet light curves, presented by Shore et al. (1994), is presented here as a demonstration of several features described in chapters 1 and 2 of this thesis. Figure 2.4 shows the visual and UV light curves for the first 200 days after outburst. The first observations showed a significant UV flux corresponding to the end of the fireball stage described in section 2.2.1. The UV flux then dropped as the ejecta cooled down and expanded, while the visual flux slightly increased. As the photo-sphere moved towards higher temperature layers, the UV flux then rose and eventually overcame the visual flux.
erup-2.3. X-RAYS EMISSION 23
tion were past, making this a very fast nova, the visual + UV curve is approximately constant for about 40 days; the observation of Nova Cygni 1992 was in fact the first time that a nova had enough coverage to claim that the hypothesis of constant bolometric luminosity was correct. As the visual + UV light curve was declining, a rise in the energy emitted in the X-rays part of the spectrum was observed (not shown in figure 2.4), and its analysis suggested that the phase of constant bolometric luminosity might have lasted for more than 6 months.
The X-rays observations 5 months after the outburst, along with a black-body approximation, allowed to estimate an effective temperature at the photosphere Tef f & 3 · 105 K, which is lower, although of the same order,
than the temperature corresponding to the Eddington luminosity for the white dwarf (estimated as ∼ 7 · 105 K for a 1 M
white dwarf at
equilib-rium; see the discussion in section 3.6.1), therefore suggesting an inflated radius of the remnant.
2.3
X-Rays Emission
A first qualitative suggestion that T Pyx, IM Nor and CI Aql have features in common with systems with a much lower optical decline timescale, possibly including low mass ejecta, derives from their X-rays emissions.
Some novae, including T Pyx, IM Nor, CI Aql and other recurrents, show an extended, strong soft X-rays emission after the outburst which is thought to originate from the nuclear reactions at the white dwarf surface, with photon energy Epeak < 1 keV and a UV/X-rays spectrum that resembles
a blackbody distribution only at low resolution (see Orio et al. (2001) and Schwarz et al. (2011)). This point in novae evolution is called the SSS phase because of the similarities between novae with this behaviour and the class of Super Soft X-rays binary Sources (SSSs).
The fraction of novae showing an SSS phase is difficult to determine because the moment of turn-on and the duration of this phase depends on the particular system and the nuclear burning may last from a few months to a few years, so that giving enough coverage for each system to be investigated is difficult. The analysis by Orio et al. (2001) resulted in a detection rate of about 20%, but this is now known to be an underestimate of the fraction of systems with a SSS phase as the more recent analyses by Schwarz et al. (2011), conducted with the data of the multi-wavelength space observatory Swift collected through five years of observations, resulted in the significantly higher detection rate of ∼ 45%.
2.3.1 The X-Rays Emission from the White Dwarf Surface
The scenario presented here and described in the introduction of the art-icle by Orio et al. (2001) suggests a correlation between a long soft X-rays
24 CHAPTER 2. THE SLOW DECLINE OF T PYX
emission phase and an high-mass ejecta.
The mechanisms producing soft X-rays emission from the white dwarf in a nova system is the continued hydrogen burning in the outer layer of the star, provided part of the material accreted from the companion hasn’t been ejected in the eruption. The X-rays emission is initially shielded by the optically thick envelope, and the white dwarf will be observed as an X-rays soft source only if the duration of the hydrogen burning is longer than the time it takes for the photosphere to be sufficiently close to the erupting surface, so that the temperature at the photosphere is sufficiently high to radiate soft X-rays. This duration is proportional to the envelope mass which was left on the white dwarf after the ejection.
The mass of the accreted envelope at ignition depends mainly (although not only) on the mass of the white dwarf, since the pressure for the ignition at the base of this layer depends weakly on the system parameters, the order of magnitude of the critical pressure being Pcrit ∼ 1020 dyn cm−2,
and it’s related to the accreted mass by equation 1.9 (see section 1.3.5). Neglecting the mixing between the mass accreted between two consecutive outbursts and the white dwarf material, and assuming that the same fraction β of the accreted material is ejected in each nova event, the remaining fuel Mf uel = (1 − β)Mcrit is proportional to the ejected mass Mej = βMcrit, so
that a long duration of the X-rays phase corresponds to massive ejecta. However, the X-rays emission can hardly be considered a reliable dia-gnostic measure for the ejected mass. In fact, the previous argument is only correct when neglecting the mixing between the accreted material and the white dwarf atoms at quiescence and at the onset of the thermonuclear runaway. This is certainly an approximation as there are cases in which some degree of mixing is clearly detected from the abundances in the ejecta (see Gehrz (2008); a recent example is the classical nova Nova Mon 2012, in which the white dwarf is of the oxygen-neon type and an overabundance of neon in the ejecta has been spectroscopically confirmed (Shore et al., 2013)). Unfortunately, there is no estimate for the amount of mass originally from the white dwarf which is expelled with the ejecta, and the theoretical mod-els including mixing mechanisms at the core-envelope interface are still far away from being able to simulate a whole nova-cycle, including both the quiescent phase and the outburst (see Jos´e et al. (2013) and Casanova et al. (2010)).
Furthermore, a more careful analysis should include that the value of β varies on a case-by-case basis and knowledge of its dependence on the system parameters requires thorough fluid dynamics simulations of the onset of the nuclear reactions and the expulsion of the ejecta, so that the scenario presented here is a significantly simplified view of the real problem.
A correlation between the mass of the ejecta and the duration of the X-rays phase is difficult to discuss observationally because only for a limited sample of novae the mass of the ejecta and the X-rays phase duration are
2.3. X-RAYS EMISSION 25
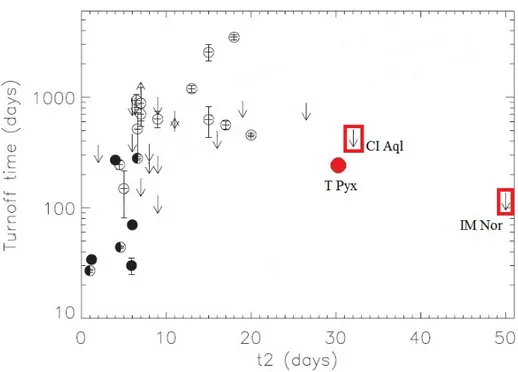
known with sufficient accuracy. This issue was discussed by Greiner et al. (2003) and Schwarz et al. (2011) who looked for a correlation between the duration of the SSS phase and the velocity of the ejecta, as shown in figure 2.5. This is relevant because the velocity is negatively correlated with the mass of the ejecta, since a low mass ejecta is easier to accelerate to high speed, and much easier to estimate by spectroscopic means than the mass of the ejecta itself. Greiner et al. (2003) claimed to have found a correlation between the duration of the SSS phase and the ejecta velocity but their ana-lysis was based on a sample of just 8 systems for which data were available (and just 4 of them had well-constrained values on the duration of the SSS phase) and considerable scatter was present. The more thorough analysis by Schwarz et al. (2011) still shows the correlation but the scatter is not reduced, demonstrating that its origin is due to the physics of the systems, not to the low amount of data points. See section 2.3.2 for the discussion on the position of T Pyxidis in the figure.
A direct correlation between the mass of the ejecta and the duration of the SSS phase was investigated by Greiner et al. (2003) for a small sample of novae for which constraints on the X-rays emission were available; however, instead of using the measured mass of the ejecta, their analysis was based on the decline timescale t2 which allows, by means of a relation by Della Valle
et al. (2002) (see section 2.5 and equation 2.3) to estimate Mej. Therefore
their analysis is actually an investigation of a relation between t2 and the
duration of the SSS phase. A similar study, with more available data, was also conducted by Schwarz et al. (2011) and is shown here in figure 2.6. Although some correlation is evident, the scatter is significant even without considering the three anomalous recurrent novae T Pyx, IM Nor and CI Aql, and a unique dependence of the turnoff time on the decline timescale t2 would be a poor approximation of a much more complex situation.
2.3.2 X-Rays Emission from T Pyx, IM Nor and CI Aql
The recurrent nova T Pyxidis has been thoroughly studied with the Swift facility (De Gennaro Aquino et al., 2013). The dimensionless soft X-rays (in the spectrum range 0.3 keV < E < 1 keV) light curve is shown in figure 2.7. De Gennaro Aquino et al. (2013) suggest that the turn-on and peak of the SSS phase may have been missed because of absorption of the X-rays by the ejecta, but the ending of the SSS phase has been detected.
An estimate for the turnoff time of T Pyx is between days 200 and 300 after the outburst as determined from the light curve in figure 2.7. This, together with t2 ∼ 30 d (see figure 2.1; in most of the discussions in this
thesis, t3 is used instead of t2 for T Pyx because the significant oscillations
in the lightcurve, whose amplitude is of order 1 mag, make it a more reliable description of the decline timescale), provides the approximate position of T Pyx in the diagram of figure 2.6. The upper bounds for the turnoff times
26 CHAPTER 2. THE SLOW DECLINE OF T PYX
Figure 2.5: Correlation between the velocity of the ejecta and the duration of the SSS phase. The x-axis shows the FWHM velocity of the Hα and Hβ spectral lines near visual maximum, which is an indication of the ejecta velocity easily derived from spectroscopic analyses. The y-axis gives the time at which the ratio of soft over hard emission drops below a certain threshold and is an indication of the turnoff time of the nuclear reactions at the white dwarf surface. Filled circles are known recurrent novae. Half filled circles are suspected recurrent novae based on their characteristics. The arrows indicate upper (pointing down) and lower (pointing up) boundaries. The dashed line shows the fit by Greiner et al. (2003) based on a subset of the reported data. Adapted from Schwarz et al. (2011).
of the other recurrent novae IM Nor and CI Aql were already in the data by Schwarz et al. (2011) and have been highlighted in figure 2.6.
Although several data points in figure 2.6 show considerable deviation from any possible fitting relation, the recurrent novae T Pyx, IM Nor and CI Aql look evidently misplaced in the diagram, with turnoff times char-acteristic of novae with much shorter decline timescales like all the other recurrent novae.
The approximate position of T Pyx has also been marked in the velocity of the ejecta - turnoff time diagram of figure 2.5. The velocity of the ejecta of T Pyx can be estimated as ∼ 4 · 103 km/s from the width of the emission lines in the ejecta (see e.g. De Gennaro Aquino et al. (2013), figure 15). T
2.4. THE MASS OF THE EJECTA OF T PYX 27
Figure 2.6: Correlation between the decline timescale t2and the turnoff time.
Although some sort of trend is evident, the scatter around any possible fit is certainly high. Filled circles are known recurrent novae. Half filled circles are suspected recurrent novae based on their characteristics. The arrows indicate upper (pointing down) and lower (pointing up) boundaries. The approximate position of T Pyx is depicted as a red circle, showing its peculiar behaviour. The upper boundaries for CI Aql and IM Nor, already included in the analysis by Schwarz et al. (2011), have been highlighted. Figure adapted from Schwarz et al. (2011).
Pyx is close to the other recurrent novae in figure 2.5, so that its anomalous behaviour is limited to the optical lightcurve decline timescale and doesn’t appear in the SSS phase duration and velocity of the ejecta.
2.4
The Mass of the Ejecta of T Pyx
It is generally accepted that the precise determination of the mass of a nova ejecta is very difficult to achieve. Nonetheless, there are now sufficient, independent indications that the mass of the ejecta of T Pyx is low.
28 CHAPTER 2. THE SLOW DECLINE OF T PYX
Figure 2.7: Dimensionless X-ray lightcurve of T Pyx from the X-ray Tele-scope of Swift in the energy range 0.3 keV< E < 1 keV. Courtesy of I. De Gennaro Aquino.
2.4.1 Mass of the Ejecta of Recurrent Novae
From a theoretical point of view, the masses of the ejecta of recurrent novae are expected to be lower than those of classical novae (see Jos´e et al. (2013)). Schaefer et al. (2010) present the following estimate, obtained neglecting the mixing between the accreted material and the outer layers of the white dwarf and suggesting that in this case the amount of ejected material is limited to that accreted between two consecutive outbursts. Accepting a recurrence time trec . 102yr and a mass transfer rate ˙M . 10−7M , which
are significantly high estimates both for trec and ˙M for any recurrent nova,
gives Mej . 10−5 M . For T Pyx, the time passed since the last eruption is
∼ 40 yr (see table 1.1) while the mass accretion rate is estimated as & 10−8
M yr−1, resulting in the accretion of order 10−6 M .
However, the assumption that no dredge-up occurs is certainly question-able. As discussed in section 2.3.1, in some cases it can be inferred from the spectroscopically determined abundances that some of the material ori-ginally from the white dwarf is ejected, but an estimate of its mass is still unavailable.
Still neglecting the mixing at the core-envelope interface, another crude approximation for the mass of the ejecta can be obtained by assuming Mej
to be of the same order of the mass Mcrit necessary for triggering the nova
eruption according to the theoretical models or the simplified view of equa-tion 1.9. The fact that the nova is recurrent implies that the white dwarf mass MW D is high and Mcrit is low. Schaefer et al. (2010) give the
estim-ate of Mej ∼ Mcrit ∼ 2 · 10−6 M based on the range of values for the
white dwarf mass of the recurrent system 1.25 M < MW D < 1.3 M
de-rived from inspection of the theoretical models by Yaron et al. (2005) best corresponding to the observed properties of T Pyx.
2.4. THE MASS OF THE EJECTA OF T PYX 29
2.4.2 Estimates of Mej Based on the Previous Eruptions
The mass of the ejecta of T Pyx wasn’t well known before the 2011 eruption. Several estimates were given by Selvelli et al. (2008), all placing Mej in
the 10−5 ÷ 10−4 M range. Their estimates were critically reviewed by
Schaefer et al. (2010) who highlighted the questionable assumptions in their derivations.
The estimates by Selvelli et al. (2008), who acknowledge the problem derived by the large spread between this value and the mass of the accreted material between two consecutive outbursts, are based on several relations proposed for the correlation between the mass of the ejecta and the ob-servable parameters of a nova eruption, including the decline timescale t2,
measured from the light curve, and the velocity of the ejecta, measured from spectroscopy. Selvelli et al. (2008) are therefore making use of the Mej− t2
correlation which I argue to be inapplicable to T Pyx. One of such relations is included in this thesis as equation 2.3 and discussed in section 2.5.
The structure of the ejecta of the eruptions of T Pyx up to 1966 was studied by means of CCD images by Shara et al. (1989), Shara et al. (1997) and Schaefer et al. (2010), which revealed about two thousands well dis-tinguished knots around T Pyx presumably related to its various eruptions. Comparing images obtained with the Hubble Space Telescope (HST) in 1994 and 1995 with images obtained in 2007, Schaefer et al. (2010) measured ex-pansion velocities in the interval 500 km s−1 ÷ 715 km s−1 and, tracing backward in time the motion of the knots, derived that they must have been ejected close to the year 1866 in an eruption which is not in any known observation report.
The brightness of the knots at the Lyman α wavelength is related to their electron number density and this allowed Schaefer et al. (2010) to obtain an order of magnitude estimate for the mass of the ejecta of ∼ 104.5 M . This suggests that the 1866 outburst must have been significantly
different than the subsequent eruptions as its ejected mass is more than an order of magnitude higher.
2.4.3 The 2011 Eruption
The mass ejected by T Pyx in the 2011 eruption was determined by Shore et al. (2013) as Mej ∼ 2 · 10−6 M by means of spectroscopic methods
applied on data collected during the optically thin phase.
The spectroscopic analysis determines the electron temperature and num-ber density and is based on the ratios of line fluxes sensitive to these para-meters (such as several [O III] and [N II] lines); see chapter 5 of Osterbrock & Ferland (2006) for a thorough treatment of temperature measurements from emission lines. A detailed treatment of the procedures used by Shore et al. (2013) is outside the scope of this thesis.