Brain-behavioural olfactory asymmetries in Apoidea
PhD Student: Elisa Rigosi
Advisor: prof. Giorgio Vallortigara
Co-Advisor: Gianfranco Anfora
Doctoral School in Cognitive and Brain Sciences
XXV Cycle
Center for Mind/Brain Sciences (CIMeC), University of Trento
Dep. Sustainable Agroecosystems and Bioresources, Research and Innovation Center, Fondazione Edmund Mach
“An ecologist from Mars who visited the Earth would observe that in the United States people drive their cars on the right hand side of the road while in the United Kingdom they drive on the left. He would then perhaps make lots of measurements in an attempt to find ecological correlates to explain the adaptive significance of the difference. In fact, driving on the right and driving on the left may just be equally good alternatives for preventing accidents (Dawkins, 1980).”
Table of Contents
Abstract ... 1
CHAPTER 1 GENERAL INTRODUCTION ... 3
1.1 UNDERSTANDING THE BIOLOGICAL RELEVANCE OF BRAIN-BEHAVIOURAL ASYMMETRIES ... 3
1.1.1 Why do brain asymmetries exist? ... 3
1.1.2 Why do brain asymmetries persist aligned in a population? ... 5
1.1.3 The superfamily Apoidea as a model for ESS theory ... 6
1.2. NEURAL CORRELATES OF LATERALIZED BEHAVIOURS ... 7
1.2.1 Are we able to trace behavioural asymmetries back to their morpho-physiological correlates? ... 7
1.2.2 Honeybee as a model for studying brain-behavioural asymmetries ... 9
1.3 THE NEURAL OLFACTORY PATHWAY IN HONEYBEE (A. mellifera) ... 13
1.4 Aims of the thesis ... 15
CHAPTER 2 Left-right asymmetry of olfaction in bumblebee, Bombus terrestris ... 17
Summary ... 17
Introduction ... 17
Materials and Methods ... 19
Results ... 22
Discussion ... 26
CHAPTER 3 Olfactory lateralization and the bee Antennal Lobe: Morphology ... 29
Summary ... 29
3.1 Searching for anatomical correlates of olfactory lateralization in the honeybee antennal lobes:A morphological and behavioural study ... 29
Introduction ... 29
Methods ... 31
Results ... 35
Discussion ... 37
3.2Searching for anatomical correlates of olfactory lateralization in the honeybee antennal lobes:Do olfactory glomerulichange in volume between sides after conditioning? ... 41
Introduction ... 41
Methods ... 43
Results ... 47
Discussion ... 51
CHAPTER 4 Olfactory lateralization and the bee Antennal Lobe: Functional Data ... 56
Summary ... 56
4.1 In-vivo two-photon imaging of the honeybee antennal lobe ... 56
Introduction ... 56
Methods ... 58
Results ... 60
Discussion ... 64
4.2 Asymmetrical odor coding in the honeybee Antennal Lobe ... 67
Introduction ... 67
Methods ... 69
Results ... 72
Discussion ... 79
CHAPTER 5 Left-right antennal asymmetry during honeybees’ social interactions ... 82
Summary ... 82
Introduction ... 82
Methods ... 84
Results ... 86
Discussion ... 88
CHAPTER 6 General Discussion ... 91
Appendix A ... 100
1 Abstract
Lateralization of the nervous system enhances optimization of neural circuitry and parallel processing in individual organisms. Over groups of individuals, brain-behavioural asymmetries might present a direction in the occurrence of the bias (the majority of the individuals showing the same direction at the population level) that has been mathematically demonstrated to be an evolutionarily stable strategy in social groups, thus optimizing coordination and cooperation. The superfamily Apoidea represents a group in which both the study of the appearance of population-level asymmetries and advantages in individual organisms (e.g., in the A. mellifera model) can be exploited. Here I described a study on olfactory lateralization in a primitively eusocial species of Apoidea, B. terrestris. I reported here that this species showed a direction in the behavioural asymmetry of short-term odour memory, but only individual-level differences in odour detection at the periphery of the nervous system. Moreover,
B. terrestris showed a morphological difference at the level of the population in the
number of structures where olfactory neurons are housed.
In the same subfamily Apoidea, the perennial eusocial honeybee, A. mellifera, is a good candidate for assessing neural correlates of odour asymmetries. Lateralization in olfactory memory was reported in this species in the past; here I performed for the first time a study of anatomical and functional asymmetries within the brain, in the first olfactory neuropils, the antennal lobes. I measured a subset of glomeruli in naïve individuals and found symmetrical volumes between the sides for those glomeruli that are mainly activated by odours that show lateralization in behvaiour. Furthermore, I performed single-antenna recall tests, conditioning bees to extend their proboscis (in the so-called PER paradigm) in association with those odours that more strongly activated functional responses in the selected glomerular subset. The behavioural tests showed an odour dependency in the capacity of bees to recall compounds with the two antennae. A broader subset of glomeruli was measured after long-term memory formation and symmetrical volumes were confirmed in all glomerular classes revealing also memory-dependent shrinkage effect. At the functional level, I performed in vivo calcium imaging data of the bee antennal lobes. Odor-evoked activity maps were recorded with two-photon microscopy allowing for better spatial and temporal resolution compared to conventional fluorescence microscopy. A first comparison between sides
2 from wide-field fluorescence microscopy data showed a left/right difference in distance between odour representations and different mixture interactions within each lobe.
In the same social species, A.mellifera, I reported the results of experiments measuring social interactions between pairs of bees with only one antenna in use, revealing that animals tested with only their right antenna in use exhibited better social context-dependent behaviours.
Overall, these results provide new evidence for the occurrence of behavioural lateralizations at the population level, and identify some of their possible anatomical and functional correlates. Finally, in relation to previous studies these results tighten the link between the occurrence of population-level asymmetries and their evolution in a social context.
3 CHAPTER 1 GENERAL INTRODUCTION
Brain asymmetry, or lateralization, is apparent when one side of the brain is structurally different from the other and/or performs a different function (Rogers, 2002). Humans show clear examples of this phenomenon: the left-dominance of the brain during speech production and right-handedness in motor skills, for instance, are the most well known evidence of its occurrence (Toga & Thompson, 2003). How brain asymmetries are widespread among different taxonomic groups has started to be crucial to understand the evolution of this phenomenon and its biological relevance. During the last 40 years hundreds of studies supported the idea that functional brain lateralization is a widespread strategy extended throughout vertebrates (Rogers & Andrew, 2002; Vallortigara et al., 2011; Tommasi, 2009; Ocklenburg and Gunturkun, 2012). Further evidences showed that invertebrate species as well present this trait both in sensory detection and motor performances (reviewed in Frasnelli et al., 2012a and in Rogers et al., 2013).
1.1 UNDERSTANDING THE BIOLOGICAL RELEVANCE OF BRAIN-BEHAVIOURAL ASYMMETRIES
1.1.1 Why do brain asymmetries exist?
Considering brain asymmetry, a crucial point is about their evolutionary explanation in terms of benefits given by single-side specializations of the brain.
The general advantage that could have brought to their evolution might be to optimize neural circuitry increasing its efficiency (see Vallortigara and Rogers, 2005; Vallortigara, 2006). Each side being specialized for a specific task, in fact, might avoid useless duplication of functions with a consequent net gain in the neural network (Levy, 1977; see also Vallortigara & Rogers, 2005). In particular, in order to coordinate and establish neural basis for new complex behaviours, the evolution of one more circuit (parallel factor) might have arisen as a more cost-effective strategy compared to increasing brain size (Mutha et al., 2012). Two examples in support of this theory might reveal how this phenomenon is widespread and biologically relevant. In C. elegans, only individuals with asymmetric expression of chemoreceptors between sides can perceive specific
4 class of compounds and discriminate two different stimuli (Wes and Bargman, 2001). In humans, a correlation between the degree of anatomical asymmetry in parieto-frontal connections and speed in visual detection has been demonstrated (Schotten et al., 2011).
A better performance among lateralized individuals compared to not lateralized ones has been demonstrated also in other cognitive tasks, such as reorientation in a geometric environment (Sovrano et al., 2005), schooling behaviour in fish (Bisazza & Dadda, 2005), thermite fishing in chimpanzees (McGrew et al., 1999), and in memory retrieval in flies (Pascual et al, 2004), supporting the view that asymmetrical biases are linked to fitness advantages. One of the most outstanding evidence of brain asymmetries and behavioural advantages was published in 2004 on invertebrate species. Pascual and others (2004) were able to prove that morphological asymmetry in the brain was correlated with the formation and retrieval of long-term odour memory in
Drosophila melanogaster. Individuals having symmetrical brains, conversely, showed
only short-term memory recall ability, lacking any long-term memory (Pascual et al, 2004).
It has been assumed that lateralization might has arisen as an advantage for processing two tasks at the same time, keeping the two circuits separated, and avoiding functional incompatibility (Vallortigara & Rogers, 2005). It has been shown that having a cerebral asymmetry significantly improve domestic chick efficiency in a double-task test (Rogers et al., 2004). The authors demonstrated that lateralized chicks showed an advantage over non-lateralized ones in discriminating food from pebbles on the ground while performing at the same time detection of (simulated) predators. Additional support for the double-tasking advantage hypothesis comes from a study in marmoset by Piddington and Rogers (2012). These authors demonstrated a correlation between handedness and latency to detect a predator while foraging. Curiously, this advantage disappeared when the groups of lateralized and non-lateralized individuals were compared in predator’s detection alone. Comparable results have been reported on a similar task with the fish G. falcatus: lateralized line of fish showed significant faster velocity at catching shrimps compared to non-lateralized ones only in the presence of predators (Dadda & Bisazza 2005).
Breaking the symmetrical structure in bilateria might be seen as a further step of evolution in the way of division of labour, i.e. compartimentalization without volume increase. Nevertheless, individual efficiency cannot explain the occurrence of a general
5 direction of asymmetries in the evolution of a population; asymmetrical individuals, in fact, might share or not the side of their specialization with other asymmetrical individuals within a population (Vallortigara and Rogers 2005).
1.1.2 Why do brain asymmetries persist aligned in a population?
Population level asymmetries and individual level lateralization can be distinguished on the basis of consistence of the asymmetry in a population. Population-level asymmetry is apparent when more than 50% of the individuals in a population are lateralized in the same direction. Individual-level lateralization is apparent when right/left asymmetries are equally common in a population (Rogers & Andrew, 2002). One of the most intriguing open issues in brain and behaviour asymmetries is the evolution of the directional asymmetries within a species. The above-mentioned advantages of being lateralized can in fact account for individual asymmetries but cannot per se explain the persistence of directional asymmetries. Recently, a mathematical model based on game-theory has been put forward suggesting that population-level asymmetries might have arisen as an evolutionarily stable strategy (ESS) in populations where social traits are apparent (Ghirlanda and Vallortigara, 2004). It could be an advantage for individuals belonging to the same group to have the same direction in asymmetry in order to better cooperate among each other in a context where individual fitness strictly depends on what the rest of the group does (Ghirlanda & Vallortigara, 2004; Ghirlanda et al., 2009 and see Vallortigara, 2006 for a review).
According to this hypothesis, therefore, lateralization in behaviour should be more likely to occur in populations with at least some degree of social interactions. Bisazza and others (2000) provided evidence for this studying teleost fish, and showing that the most social and gregarious species of fishes showed population-level biases in the right/left detour behaviour, whereas solitary species showed individual-level lateralization. Moreover, a better performance in schooling behaviour (both in cohesion and alignment) has been demonstrated in lateralized lines of fish over non-lateralized ones, demonstrating a correlation between lateralization and cooperation (Bisazza & Dadda, 2005). Other studies have linked population level asymmetries with high degree of cooperation. For instance, the stronger is the visual lateralization in chicks at the level of the population, the more stable is the group cohesion in terms of social hierarchies (Rogers & Workman 1989). Very recently, Abrams and Panaggio (2012) confirmed the
6 ESS model evaluating the persistence of handedness polymorphism in relation to the balance between cooperation and competition in human sports.
Numerous examples of correlation between alignment of asymmetry and sociality have been reported also among invertebrates (reviewed in Frasnelli et al., 2012a). In the sub-social species Periplaneta americana, for instance, a population level bias in turning right in a Y tube olfactometer has been revealed (Cooper et al., 2010). Within the order of Hymenoptera, ants L. niger have shown a population bias in choosing the path during foraging (Heuts et al., 2003) and in the highly social ant F.rufa a right dominance in the antennal contact during throphallaxis has been demonstrated (Frasnelli et al., 2012b). Indeed, the study of invertebrate species might be of special advantage for studying brain-behavioural asymmetries. In particular, species with complex social traits such as Hymenoptera may provide key insights for linking sociality with aligned asymmetries.
1.1.3 The superfamily Apoidea as a model for ESS theory
Comparing strictly related species of bees (Superfam. Apoidea) with different levels of intraspecific social interactions may provide important evidence in order to evaluate the hypothesis that population-level asymmetries are more likely to occur among social species. Anfora et al. (2010) recently reported that two different species of bees, Apis mellifera, the most sophisticated eusocial species, and Osmia cornuta, a solitary species, showed different olfactory asymmetry behaviours. The eusocial species appeared to be lateralized at the population level, whereas the solitary species appeared to be lateralized only at the individual level. The reported study is of particular interest because the authors tested species that are evolutionarily strictly related and whose sociality is a significant trait for mapping their phylogeny (Cardinal & Danforth, 2011). Considering this, it could be even more interesting to investigate population-level asymmetries considering all the tribes of the so-called corbiculate bees, species belonging to the subfamily of Apinae. The subfamily Apinae is particularly interesting to study in relation to evolution of asymmetries linked with social behaviours. It is represented by four tribes whose phylogeny is still controversial (Noll 2002; Cardinal & Danforth, 2011): i) the eusocial Meliponini (stingless bees), ii) the eusocial Apini (honey bees); iii) the primitively eusocial Bombini (bumble bees) and iv) the mostly solitary Euglossini (orchid bees). Furthermore they have the advantage to preserve their social
7 features during ontogeny (Michener, 2000). It would be crucial to elucidate whether or not these species showed to be lateralized, at which level and in what specific behaviours (whose sociality might or might not be a necessary trait).
Very recently, a population-level lateralization has been revealed in the eusocial Meliponini species (Frasnelli et al., 2011) providing evidence for the mathematical model of evolution on population level asymmetries in Apinae. It would be worthwhile, though, to explore lateralization in all different tribes characterized by completely different social behaviours. Bumblebees, Bombusterrestris L. (Hymenoptera: Apidae), for instance, exhibit primitive eusocial behaviour as they have an annual cycle with single queens founding new annual nests. Therefore, they can represent one of the last evolutionary steps in the taxonomic group of Hymenoptera towards the complete development of eusociality (Michener, 1974; Goulson, 2003).
1.2. NEURAL CORRELATES OF LATERALIZED BEHAVIOURS
1.2.1 Are we able to trace behavioural asymmetries back to their morpho-physiological correlates?
A further crucial point in studying behavioural asymmetries is to disentangle their neurophysiological correlates. One of the most challenging issues in this field, in fact, is being able to trace specific maps of on how asymmetries are encoded within neural circuits. Once again, invertebrates with their relatively simple (in terms of cell number and circuitry) and - in some cases - well-known nervous systems are becoming the most suitable models to address this question. The nematode C. elegans, has been for years an outstanding model to understand functional asymmetries, their neural architectures and genetic development (Hobert et al., 2002). It has been shown, for instance, that olfactory specializations between sides are specifically triggered by a different expression of G-protein coupled-receptors in two symmetrically head neurons, whose specialization is randomly distributed between left/right neurons in the population. C. elegans showed also a functional lateralization in taste receptors between left/right neurons that in this case brings about a lateralized gustatory perception invariant inside a population (Horbert et al., 2002). Recently it has been
8 shown how this gustatory lateralization is genetically regulated during development throughout a lateralized pattern of gene activations, as well as a difference in neuron volumes between sides (Goldsmith et al., 2010). It has to be noted how the same functional lateralization can be genetically established through differences in the expression of taste receptors and in voltage-dependent signal transductions (deriving from differences in cell size).
Another well-established invertebrate model, Drosophila melanogaster, has been recently exploited to study left-right brain behavioural asymmetries, both in odour coding and in olfactory driven behaviours, but the mechanisms and the neural correlates are far from being understood. In 1988, A lateralization in odour coding was demonstrated in the D. melanogaster brain for the first time in 1988, by the finding that avoiding odours elicited higher responses on the right antennal lobe while attractive odorants where mainly encoded on the left olfactory neuropile (Rodrigues, 1988). On the other hand, though flies required bilateral olfactory inputs to orient their flight up to an odour plume, the left/right antenna triggered behaviours are not equivalent. Duistermars and colleagues (2009) in fact, showed that odour information coming from the left antenna contributed significantly more than the right one in steering D. melanogaster towards an odour (Duistermars et al., 2009).
Recently, Jozet-Alves and co-authours were able to demonstrate an interesting correlation in the strength of turning left and increasing volumes of the contralateral optic lobe in single individuals of Sepia oficinalis (Jozet-Alves et al., 2012).
Other remarkable examples of asymmetries in sensory detection among invertebrates are apparent even though no direct evidence of anatomical differences in the neural system has been provided so far. Octopus vulgaris shows a lateralization in the eye preferred to watch a stimulus outside the tank (Byrne et al., 2002). Naïve individuals of the common American cockroach, Periplaneta americana, displayed a right-bias in turning behaviour in a Y tube olfactometer that is dependent on the amount of antennal peripheral detection (Cooper et al., 2010).
Nonetheless, though we hypothesised (e.g. as shown in C. elegans) how neural asymmetries might optimize sensory detection, the neurophysiological background of functional asymmetries in complex behaviours such as learning and memory is far from being unravelled. Unfortunately, few studies on functional asymmetries were able to show unilateral central pathways involved in lateralized complex behaviours and their mechanisms. The afore-mentioned work by Pascual and colleagues (2004) is one of
9 these. Long-term memory retrieval was in fact impaired in those organisms that did not exhibit the presence of the asymmetrical body, a spherical structure expressing the neural protein fasciclin II (Pascual et al., 2004). Similarly, the terrestrial slug Limax showed a typical long-term odour aversion behaviour that is necessarily dependent on the presence of the protocerebrum (PC), the secondary olfactory centre in the slug brain (Kasai et al., 2006); the information stored is lateralized in only the left or right PC with a right/left incidence equally distributed in the population (Matsuo et al., 2010). Moreover, in another mollusc, Helix licorum, it has been shown that aversive learning is related with increased levels of MAP-Kinase in specific neurons on the right side of the brain belonging to the aversion motor pathway (Kharachenko et al., 2010). The expression of this protein is significantly linked with learning behaviour and with the withdrawal performance in presence of the conditioned stimulus and was not observed either in the contralateral neurons or in control individuals that did not undergo to paired associative learning (Kharachenko et al., 2010).
The few examples reported here are the only cases where a direct link between functional asymmetries and a central neurophysiological correlation can be demonstrated. Nonetheless, the occurrence of brain asymmetries in invertebrates (reviewed in Frasnelli et al., 2012a) has stressed how it is widespread among distant taxa and has raised the possibility to in dept investigation of its neuro-physiological correlates.
For this reason comparative studies throughout all steps of a functional lateralized sensory pathway in a “well-known” animal model are needed. Honeybee, Apis mellifera L. (Hymenoptera: Apidae) might be the key species for addressing this aim.
1.2.2 Honeybee as a model for studying brain-behavioural asymmetries
With less than one million neurons, but exploiting a complex repertoire of behaviours in term of learning and memory processes, honeybee has been considered for decades a model for studying coding, integration and output elaboration along the olfactory and visual pathways (see for review see Menzel, 2001; Giurfa, 2007). Moreover, the accessibility of the nervous system together with the possibility to reproduce pattern of behaviours in laboratory conditions, through appetitive training, showcase their importance and advantages as a model. Bees, in fact, can be trained to extend their proboscis when a specific odour is presented in association to a sugar
10 reward. This is the so-called proboscis extension reflex paradigm (PER, Bittermann et
al., 1983) that can be easily exploited to study classical conditioning. When an odour is
presented immediately before a sugar reward, bees can associate the stimuli being able to extend the proboscis when the odour alone is presented in a test phase. Taking advantage of this paradigm, several studies have been conducted in the last decades that have shed light on the critical issue of learning behaviours and their neural, cellular and molecular mechanisms (reviewed in Matsumoto et al., 2012). In honeybee, in fact, multiple training trials separate by a 7-10 minute inter-trial interval lead to a long-last memory trace inducing protein synthesis and long-term memory formation (see Menzel, 2001).
Using the PER paradigm, Letzkus and colleagues (2006) were able to show for the first time a significant right bias in the bee olfactory learning task (extension of the proboscis with odour presentation alone), in particular, between bees trained with only their left antenna and bees conditioned with only their right antenna in use (the other antenna being covered with a silicon compound). The latter group showed a significant better performance in the memory test than the group of bees with only their left antenna free to perceive odours (Letzkus et al., 2006). Similar results revealing a right dominance in memory task were obtained in visual learning experiments training different groups of bees with only their right or only their left eye in use (Letzkus et al., 2008).
Different studies confirmed the presence of odour asymmetries in this species both when bees were trained with different odour compounds and in more natural context, i.e. when bees were trained with both antenna in use and then tested with lateral (left or right) stimulus presentation without covering the antennae (Anfora et al., 2010; Rogers & Vallortigara, 2008, Frasnelli et al., 2010a).
Letzkus et al. (2006) investigated where this asymmetry may possibly take place along the olfactory processing route, showing that at the level of the antennae there was a significant difference in the number of sensilla placodea, the more abundant structures over the antennae where olfactory receptors neurons are housed. To extend the investigation further, Frasnelli and co-authors analysed all olfactory sensilla classes on a larger sample and were able to confirm a consistent morphological asymmetry favouring the right antenna (Frasnelli et al., 2010a). Remarkably, the asymmetry in the morphology at the peripheral level does not per se allow answering whether asymmetries are apparent in olfactory detection, i.e. at the peripheral level. It has been
11 shown, in fact, that in each sensilla the number of olfactory receptor neurons is highly variant. Kelber and colleagues demonstrated that neurons in sensilla placodea can range from 7 to 23 and they project to different units, the so called glomeruli, in the first olfactory neuropil of the brain, the antennal lobe (AL) (Kelber et al. 2006). This non-linear relation between the sensilla and the olfactory neurons, suggests that the single
sensillum type is far from standing for the representation of an odour code. The
functional units of the olfactory system, in fact, seem to be the glomeruli of the AL that receive synapses from the olfactory neurons that are activated through the same odorant class along the antenna (Galizia and Szyszka 2008).
In this context, Anfora et al. (2010) further demonstrated a difference in the electroanneographic responses between the antennae in bees with unknown experience. They recorded the sum of olfactory receptors’ activity from right and left antennae and revealed the right antennae to be more sensitive, i.e. showing higher electrophysiological responses (Anfora et al., 2010). This could explain the right dominance in olfactory recall tests, but it has to be pointed out that, again, the activity of the entire antennal nerve might (or might not) hide an independent asymmetrical pattern in the single functional units, i.e. the first olfactory code that is primarily formed in the antennal lobes. For these reasons a study on differences between the sides of central olfactory neuropils could be worthwhile.
It is also apparent that difference in odour detection cannot be the only source of behavioural asymmetries in honeybees. In 2008, in fact, it has been showed that when bees were conditioned with both antennae in use, long-term olfactory memory (from 6h to 24h after training) was better recalled through the left antenna (Rogers and Vallortigara 2008). Considering the right antenna being specialized for short-term memory task (Rogers and Vallortigara, 2008; Frasnelli et al., 2010a; Anfora et al., 2010) and the left one for long-term odour memory, a shift of memory specialization has been hypothesized. This observed shift in time enhances the needs to investigate where and when olfactory asymmetries take place in the honeybee brain. Untill now, only a study by Biswas et al. (2010) has pointed out a difference between sides at the central level in honeybees, in particular, on the expression of neuroligin 1 (NLG1), a protein related with memory formation. 24 hs after amputation of one antenna, in fact, Neuroligin 1 appeared differently expressed in only left/only right antenna bees, with bees with only their left antenna showing a decreased expression of NLG1 (Biswas et al. 2010).
12 Considering the studies described so far, honeybee might be a promising model both for: a) unravelling central mechanisms of asymmetries and b) looking for advantages they could bring at the individual level and/or at the level of the colony.
As proposed by Rogers and Vallortigara (2008), it might be advantageous for honeybees to have the first incoming information biased toward the right side (primarily involved in short-term olfactory memories), with the left side being specialized for storing long-term olfactory associations. Foraging activities in natural context may represent a good test for this model. Bees show so-called flowerconstancy, the tendency of pollinator to visit the same flower species during foraging trips, even bypassing other valuable nectar sources (Chittka et al., 1999). While the left side might be specialized for this long-term odour association, the right one could be free to perform and establish new associations with new input odorants coming from the complex foraging environment.
13 1.3 THE NEURAL OLFACTORY PATHWAY IN HONEYBEE (A. MELLIFERA)
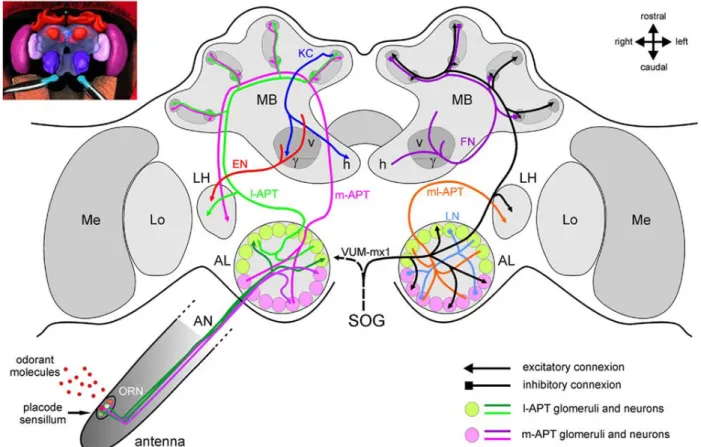
A simplified model of the olfactory pathway in the honeybee, Apis mellifera L. (Hymenoptera: Apidae) is provided in fig.1.1 (from Sandoz 2011).
Figure 1.1 The honeybee brain and the olfactory pathway (from Sandoz 2011). See the text
for a description of the olfactory pathway
At the very periphery, at the level of the antennae, odour stimuli are detected by olfactory receptor neurons (ORNs) housed in olfactory sensilla. Odorant moleculae enter the pores of the sensilla, into the sensilla emolymph where they may be transported via Olfactory Binding Proteins (OBPs) towards the ORNS dendrites where odorants match their equivalent odour receptor proteins (reviewed in Sandoz 2012). Through chemical transduction the activated ORNs’ axons run via the antennal nerves to the first olfactory information processing centres of the insect brain, the antennal lobes (ALs). Right and left AL are bilaterally symmetrical structures formed by ∼160 subunits, so called glomeruli, each supposed to be invaded by onlyone to two specific olfactory receptor classes. Within the AL, the glomeruli arelinked by ∼4000 local
14 interneurons (LNs) that are inhibitory neurons with some acting inside mainly one glomerulus (homo-LNs) and others interconnecting most of the glomeruli (hethero-LNs).
Each odour elicits a specific spatio-temporal pattern of glomerular activation coming from the ORNs potentials (Galizia et al., 1999b). In each glomerular neuropil, the peripheral olfactory signal undergoes subsequent modulation due to LNs and to descending centrifugal neurons from the deuterocerebrum. The final output is a species-specific fine tuned combinatorial coding pattern forwarded by ∼800 projection neurons (PNs) to higher order brain areas (reviewed in Galizia and Szyszka, 2008). PNs forms two main tracts (antenno-cerebralis tracts, APT) the lateral (l-APT) and the medial tract (m-APT) each of them differently innervating the protocerebrum. The l-APT relays its information to the lateral horn and subsequently to the mushroom bodies (MBs, see below), while the m-APT synapses firstly joint the MB and secondly the lateral horn of the protocerebrum.
MBs, the brain structures mainly involved in higher cognitive feats, receive input at the level of the calyces where the Kenyon cells (KCs) dendrites receive PNs output. Differently from the other olfactory centers, in the MBs, the ∼800PNs project diverging into ∼ 170000 KCs. In the MB olfactory information are integrated with other sensory modalities inputs and different classes of MBs neurons (Extrinsic Neurons, EN) project in several parts of the brain either ipsi- and contro-laterally (Rybak and Menzel, 1993), not showed in the figure. The output regions of the MB are the vertical and horizontal lobes, formed by two collaterals of each KC axon. Within the MBs, feedback neurons (FN) project from the pedunculus and lobes back to the calyces, providing inhibitory feedback to the MB input regions. The figure also presents a single identified octopaminergic neuron, VUM-mx1, which was shown to represent reinforcement during appetitive conditioning. This neuron projects from the suboesophageal ganglion (SOG), where it gets gustatory input from sucrose receptors, to the brain and converges with the olfactory pathway in three areas, the AL, the MB calyces, and the LH.
There are reports of few neurons form the MBs projecting back ipsilaterally to the ALs (Kirschner et al., 2006), not showed in the figure.
15 1.4 Aims of the thesis
The experiments presented in the following chapters aim to contribute to better understand the open-questions on brain and behavioural asymmetries previously discussed, using the superfamily Apoidea as a model.
Firstly, we were interested in defining the extent of behavioural lateralization and in providing new evidence for population-level asymmetries in Apoidea. We consequently investigated olfactory asymmetries in an annual-social species, Bombus
terrestris (Chapter 2). We wanted to assess whether any olfactory asymmetry was
present, if it was expressed at the population-level, and in case of a positive answer, to which extent it was apparent, i.e. whether it was strongly correlated with a population bias in odour detection at the level of the antennae. We chose B.terrestris also because the only study showing handedness in a natural environment was conducted in species belonging to the Bombus gender. In particular, a bias for rotation in the same direction (either clockwise or counter-clockwise) was shown during visits to florets in three of the four species of bumblebees investigated (Kells & Goulson, 2001).
Secondly, we wanted to investigate the neural correlates of behavioural asymmetry in Apoidea species, focusing on the Apis mellifera model. We choose the first olfactory integration centre in the honeybee brain, the Antennal Lobe, to look for differences both in morphology and neural coding. As a first morphological approach we wanted to see whether the volumes of glomeruli in naïve bees differ between sides (Chapter 3.1). Considering the significant difference both in number of olfactory sensilla and antennal nerve activation discussed above, we hypothesized a difference in volume of the structural unit of the antennal lobe. Moreover, we also performed a first comparison between sides in glomerular volumes after long-term memory (Chapter 3.2). Our starting point was that long-term memory dependent plasticity in volume has been demonstrated at the level of antennal lobes’ glomeruli (Hourcade et al., 2009). We wondered whether any difference in glomerular size would have been linked with the olfactory memory biases at the behavioural level (Letzkus et al., 2006; Rogers and Vallortigara, 2008).
Furthermore, we wanted to search for differences in the antennal lobe also at the functional level, i.e. in the coding of glomerular activity. We focused on the AL’s final
16 output, i.e. Projection Neurons’ responses to odorants (Chapter 4.1) and we compared them for the first time between sides (Chapter 4.2).
Finally, the last chapter will focus on the possibilities for olfactory asymmetries in bees to be apparent in social interactions between pairs of conspecifics of the same or different hives. We use single-antenna tests to assess the contributions of the left and right antenna during social interactions among dyads of honeybees in an arena (Chapter 5).
17 CHAPTER 2 Left-right asymmetry of olfaction in bumblebee, Bombus terrestris
Summary
Behavioural asymmetries in a population may present a direction (consistency of the same side bias among the majority of the individuals). It has been mathematically shown that this alignment might have evolved in social context. Evidence for this hypothesis has been collected in Hymenoptera: eusocial honeybees showed olfactory lateralization at the population level, whereas solitary mason bees only individual-level olfactory lateralization. In this chapter we investigated the olfactory asymmetry in a primitively eusocial species of Apoidea, Bombus terrestris. We studied single side odour memory tasks and compared odour sensitivities of the antennae both at the physiological and morphological level. Data fit interestingly with the theoretical model of the evolution of population-level asymmetries as bumblebees present a directional lateralization at the behavioural level but only individual-level asymmetry at the periphery.
Introduction
As introduced in Chapter 1, research on anatomical and functional side-related specializations of the brain has mainly focused on vertebrates until now (Rogers and Andrew 2002; Rogers et al., 2013). Nevertheless, evidence of brain and behavioural lateralization in invertebrates have been reported, opening the field to investigations with a wider comparative view (see for a review Frasnelli et al., 2012a). A seminal work in this respect has been the first demonstration of an olfactory asymmetry of memory retrieval in honeybees (Apis mellifera L.) (Letzkus et al., 2006). When conditioned using the proboscis extension reflex paradigm (PER) (Bitterman et al., 1983) with only one antenna in use, bees showed better learning with their right rather than their left antenna. This evidence raised interesting questions about the occurrence of brain-behavioural lateralization. First, it stressed the existence and the advantage of brain asymmetry in relatively small brains (~960000 neurons) compared to vertebrates. Second, considering that bees are a strongly eusocial species, it drew attention to the sociality as a relevant key to explain the shared direction of bias among individuals in a group (Rogers and Vallortigara 2008; Frasnelli et al., 2010a). In natural conditions,
18 asymmetries may, in fact, occur at the population-level when more than 50% of the individuals are lateralized in the same direction, whereas lateralization at the individual level occurs when most of the individuals are lateralized, but left- and right- bias are equally distributed in the population (Rogers and Andrew, 2002). The advantages for an individual of being bound into directional behavioural asymmetries common to the population has been recently reviewed (Vallortigara and Rogers, 2005). Ghirlanda and Vallortigara (2004) showed, using mathematical game theory, that in a prey-predator ecological context, population-level lateralization might represent an evolutionary stable strategy (ESS) driven by social pressures (i.e. cooperative behaviours) (see chapter 1.1.2). A well-fitting example might be the turning behaviour to escape from a predator in shoaling fish species. In a large number of teleost fishes the shoaling species appear to be lateralized at the population level, while the majority of non-shoaling species are lateralized at the individual level (Bisazza et al., 2000).
Studies on closely phylogenetically bee species (Superfam. Apoidea) with different levels of intraspecific social interactions may shed light on the link between population-level asymmetries and cooperative behaviours (see chapter 1.1.3). To date, eusocial honeybees and three species of the eusocial stingless bees have been shown to possess a population-level asymmetry in odour memory recall (Anfora et al., 2012; Frasnelli et al., 2011). On the other hand, the solitary species Osmia cornuta revealed no olfactory asymmetry in odour memory (Anfora et al. 2012). Furthermore, when odour detection at the level of the antenna was investigated, honeybees revealed a population-level bias also in olfactory peripheral responses, while solitary bees displayed only individual-level asymmetries in most individuals (Anfora et al., 2012). These studies support the ESS theory, but additional studies are required to better explore the link between sociality and population-level asymmetries.
Here we studied an annual social species of Apoidea, Bombus terrestris L. (Hymenoptera: Apidae), the bumblebees. This species exhibits primitive eusocial behaviour; its individuals in fact, form relatively smaller colonies with simpler caste-differentation compared to honeybees (Michener 2000; Noll et al., 2002). The nests of
B. terrestris are formed of hundreds of individuals showing size-dependent division of
labour, and these bumblebees have an annual cycle with single queens founding new annual nests (Goulson 2003; Beshers and Fewell, 2001). For these reasons, B.
terrestris might be a crucial species to address how behavioural asymmetries occur
19 backward from the highly eusocial organization of honeybees, but features all what a population might present to evolve directional lateralization within a group. Therefore, we tested olfactory learning in bumblebees with only one antenna in use, exploiting the PER paradigm. In addition, considering that behavioural lateralization in olfactory learning in honeybees has been associated with peripheral anatomical and electrophysiological asymmetries at the peripheral level in the olfactory neural pathway (Letzkus et al., 2006; Anfora et al., 2010; Frasnelli et al., 2010a), we also measured the number of putative olfactory sensilla in the left and the right antennae using scanning electron microscopy, as well as the electrophysiological responses of the two antennae when stimulated by odours behaviourally relevant to bumblebees.
Materials and Methods
Insects
For all the experiments, bumblebee foragers were collected from the same colony of B.
terrestris, supplied by Bioplanet s.c.a., Cesena, Italy. We used female foragers of
similar size (mean body size: 1.7 cm) in order to minimize naturally occurring antennal sensitivity variations (Spaethe et al., 2007).
Test compounds
The test synthetic chemicals were two odours behaviorally relevant to bumblebees: isoamylacetate (Sigma-Aldrich, Milano, Italy; >99.7% purity), a component of their pheromone blends and a floral compound, and (-)-linalool (Sigma-Aldrich, >98.5% purity), a common floral compound (Fonta and Masson, 1984; Laloi et al., 1999).
Behavioural experiments
Behavioural methods made use of the experimental procedures developed in honeybees (Letzkus et al. 2006; Bitterman et al., 1983; Rogers and Vallortigara 2008) and bumblebees (Laloi et al., 1999) for studying olfactory memory retrieval. After 12 hours of food deprivation, bumblebees were cooled in 75 ml containers until immobilized and secured in metal holders. The insects were randomly assigned to three different groups; with the left (N=10), or the right (N=10) antenna coated with a two-component silicon compound (Silagum-Mono, DMG, Germany), or with both antennae uncoated (N=10). Training started one hour after the antennae had been coated. Each
20 animal in its holder was in turn placed in front of an exhaust fan and trained using (-)-linalool, plus 1M sucrose solution (reward) as a positive stimulus (10 µl of (-)-linalool dissolved in 3 ml of the sugar solution). The negative stimulus was an unscented saturated NaCl solution. Three learning trials were given every 6 min. During the first trial, a drop of the positive stimulus solution at the end of a 23 gauge needle was held 1 cm above the antennae, and lowered to touch the antennae after 5 s, which led to PER. The bumblebee was then allowed to ingest the drop of (-)-linalool sugar solution as reward. The procedure was immediately repeated with the saline solution, which did not trigger PER, but rather avoidance by an antennae movement away from the negative stimulus. The same procedure was repeated in the two subsequent trials, with PER usually occurring with no need to touch the antennae.
Odour retention was tested 1 hour after the end of training. Both (-)-linalool, dissolved in distilled water at the same concentration used for training, and saturated salt solution were presented holding a drop of these solutions over the bumblebee’s antennae for 5 s, being careful not to touch them. Each animal was tested in a total of 10 such paired trials, presenting the stimuli in random order and separated by an inter-trial interval of 60 s. Every time the bumblebee extended the proboscis was recorded. The percentage of correct responses was calculated as number of proboscis extensions in response to the (-)-linalool over the total (-)-linalool presentations per animal (no proboscis extensions to the salt solution occurred).
Data were analyzed by analysis of variance (ANOVA) with antenna in use as a between-subjects factor.
Electroantennography (EAG)
Absolute EAG responses (mV) were recorded from right and left isolated antennae of B.
terrestris foragers (N=20) with a standard EAG apparatus (Syntech, Hilversum, The
Netherlands). Animals were anaesthetized, antennae were cut at the level of the scape and the uppermost part of the antennal tip was removed. The base of the antenna was placed inside a glass micropipette filled with Kaissling saline solution (Bjostad 1998) and the tip put into the recording glass micropipette electrode. The order in which antennae were tested was random, and the animal was kept alive until the both antennas had been recorded.
Test synthetic compounds were isoamylacetate and (-)-linalool. For each compound, 25 μl of five decadic steps hexane solutions (ranging from 10-2
21 on 1 cm2 pieces of filter paper, inserted into individual Pasteur pipettes and put into the constant air flow tube directed to the antenna (50 cm3/s). Stimuli of 500 ms were presented in ascending order of dosage with 30 s inter-stimuli intervals, using a stimulus controller (CS-55, Syntech). Control pipettes (loaded with 25μl hexane and an empty pipette) were used before and after each series of stimuli. Data were log transformed to account for the heterogeneity of variances and analyzed by analysis of variance (ANOVA) with antenna, scent and dose as within-subject factors.
Scanning Electron Microscopy (SEM)
Bumblebees (N=14) were cooled till immobility and their left and right antennae were cut at the base of the pedicel. The basal segments of each pair of antennae were attached to a circular stub by double-sided conductive tape (TAAB Laboratories Equipment Ltd. Aldermaston, UK). All samples were gold coated to guarantee electrical conductivity and scanned with a XL 30, Field Emission Environmental Scanning Electron Microscope (FEI-Philips, Eindhoven, The Netherlands). Each antenna was imaged from four different viewpoints: ventral (holder at 0°), right (sample tilted at -75°), left (sample tilted at +75°) and dorsal (after removing antenna from stub and turning it upside down). Because of the lack of olfactory sensilla on the first two segments of the flagellum of B. terrestris, only segments from 3rd to 10th were scanned. Each segment from 3rd to 9th was scanned longitudinally at a magnification of 600 (Figure 2.1a), while a magnification of 800 was used for the 10th segment (apex). For each segment four images were collected according to the different viewpoints.
Both putative olfactory sensilla (i.e. sensilla placodea (Figure 2.1b-c), trichodea type A (Figure 2.1b), coeloconica (Figure 2.1c), and basiconica (Figure 2.1d)), and non-olfactory sensilla, (i.e. sensilla trichodea type B (Figure 2.1b), and ampullacea (Figure 2.1c)), were identified according to their specific morphological characteristics, as described in Frasnelli et al. (2010a) and in Ågren and Halberg (1996). Each type of
sensillum was then tagged and counted on all acquired images by using image analysis
software (UTHSCSA ImageTool Version 3.0). Data were clustered according to the four viewpoints, eight antennal segments, two antennae and six sensillum types. Data were analyzed by analysis of variance with antenna, segment and type of sensilla as within-subjects factors. Each sensillum type was analyzed by analysis of variance (ANOVA) with antenna and segment as within-subjects factors.
22 Figure 2.1. Scanning electron micrographs of Bombus terrestris foragers. (a) ventral view
of a medial segment of the flagellum; (b) details of sensillum trichodeum type A, type B and
sensillum placodeum; (c) details of sensillum coeloconicum, ampullaceum, trichodeum type B
and setae; (d) detail of sensillum basiconicum. Am, sensillum ampullaceum; Ba, sensillum
basiconicum; Co, sensillum coeloconicum; Pl, sensillum placodeum; Se, seta; TA, sensillum trichodeum type A; TB, sensillum trichodeum type B.
Results
Behavioural experiments
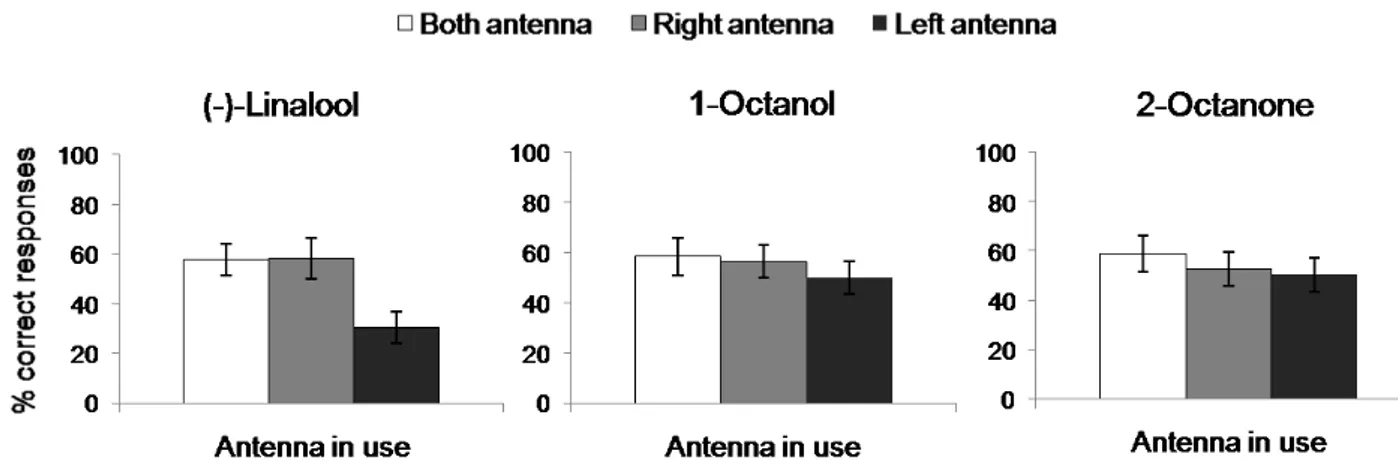
In a first series of experiments, we used a behavioural test to determine whether odour memory retention displayed side asymmetries. To this purpose bumblebees were subdivided in 3 groups, enabled to use only their left (Group1, N=10), their right (Group 2, N=10) or both antennae (group 3, N=10) in both training and test conditions. The results, showed a significant asymmetry, as illustrated in Figure 2.2, where the mean and SE of correct responses are shown for each group. The analysis of variance revealed a significant effect of the antenna in use (F2,27=80.86, p<0.001). Post hoc comparison using Tukey HSD test revealed a significant difference between bees using their right and their left antenna (p<0.001), between bees using their left antenna and those using both antennae (p<0.001) and also between bees using their right antenna and bees using both antennae (p<0.01).
23 Figure 2.2 Behavioural asymmetry during recall in Bombus terrestris foragers, after trained on the proboscis extension reflex. Mean percent correct responses ± SE 1h after
(-)-linalool conditioning with both antennae in use (white bars), right antenna in use only (grey bars), or left antenna in use only (black bars).
Electroantennography (EAG):
To measure any difference in the peripheral detection of odorants, we measured the electroantennographical recordings of the left and right antennae in 20 bumblebees. Each antennae was recorded after stimulation of 5 decadic steps of both (-)-linalool and isoamylacetate. The results of electroantennography are shown in Figure 2.3. The EAG responses elicited by the tested odours were not significantly different between the right and the left antenna (F1,19=2.72, p=0.12). Though not lateralized at the population level, 12 out of 20 individual bumblebees showed significantly stronger responses (estimated by a two-tailed binomial test, p<0.05) either with the right (9 animals) or the left (3 animals) antenna (two-tailed binomial test, p=0.054). The Anova also revealed a significant increase in EAG responses with increasing doses of both tested odours (F4,16=42.52, p<0.001), a significant effect of the type of odours (F1,76=107.61, p<0.001), and a significant interaction between type of odours and dose (F4,76=20.49, p<0.001).
24 Figure 2.3. Mean EAG ± SE absolute responses (mV) of right (unbroken lines with black
squares) and left (dotted lines with empty squares) antenna of Bombus terrestris foragers to isoamyl acetate (left) and (-)-linalool (right) at five different doses (Log10 µg/µl).
Scanning Electron Microscopy (SEM)
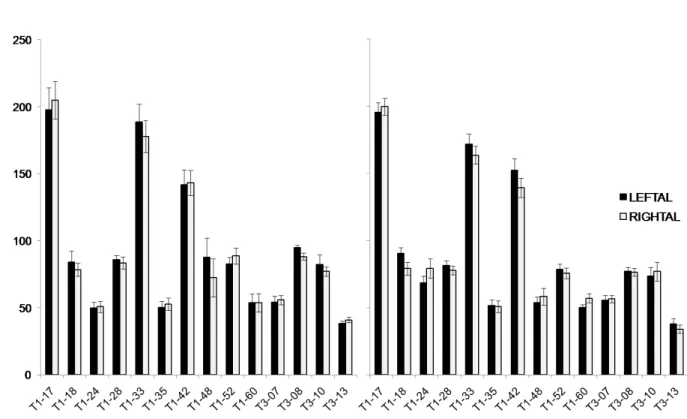
We finally investigated whether any difference in number of olfactory sensilla was apparent between left and right antennae. SEM analysis showed that the overall number of sensilla analyzed was higher on the right than on the left antenna (Figure 2.4; F1,13=22.56, p<0.001). The analysis of variance also revealed significant effect of segment (F7,91=43.2, p<0.001), sensillum type (F5,65=396.40 p<0.001), and antenna per
sensillum type interaction (F5,65=17.89, p<0.001). Separate analyses for each sensillum type revealed a significant right antenna dominance in the number of olfactory sensilla
trichodea type A (F1,13=21.26, p<0.001); no significant antenna effects were found in the number of sensilla basiconica (F1,13=1.47, p=0.247), sensilla coeloconica (F1,13=3.61,
p=0.08), and sensilla placodea (F1,13=0.972, p=0.342). Analyses of non-olfactory
sensilla did not reveal any significant difference between right and left antennae in the
number of sensilla trichodea type B (F1,13=3.45, p=0.086) and sensilla ampullacea (F1,13=0.101, p=0.755).
25 Figure 2.4. Mean number ± SE of sensilla for the right antenna (white bars) and for the left
antenna (grey bars) of Bombus terrestris foragers in function of the segment number. Putative olfactory sensilla: placodea, trichodea type A, basiconica, coeloconica (upper graphs).
26 Discussion
The present results extend previous findings on olfactory asymmetries in hymenopteran insects (Letzkus et al., 2006; Anfora et al., 2010), by showing a right side dominance in short-term recall of olfactory memory in another Apoidea species, B.
terrestris. Bumblebees conditioned to extend their proboscis (PER) revealed better
learning performance when trained with their right rather than their left antenna, with a magnitude comparable to that previously found in A. mellifera (Letzkus et al., 2006; Anfora et al., 2010).
In honeybees, lateralization of olfactory learning is associated with morphological and electrophysiological asymmetries: the number of olfactory sensilla and the electroantennographic responses have been shown to be higher in the right than in the left antenna (Letzkus et al., 2006; Anfora et al., 2010; Frasnelli et al., 2010a). In the present study no significant differences in EAG responses between the right and the left antenna of bumblebees were observed (though there was a trend when considering the number of individuals showing significant lateralization). Since electroantennography records the sum of responses of all olfactory receptor neurons housed in the sensilla of a single antenna, the results obtained using SEM might explain the difference with the data obtained in honeybees. Only one class of bumblebee olfactory sensilla, trichodea type A, exhibited an anatomical asymmetry, being more abundant on the surface of the right antenna than on the left one, and a slight tendency emerged for a second class, i.e. sensilla coeloconica. On the other hand, sensilla placodea, the most common olfactory organs in Apoidea species, did not show any considerable asymmetrical distribution in B. terrestris. This can explain why no overall asymmetry was observed in EAG responses in bumblebees.
Other factors may have also contributed to the species difference, i.e. the number of receptor neurons in each sensillum category and the number of receptor sites in each olfactory neuron, that could be independently associated with the gain or loss of asymmetry in the mechanisms of peripheral perception. The nematode
Caenorhabditis elegans provides a striking example of the multiple factors contribution
of lateralized odour detection in invertebrates. In this species it has been observed that a symmetrical distribution of olfactory sensory neurons hides an asymmetrical pattern on their surface of the G-protein-coupled olfactory receptors responsible for functional odour lateralization (Hobert et al., 2002)
27 Kells and Goulson (Kells and Goulson, 2001) noticed that three species of bumblebees, Bombus lapidarius, Bombus lucorum, and Bombus pascuorum, showed preferences in the directions of circling when they visited florets arranged in circles around a vertical inflorescence. Interestingly, they did not observe any lateralization in
B. terrestris. It could be that lateralization in circling is mainly due to antennal
asymmetries (and not to higher level mechanisms associated with learning and memory recall). Even in honeybees the evidence suggests that peripheral asymmetries in receptors density and EAG antennal responses could not entirely account for asymmetries in memory recall as evinced from PER responses. Rogers and Vallortigara (Rogers and Vallortigara 2008) showed that 1-2 hour after training using both antennae, recall was possible only when the honeybees used their right antenna, but by 6 hours after training the memory could be recalled better when the left antenna is in use. Clearly, asymmetries in receptor density could not account for this time-dependent shift in lateralization associated with memory consolidation (Frasnelli et al., 2010a).
The asymmetry in the olfactory learning behaviour in bumblebees corroborates the hypothesis of a link between high synergistic interactions and direction of lateralized behaviours in a population. Mathematical models of the evolution of population-level asymmetries based on game theory (Ghirlanda and Vallortigara 2004) pointed out that shared directionality in a population might be evolutionary driven by living in a social group, where lateralized individuals have to coordinate their asymmetric behaviours. Ghirlanda et al. (2009) extended the mathematical model examining intraspecific interactions, with antagonistic-synergistic behaviours. They showed that the consistency of direction of asymmetries in a population should arise from the most relevant of the two interactions, in term of fitness contribution. Populations with high-rate of synergistic interactions were shown to be more strongly lateralized in the same direction.
Thus, the involvement of these inter-individual interactions could have been a crucial factor for the evolution of lateralization in the olfactory associative learning also in B. terrestris. With respect to honeybees, the bumblebees annual society represents a less developed system in individuals exchanging information but the communication between colony members play a key role in the nest. As a matter of fact, although lacking trophallaxis, the recruitment of the bumblebee foragers is driven by the olfactory information flow carried by the incoming bees in the honey pots and the inter-individual contacts significantly increase the success of recruitment (Renner and Nieh, 2008)
28 In conclusion, the data described here add to increasing evidence that lateralization of the nervous system at the population level is widespread in invertebrate species. Future studies on other species of bumblebees (Bombus spp.), or other Apoidea species exhibiting by different social or pre-social behaviours, such as gregarism, may provide additional insights to understand how strategic inter-individual interactions in a population have been powerful forces in the evolution of asymmetries.
29 CHAPTER 3 Olfactory lateralization and the bee Antennal Lobe: Morphology
Summary
In this chapter we focus on the honeybee brain to search for anatomical correlates of bee’s olfactory asymmetries. The antennal lobe (AL) is the first olfactory neuropil into the brain; neural fibers coming from the antennae cluster into functional units within the AL, the glomeruli. We specifically reconstructed, measured and compared between sides the volume of a subset of glomeruli in naïve bees and in bees that underwent a training for long-term odour memory formation. In chapter 3.1 we showed symmetry in glomerular morphology in naïve individuals and, conversely, an odour-dependent behavioural asymmetry when odours activating those specific glomeruli were used. Chapter 3.2 revealed a broader symmetry in different classes of glomeruli even after odour learning with a odour- and glomerular-specific plasticity observed after long-term memory.
3.1 Searching for anatomical correlates of olfactory lateralization in the honeybee antennal lobes:
A morphological and behavioural study
Introduction
The honeybee (Apis mellifera L., Hymenoptera: Apidae) has been used for decades as a key model for understanding the neural correlates of sophisticated cognitive skills (see Menzel, 2012 for a review). Olfaction, in particular, represents the most suitable candidate in this species for addressing cognitive issues. The honeybees olfactory pathway is a well-known model of coding, storing, and recalling information (see Chapter 1.3 and see Sandoz, 2011). The first-order olfactory brain areas, the Antennal Lobes (ALs), are located in the deutocerebrum of the honeybee brain. Each AL is ipsi-laterally connected with its antennal nerve thus receiving the neural input from olfactory receptors neurons (ORNs). From ORNs, in fact, olfactory signals are compartmentalized into the highly-organized structures of the ALs, the 165 glomeruli. Here the ORNs’ axons synapse with local interneurons, that contribute in shaping the
30 odour information and transfer this to the ALs output, the Projection Neurons (PNs). Before leaving the first neuropil, each glomerulus processes the signal via a complex network that includes also synaptic integration between LNs, ORNs and PNs (Hansson and Christensen, 1999). The final output (PNs activity), is a fine tuned combinatorial coding pattern and represents a key source for understanding the encoding of olfactory signals. PNs transmit the output of this first olfactory processing towards higher brain areas in the protocerebrum (see Chapter 1.3).
Therefore, within the AL, each glomerulus carries unique information acting as a functional unit in the codification of olfactory information inside the neuropil (Galizia and Menzel, 2001). The size and arrangement of the AL glomeruli is highly species specific so that several anatomical and functional atlases of the honeybee ALs have been created in the past years (Flanagan and Mercer, 1989; Galizia et al., 1999a; Galizia et
al., 1999b; Sachse et al., 1999). They allow individual glomerular identification through
ALs arrangements and the single glomerular role in the ALs odour-evoked response maps.
Experience-dependent changes in the glomerular volume have been shown to take place during the bee’s lifetime and to be highly specific to some glomeruli (Sigg et
al., 1997; Winnington et al., 1996; Brown et al., 2002; Brown et al., 2004). A posterior
glomerulus undergoes, for example, a significant increase in volume with foraging activity (Winnington et al., 1996). The glomerular plasticity is both strongly activity- and age- dependent and can be induced manipulating hives such as inducing precocious foraging in younger bees (Winnington et al., 1996; Brown et al., 2004).
Moreover, a striking volume increase after single odour learning tasks has been recently described (Hourcade et al., 2009). Bees, conditioned to extend their proboscis in response to a particular odour stimulus using the proboscis extension reflex paradigm (PER) (Bitterman et al., 1983), showed significant volume increase of specific glomeruli linked to the positive performance in learning retention tests 3 days after odour training.
The PER paradigm has been widely used as a behavioural learning method over the years, and it has been recently applied to describe a form of lateralization in honeybee olfactory learning. When conditioned using PER, bees showed better learning with only their right rather than only their left antenna in use (Letzkus et al., 2006; Frasnelli et al., 2010a; Anfora et al., 2010). Morphological analyses found a significantly higher number of olfactory sensilla on the right antenna (Letzkus et a., 2006; Frasnelli et
31 explained by morphological asymmetries in the antennae only, for experiments have shown, that after training with both antennae in recall tests 1-2h after conditioning bees performed better with only their right antenna than with only their left antenna in use. But 6h after training the memory had performed a lateral shift, being now better retrieved by the left than by the right antenna (Rogers and Vallortigara, 2008). Possible anatomical asymmetries within the brain have not been systematically investigated so far. A single rough comparison in (Winnington et al., 1996) has not shown any symmetry breaking.
In order to improve our understanding of the olfactory lateralization in honeybees, in this study we precisely measured the volume of specific glomeruli in left and right AL. Considered the difference between left and right antenna in number of olfactory sensilla and electrophysiological responses we might expect a difference in the morphology of olfactory glomeruli between the sides as well. Considering that we chose a subset of readily identifiable glomeruli, we replicated the learning PER paradigm with odours that evoke activity in these specific glomeruli to make sure about their role in behavioural asymmetries.
Methods
Insects
Italian forager honeybees, A. mellifera ligustica Spin., were collected during summer 2009 and 2010 in San Michele all’Adige and Mattarello (Trento, Italy).
Optical Imaging
For the imaging studies of the antennal lobes, bees (N=12) have been prepared in accordance to a well-established protocol (Galizia and Vetter, 2004). After chilling until immobility, insects were placed into custom made imaging stages and held in place using soft melting wax (Kerr, Sybron Dental Specialties). To expose the antennal lobes, a window was cut into the cuticle, and glands and trachea were gently removed. The neural sheath was digested by immersion in a 1% solution of Protease Type XIV (Sigma-Aldrich) for 5 min at ∼40°C. The bee brain was then stained by bath-application of a 50 μM solution of the membrane-selective dye RH795 (Invitrogen) for 3 h. After rinsing with Ringer’s solution, the bees were ready to be imaged.
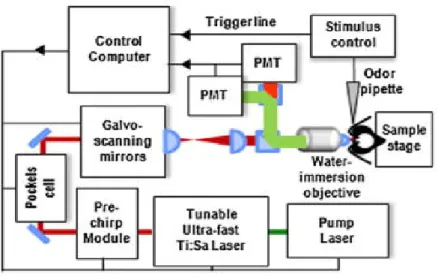
32 Antennal lobes were volumetrically imaged without extracting the brain in order to prevent artefacts due to tissue isolation, fixation, and dehydration (Bucher et al., 2000). This was realised using two-photon microscopy (Denk et al., 1990; Zipfel et al., 2003), which offers enhanced penetration depth and a higher axial resolution than conventional fluorescence microscopy and which was recently demonstrated to allow for whole antennal lobe imaging. In this experiment a two-photon microscope (Ultima IV, Prairie Technologies) was used in combination with an ultra-short pulsed laser (Mai Tai Deep See HP, Spectra-Physics) as excitation source, tuned to the wavelength of 1040nm, corresponding to the maximum of the dye’s two-photon cross section within our tuning range. The beam was focused on the sample with a water immersion objective (Olympus, 40x, NA=0.8), which provides a field of view of approximately 300µm. The system’s resolution was measured to be diffraction limited, resulting in a point spread function of Gaussian width σx,y=230nm transversally and σz=1.1µm axially. The dye’s fluorescence is epicollected by the same objective, separated from the backscattered excitation light with a dichroic beam-splitter, filtered by a 70nm bandpass filter centred at around 525nm (both Chroma Technology), and finally detected by a photomultiplier tube (Hamamatsu Photonics). Average laser powers were around 10mW on the sample.
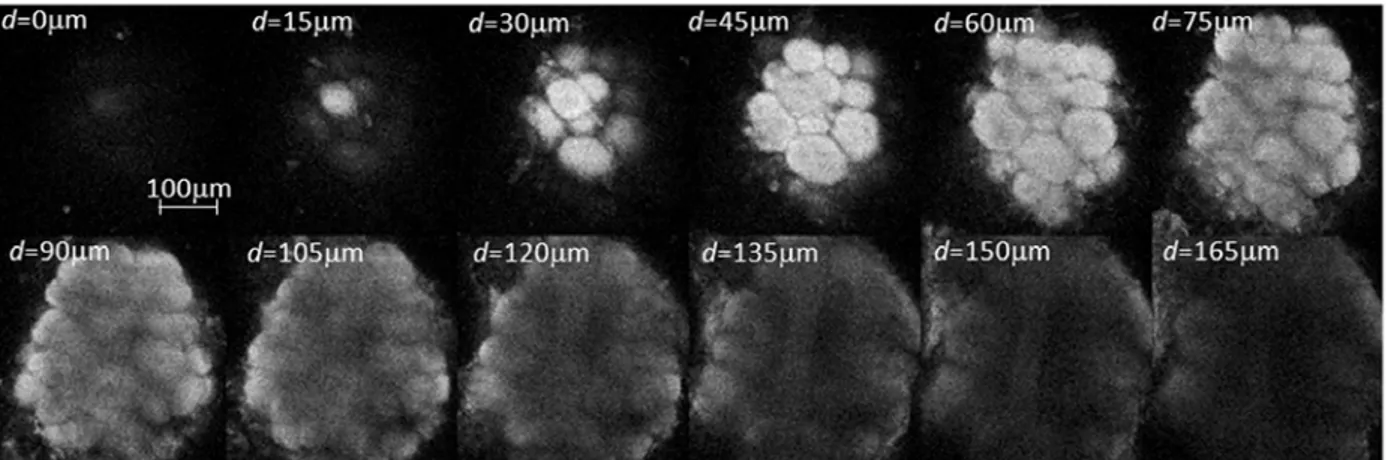
Volumetric measurements were obtained by collecting stacks of AL image slices by varying the focal plane in steps of 3µm along the antero-posterior axis. The imaging depth was mostly limited by the diffusion depth of the bath-applied dye, and was found to be around 150µm (Fig. 3.1.1).
Fig. 3.1.1 Stack of two-photon microscopy images of a left antennal lobe of Apis mellifera
foragers. The tissue is bath-stained with membrane-selective RH795 dye. The field of view of the used 40x objective is 0.3mm. Total imaging depth is 165µm.
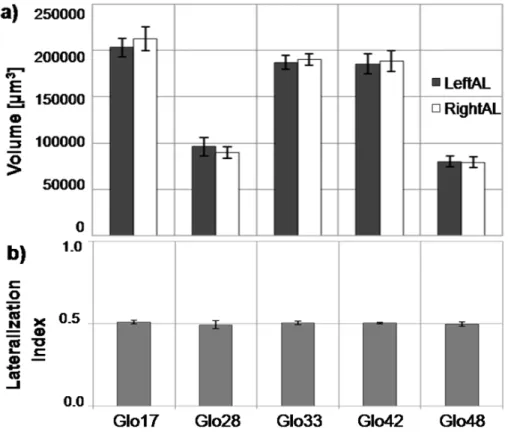
33 We chose a subset of easily identifiable glomeruli: 17, 28, 33, 42 and T1-48. This subset of glomeruli show very diverse activation pattern in functional imaging studies (Galizia et al., 1999b; Sachse et al., 1999), making them they candidates to magnify a possible odour-dependence bias in volumes between sides. Moreover, T1-48 is strongly linked in response to both linalool and isoamylacetate (Galizia et al., 1999b), i.e. those odours that have been showed the right antenna to be more sensitive to (An-fora et al., 2010). Finally, we also chose those glomeruli which had shown plastic rear-rangements of their volumes after odour experience in previous studies (Hourcade et
al., 2009). We selected Glomerulus T1-17 showing significant increased volume in both
odour conditioning experiments in (Hourcade et al., 2009), and T1-33 and T1-48 both significantly increased in one out of the two tests. We added Glomeruli T1-28 and T1-42 to our subset for their opposing odour response maps, the first having a rather broad-band, the second a rather sharp odour response bandwidth (Galizia et al., 1999b; Gal-izia and Menzel 2001) with a strongest response to e.g. 2-octanone, one of the sub-stances used in our behavioural tests.
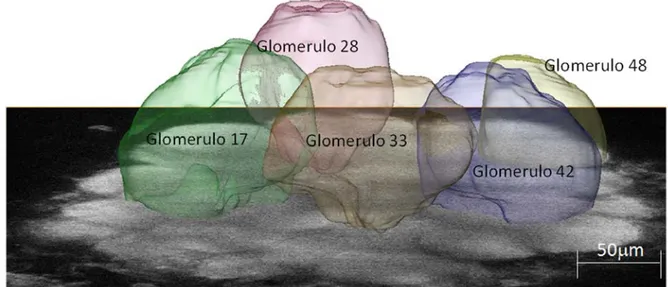
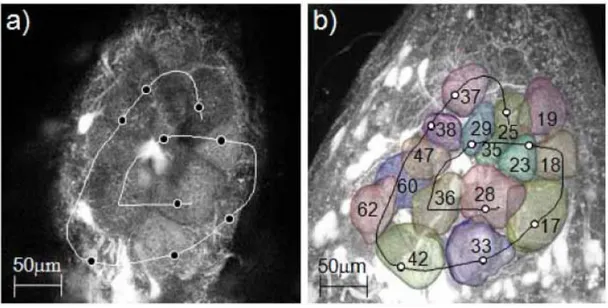
Image segmentation for the volumetric reconstruction was performed using the software Amira (Visualization Science Group). A semi-automatic protocol was defined, where single glomeruli were traced in the principal planes using the watershedding method “magic wand”. Then the volume images were reconstructed by the program’s wrapping interpolation method (Fig.3.1.2).
Fig. 3.1.2 Single image of the left antennal lobe of Apis mellifera at an imaging depth of
ap-proximately 80µm, superimposed with the reconstructed volume images of the analysed glomeruli.